albert Chan
What’s the Story?
This report presents the results of Coresight Research’s latest weekly survey of US consumers on the coronavirus outbreak, undertaken on July 29, 2020. We explore the trends we are seeing from week to week, following prior surveys on July 22, July 15, July 8, July 1, June 24, June 17, June 10, June 3, May 27, May 20, May 13, May 6, April 29, April 22, April 15, April 8, April 1, March 25 and March 17–18.
What Shoppers Are Doing and Where They Are Going
Over Eight in 10 Are Currently Avoiding Public Places
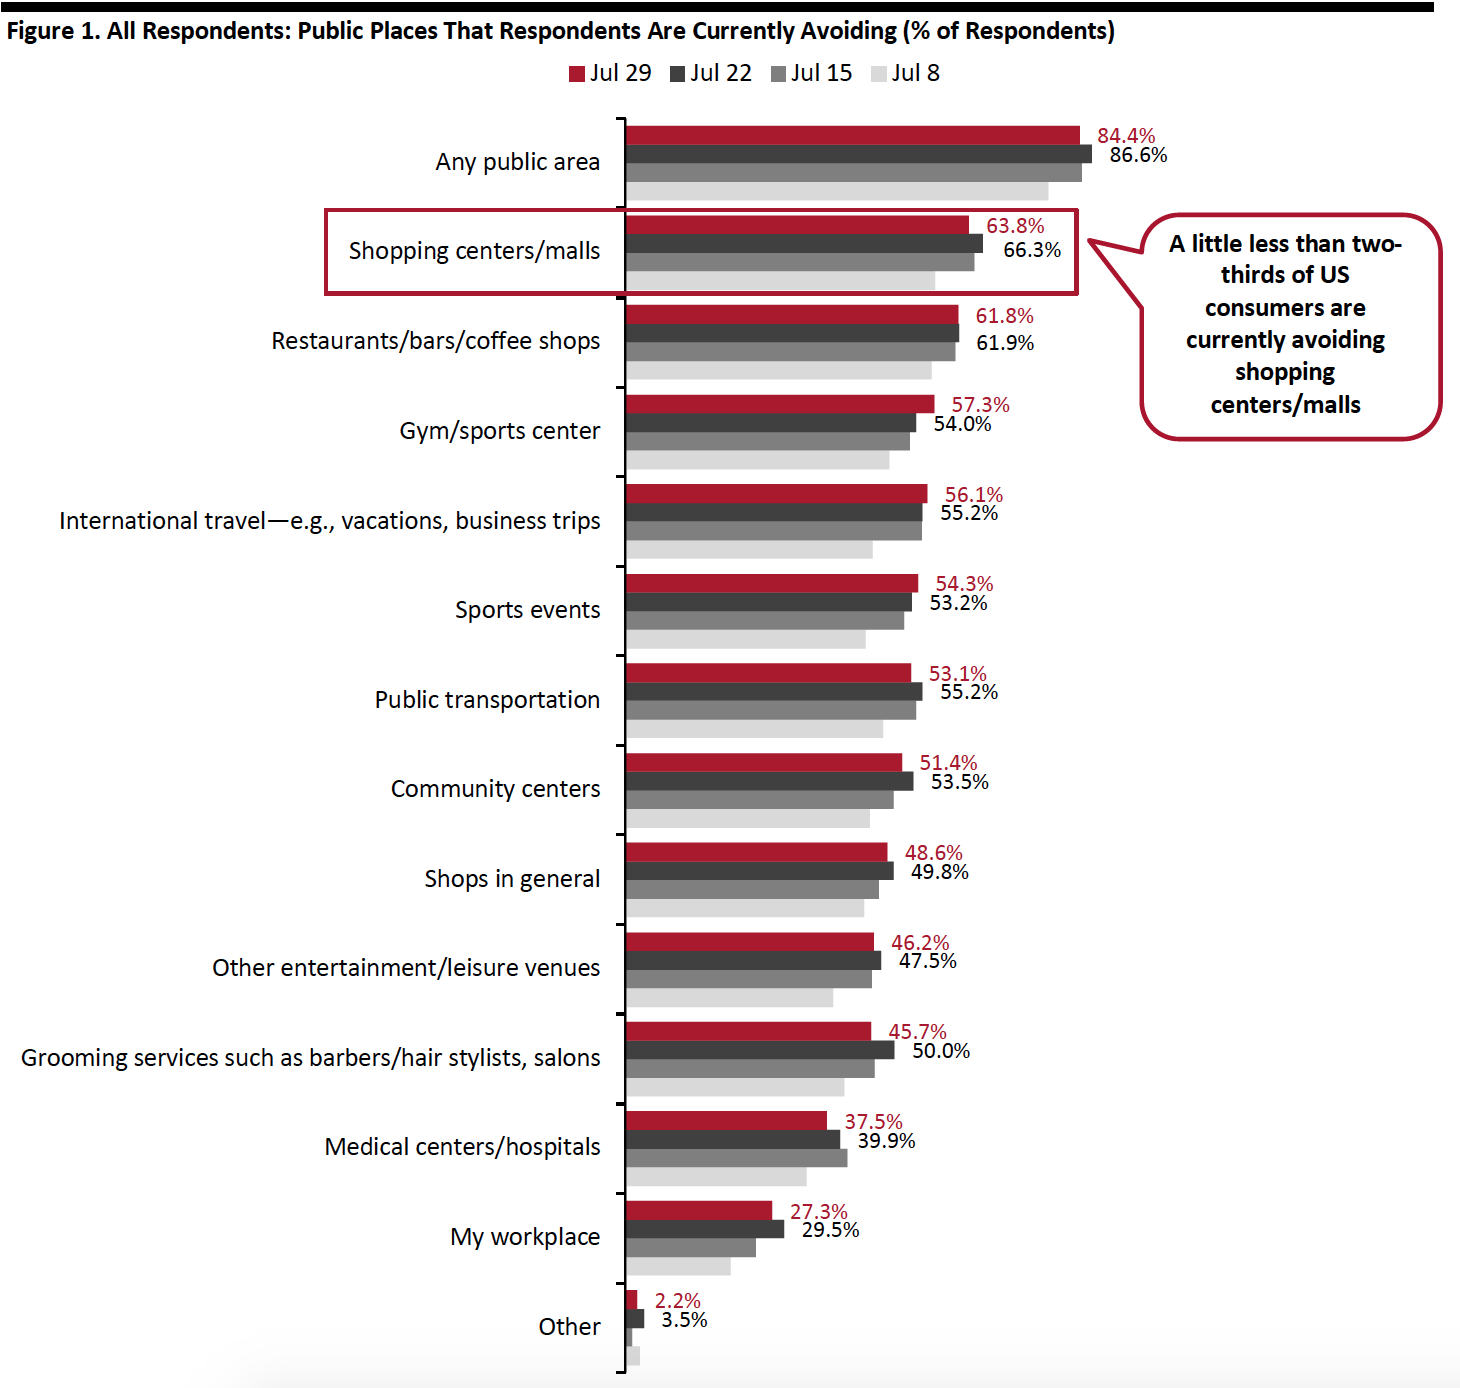
This week, the proportion of respondents saying that they are avoiding any type of public area remains high at 84.4%, although this is slightly below the 86.6% we saw last week. The avoidance rate has jumped by five percentage points since the beginning of July, reflecting consumers’ increasing concerns over rising coronavirus cases in several states.
We saw decreases of avoidance in some of the 14 options provided, albeit changes were within the margin of error:
- The proportion of respondents that are currently avoiding shopping centers/malls went down slightly this week, after increases for two consecutive weeks. Some 63.8% said they are currently avoiding these places, versus two-thirds last week.
- The proportion of respondents that are currently avoiding food-service locations has been stable at around 62% since the week of July 15.
- Avoidance of shops in general came in at 51.4% this week, compared to 53.5% last week.
- Grooming service providers, including barbers and salons, saw the highest decline in avoidance rate this week, of four percentage points: Some 45.7% of respondents are currently avoiding these places, versus 50% last week.
 Respondents could select multiple options
Base: US Internet users aged 18+
Source: Coresight Research[/caption]
Slightly More Consumers Visited Shopping Malls in the Past Two Weeks
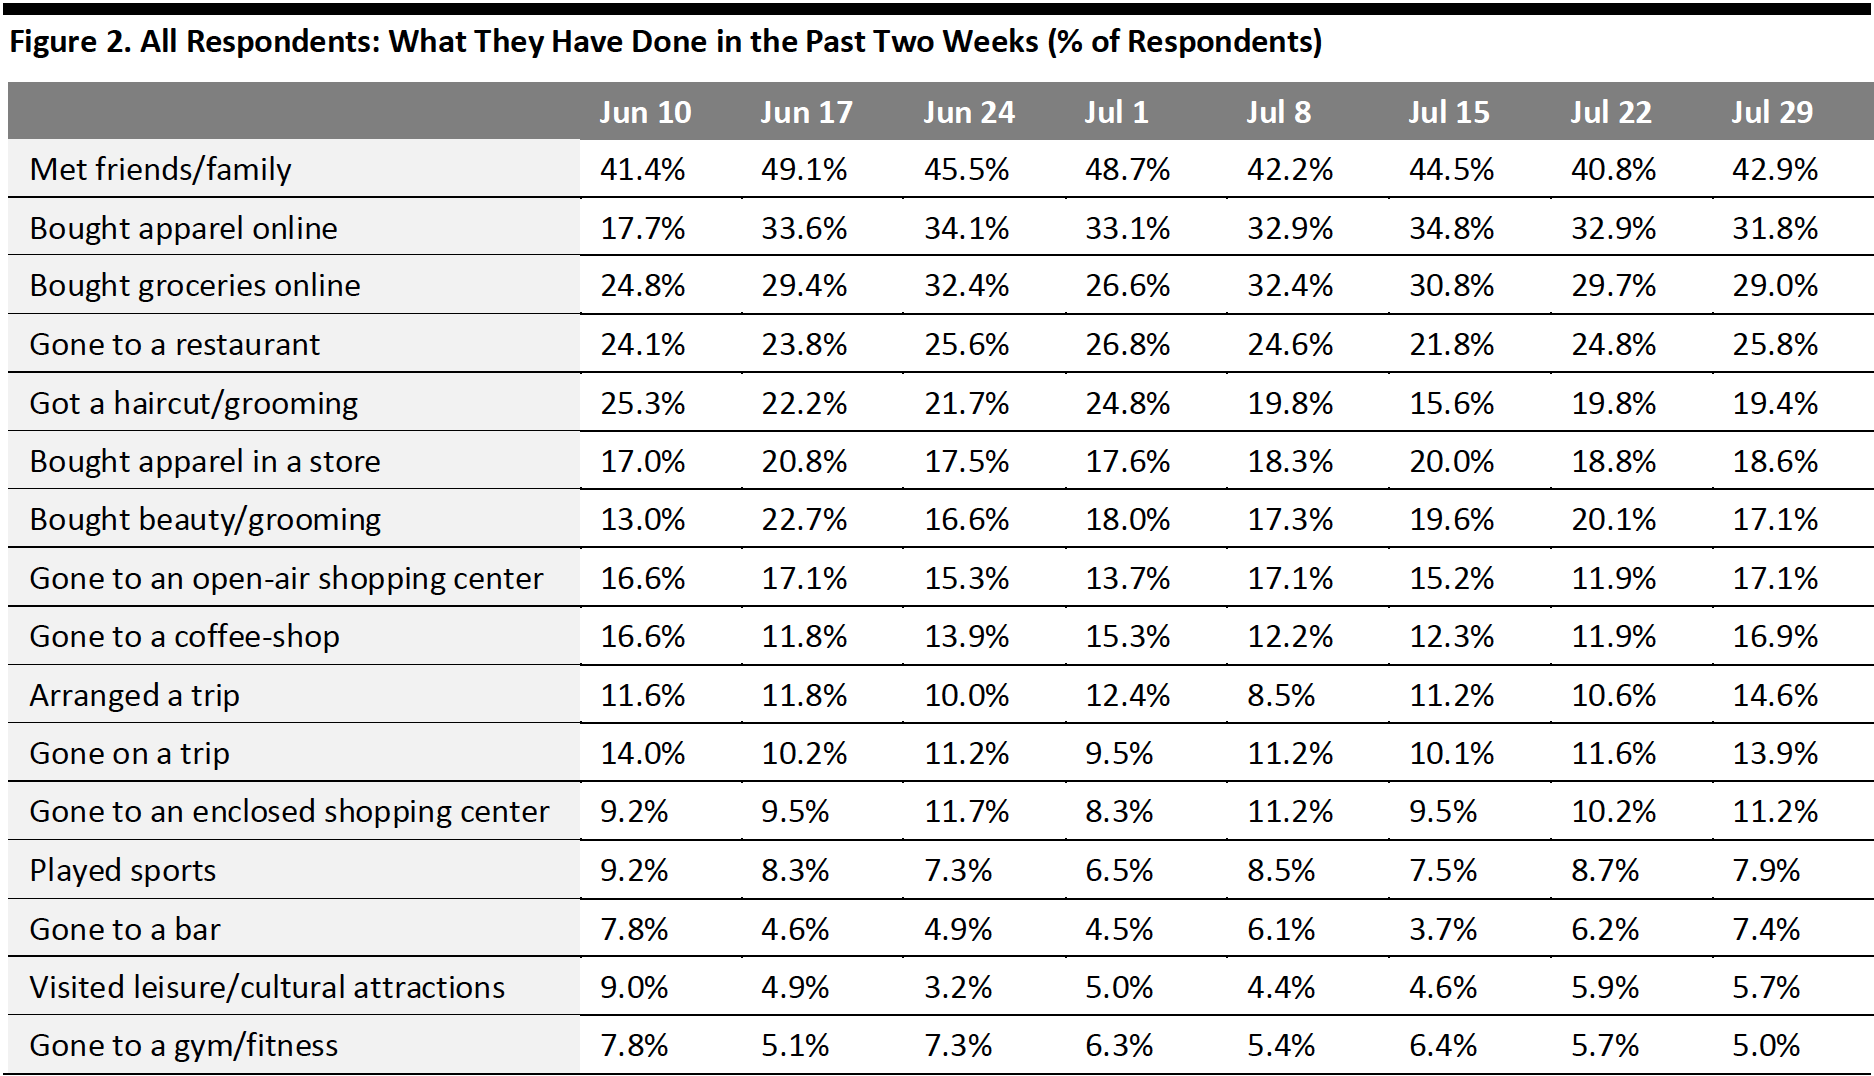
Each week, we ask consumers what they have done in the past two weeks. This week, we saw increases in the proportions of respondents for half of the 16 options we provided for activities done recently—although most were within the margin of error.
- The proportion of respondents who had bought apparel online in the past two weeks fell slightly, from one-third last week to 31.8% this week. This is aligned with the lower proportion of consumers who are buying more apparel online than before the crisis (discussed later in the report). Some 18.6% had bought apparel in a store, broadly level with last week.
- While the absolute percentage is still low, we saw the proportion of respondents that had visited an open-air shopping center bounce back five percentage points after reaching the lowest level last week. One in six had visited there this week, up from 11.9% last week. Some 11.2% of respondents had visited an enclosed shopping mall, versus 10.2% last week.
- The proportion of respondents who had gone to food-service locations—including restaurants and bars—in the past two weeks continued to rise this week. One-quarter had dined in a restaurant, versus 24.8% last week. We also saw more consumers had gone to a coffee shop in the past two weeks: One in six reported such visits, up five percentage points from 11.9% last week.
- The proportion of respondents who had bought groceries online has been declining at a slow pace since the week of July 8. Some 29.0% had done so this week, compared to almost one-third three weeks ago.
 Respondents could select multiple options
Base: US Internet users aged 18+
Source: Coresight Research[/caption]
More Consumers Expect To Get a Haircut in the Next Two Weeks
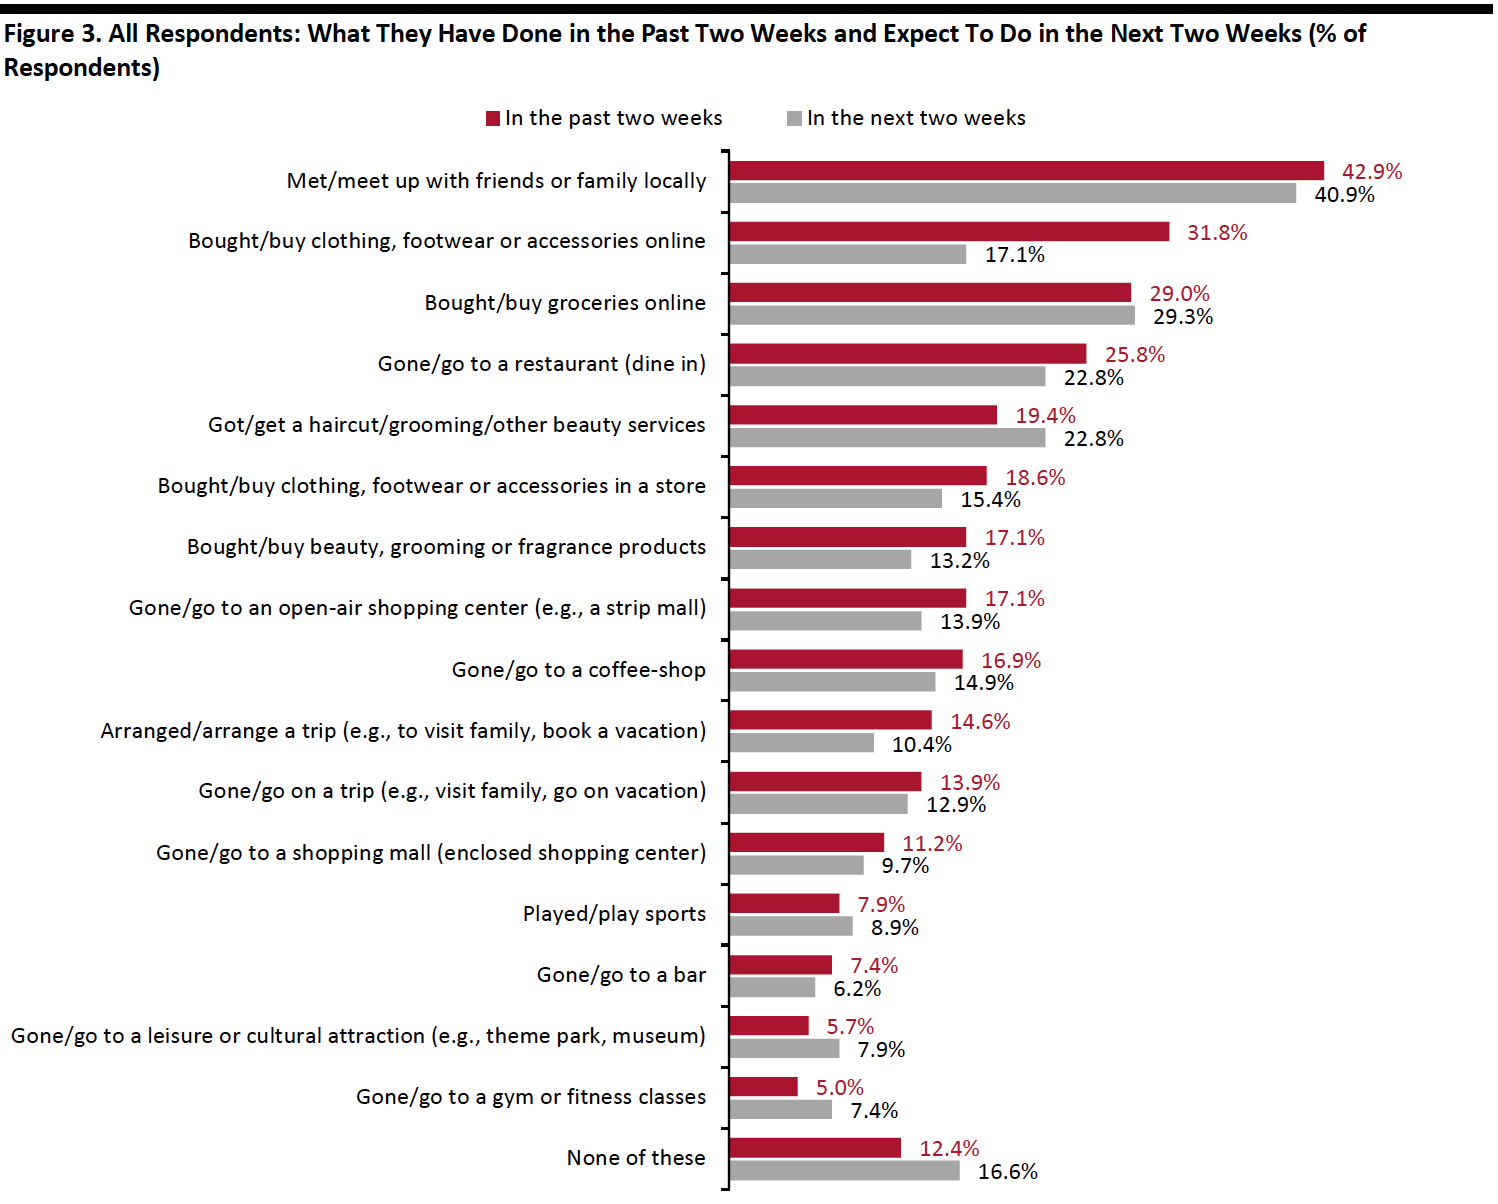
Each week, we also ask consumers what they expect to do in the next two weeks, with a comparable set of options to those for the last two weeks. In the chart below, we compare these short-term expectations with recent actual behavior.
We saw slightly higher proportions of consumers expecting to do a few non-shopping activities in the next two weeks than actual behavior in the past two weeks:
- Some 22.8% expect to go to a get a haircut/grooming in the next two weeks, up from almost one-fifth of those who had done so in the previous two weeks.
- Less than one in 10 plan to play sports in the next two weeks, versus 7.9% that had done so in the past two weeks.
We have seen a consistent pattern of lower expectations to make discretionary purchases, while expectations of shopping for groceries remain high. This reflects that consumers may not plan their discretionary shopping in advance.
- Almost three in 10 expect to buy groceries online in the next two weeks, roughly the same as those that had bought before.
- Some 17.1% expect to buy clothing or footwear online in the next two weeks, close to the 15.4% planning to do so in a store.
- Some 13.9% plan to go to an open-air center in the next two weeks, versus only one in ten that expect to visit an enclosed mall.
 Respondents could select multiple options
Base: US Internet users aged 18+
Source: Coresight Research[/caption]
Reviewing Trend Data in Current Purchasing Behavior
What Consumers Are Currently Buying More Of and Less Of
The proportion of respondents that are currently buying more of any category increased slightly to 63.8% this week from 61.1% last week. The proportion of respondents that are currently buying less returned to the level we saw two weeks ago. Some 56.6% of consumers are currently buying less, up nine percentage points from 47.3% last week.
- Buying more of certain categories and buying less of certain categories were not mutually exclusive options, so respondents could answer yes to both.
Buying more: Essentials, including household products, food and personal care, are again ranked as top categories that consumers are buying more of. The proportion of consumers buying food went up to 36.5%, from 30.9% last week.
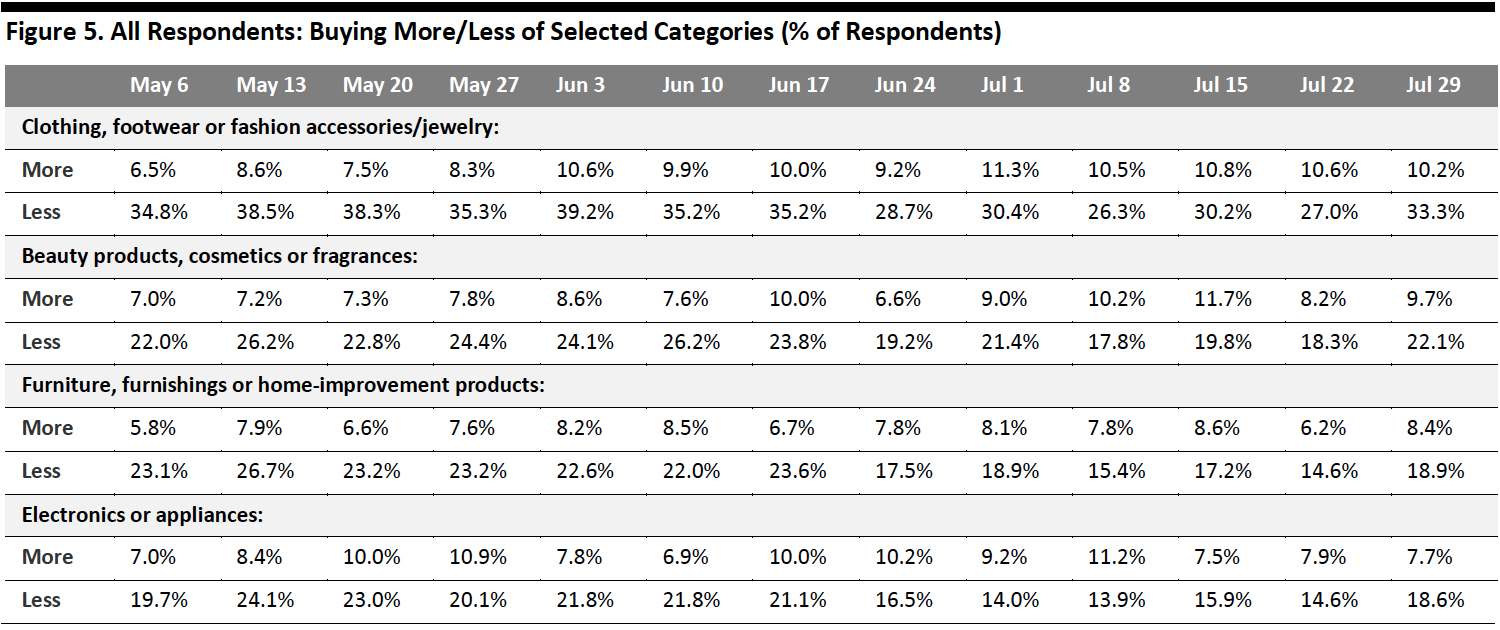
Buying less: We continue to witness fluctuations in the proportions of respondents buying less in discretionary categories in the past couple of weeks. This week, we saw more consumers are buying less in all of the discretionary categories tracked in Figure 5. One-third are currently spending less on apparel, up six percentage points from 27.0% last week. Beauty is the second most-cut category, with 22.1% currently buying less. Home products and electronics both saw around 19% of respondents who are buying less in these categories.
Ratio of less to more: The ratios of the proportions of respondents buying less to the proportions buying more in all discretionary categories except home went up this week: The ratio for apparel was 3.3 this week, up from 2.5 last week; the ratio for beauty stood at 2.3, versus 2.2 last week; and the ratio for electronics increased to 2.4 from 1.8 last week. The ratio for home declined to 2.2 from 2.4 last week.
[caption id="attachment_113844" align="aligncenter" width="700"]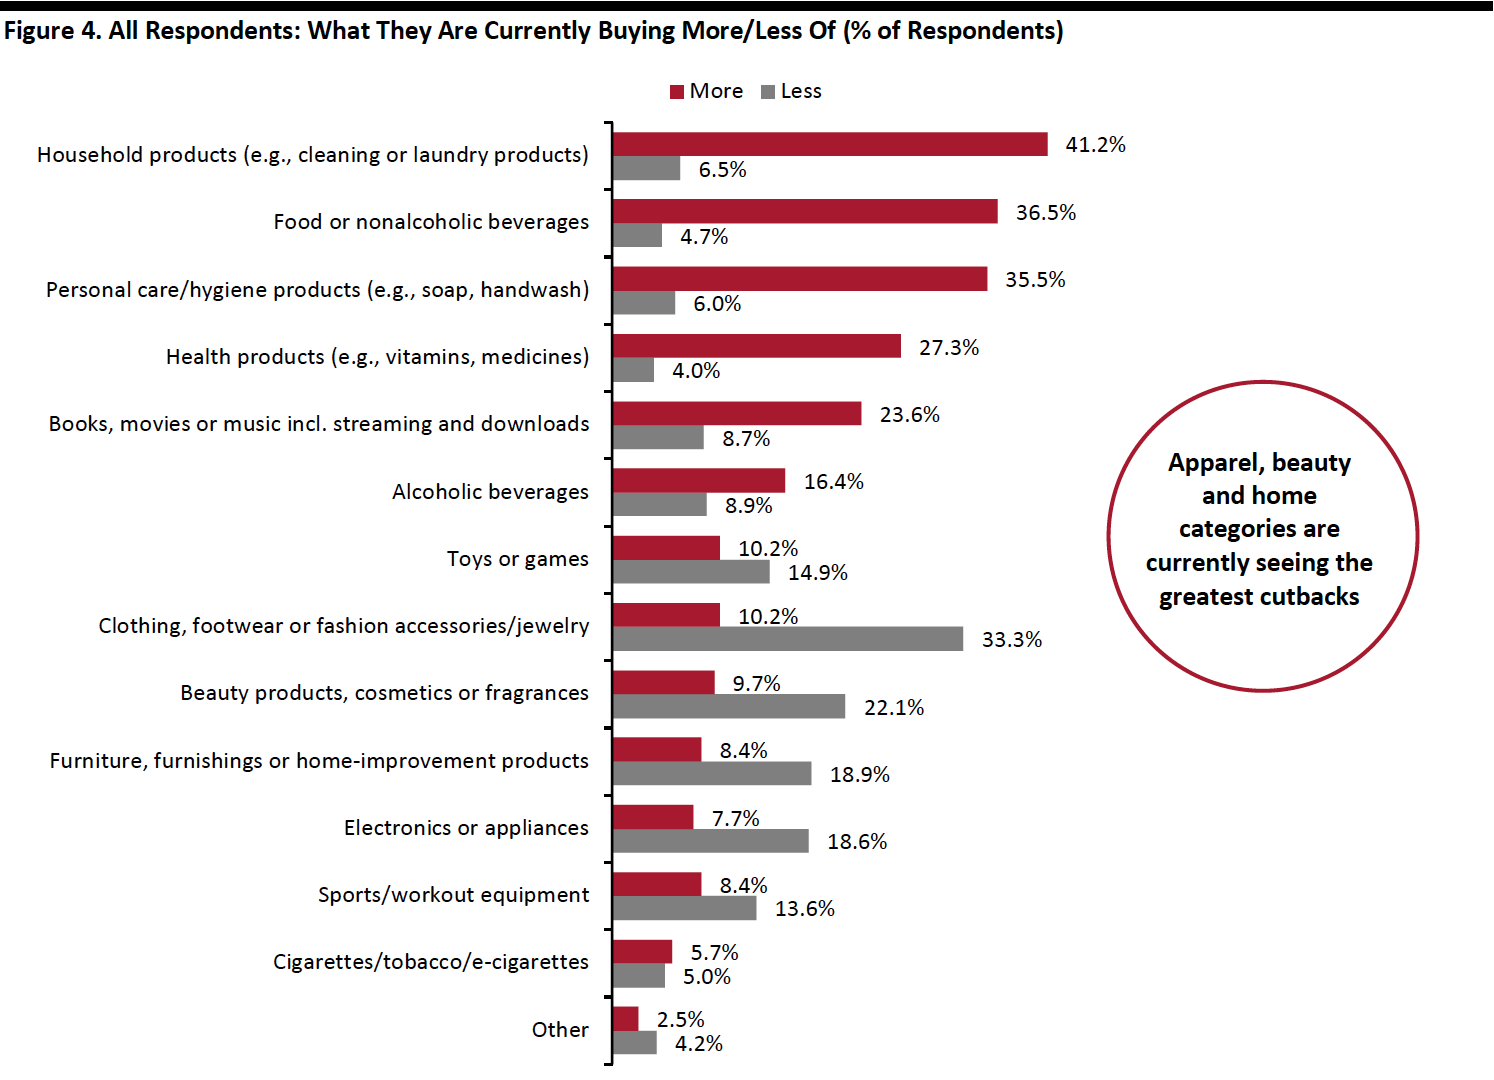 Respondents could select multiple options
Base: US Internet users aged 18+
Source: Coresight Research[/caption] [caption id="attachment_113845" align="aligncenter" width="700"]
 Base: US Internet users aged 18+
Source: Coresight Research[/caption]
Fewer than Seven in 10 Are Switching Spending Online
This week, the proportion of consumers switching spending to e-commerce slid to a new low: Some 68.5% of consumers stated that they are buying more online than they used to this week, versus 71.0% last week. This also represents a fall of eight percentage points from the peak of 76.4% in the week of June 24. The declining trend might suggest that consumers are gradually switching some of their spending back to brick-and-mortar stores, despite the high avoidance of public places noted earlier.
[caption id="attachment_113846" align="aligncenter" width="700"]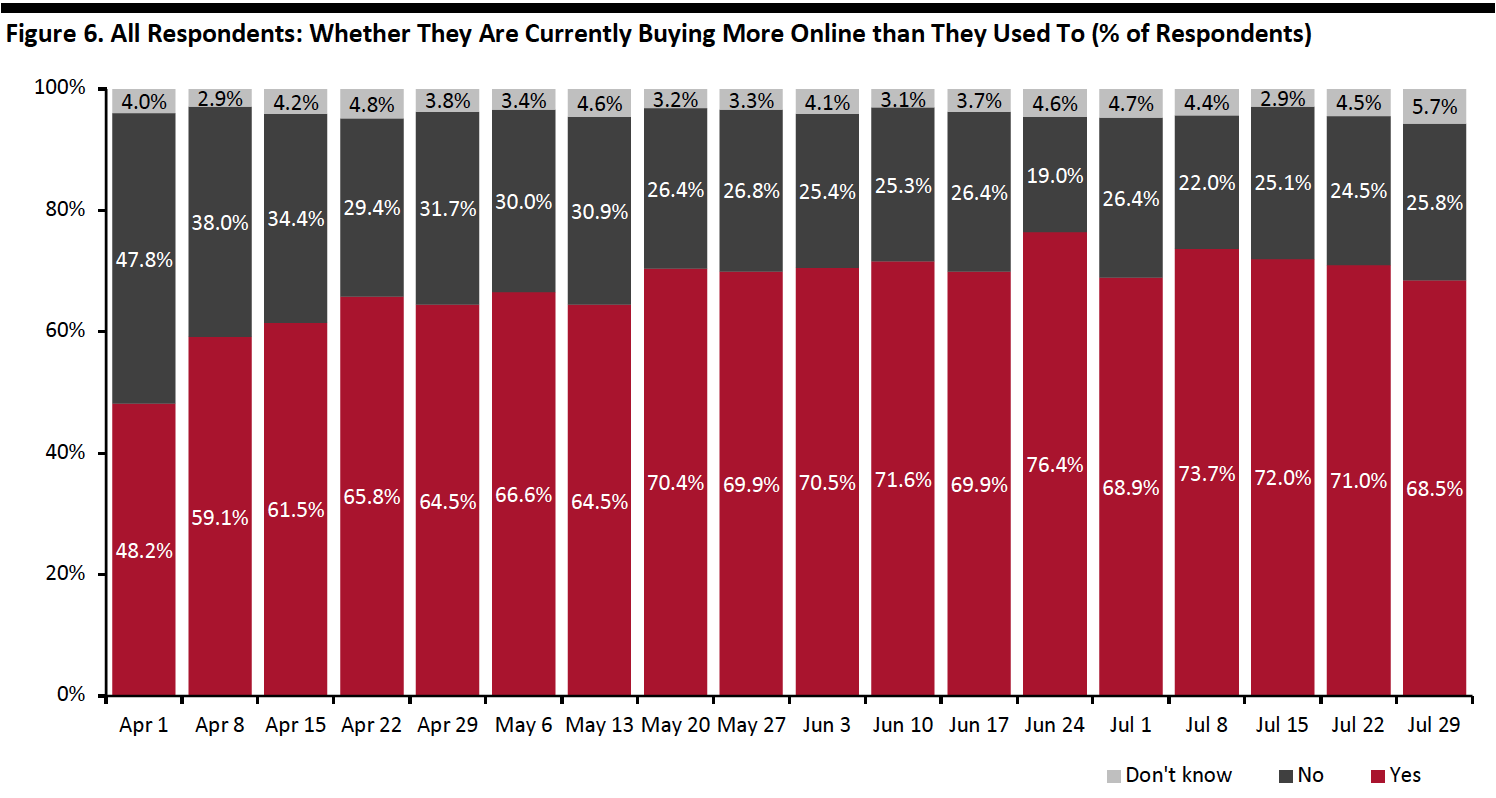 Base: US Internet users aged 18+
Source: Coresight Research[/caption]
What Consumers Are Currently Buying More Of Online
This week, we saw the proportion of consumers that are currently buying more household products online than they used to drop slightly to 29.3%, from 32.9% last week. Media products and streaming saw the highest increase of five percentage points, with 28.5% saying they are currently buying more online.
The proportion of consumers that are currently buying more apparel online, which saw a big jump last week, fell back slightly to 28.3% this week. However, other discretionary categories, including beauty, home and electronics all saw increases this week: Some 18.6% are currently buying more beauty online than they used to—the highest level we have seen in the past few weeks, versus 15.8% last week; one in six are buying more electronics, compared to 15.3% last week; and 11.2% are buying more home products, versus one in ten last week.
[caption id="attachment_113847" align="aligncenter" width="700"]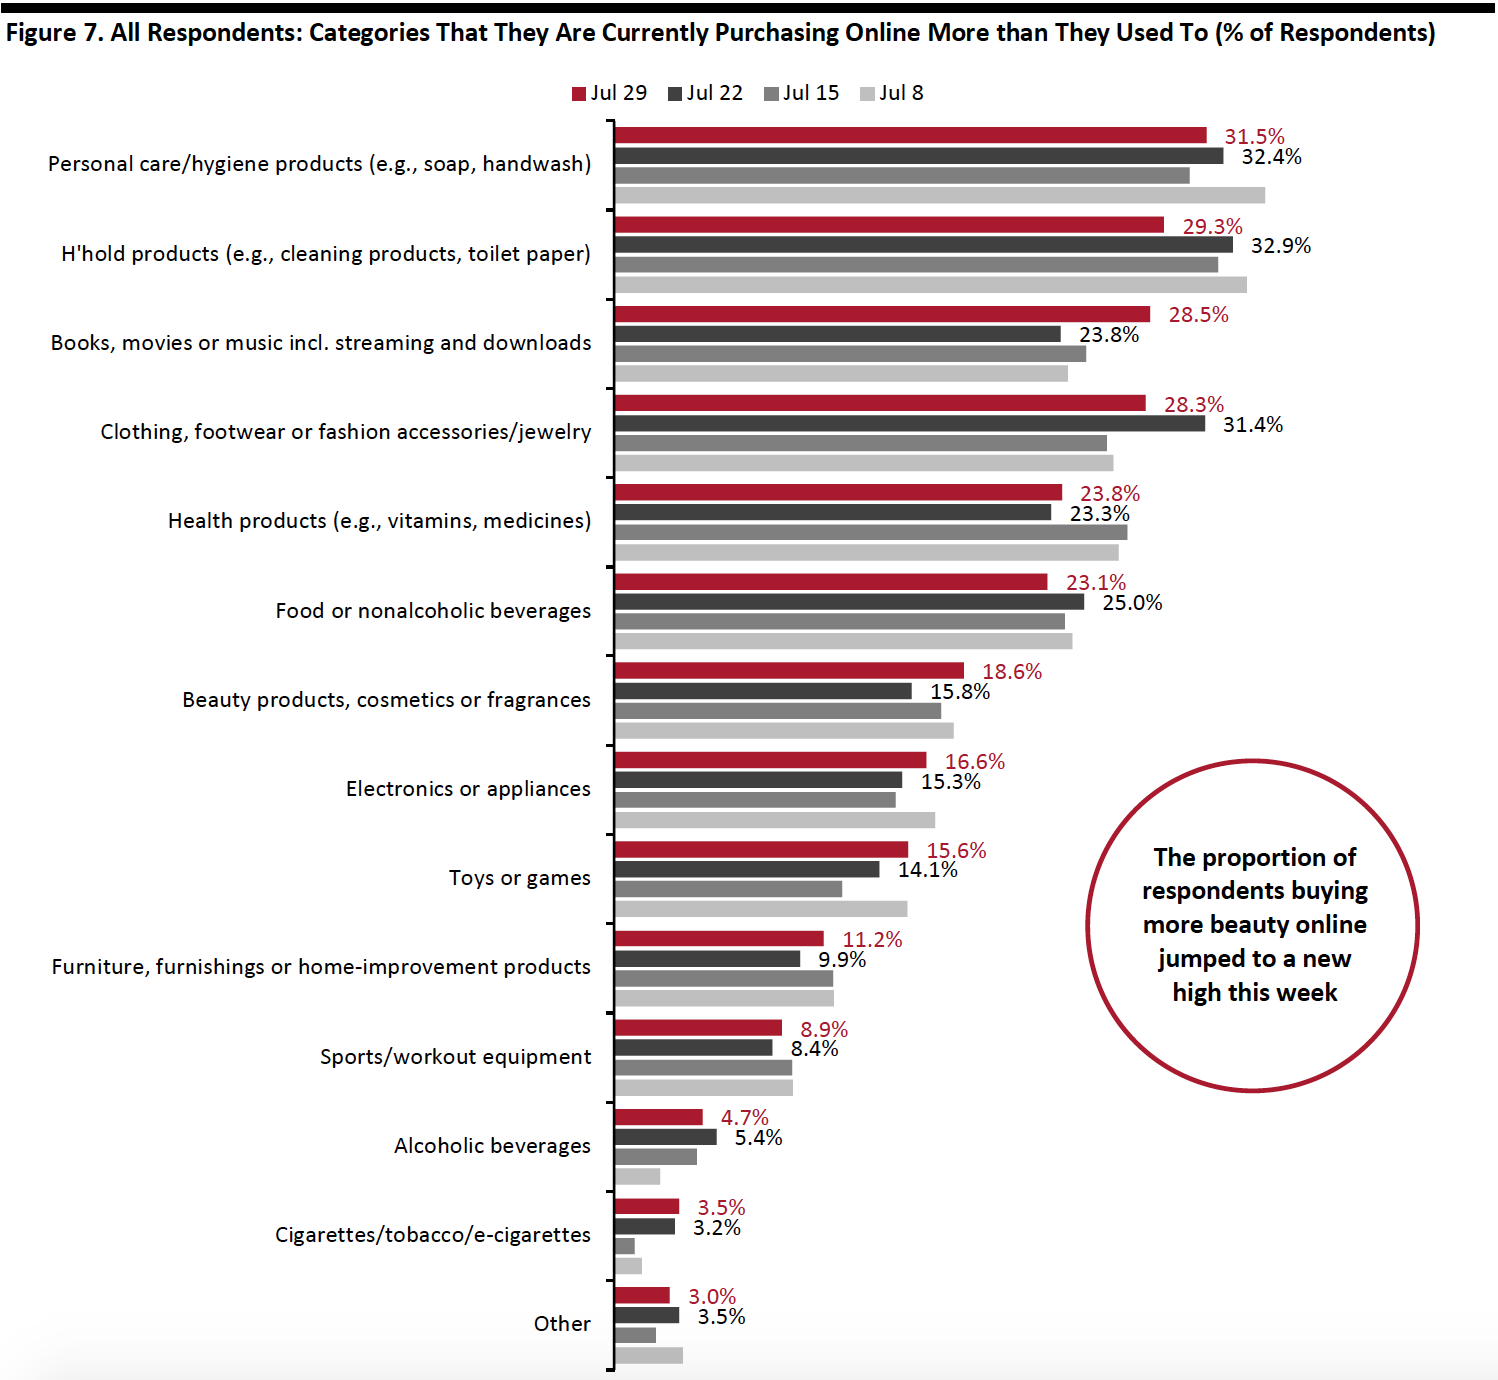 Respondents could select multiple options
Base: US Internet users aged 18+
Source: Coresight Research[/caption]
Methodology
We surveyed respondents online on July 29 (403 respondents), July 22 (404 respondents), July 15 (454 respondents), July 8 (410 respondents), July 1 (444 respondents), June 24 (411 respondents), June 17 (432 respondents), June 10 (423 respondents), June 3 (464 respondents), May 27 (422 respondents), May 20 (439 respondents), May 13 (431 respondents), May 6 (446 respondents), April 29 (479 respondents), April 22 (418 respondents), April 15 (410 respondents), April 8 (450 respondents), April 1 (477 respondents), March 25 (495 respondents) and March 17–18 (1,152 respondents). The most recent results have a margin of error of +/- 5%, with a 95% confidence interval. Not all charted week-over-week differences may be statistically significant.