
albert Chan
What’s the Story?
This report presents the results of Coresight Research’s latest weekly survey of US consumers, including on the impacts of the coronavirus outbreak, undertaken on December 1. We explore the trends we are seeing from week to week, following prior surveys on November 24, November 17, November 10, November 3, October 27, October 20, October 13, October 6, September 29, September 22, September 15, September 9, September 2, August 26, August 19, August 12, August 5, July 29, July 22, July 15, July 8, July 1, June 24, June 17, June 10, June 3, May 27, May 20, May 13, May 6, April 29, April 22, April 15, April 8, April 1, March 25 and March 17–18.
Thanksgiving-to-Cyber Monday Holiday Weekend Shopping
This week, we asked about US consumers’ shopping activities during the period from Thanksgiving to Cyber Monday (November 26–30, 2020). We asked respondents:
- Whether they had carried out any of the listed shopping activities
- What product categories they had bought, whether in-store or online over the period
- Whether they agreed with any of nine attitudinal and behavioral statements on the holiday weekend spanning Thanksgiving to Cyber Monday
Consumers Opt for Online Shopping
Online remained the preferred shopping channel over the extended weekend from Thanksgiving to Cyber Monday amid the pandemic. Some 64.6% of respondents had shopped online, compared to 26.5% that had shopped in-store. This supports our estimation of growth of approximately one-third in e-commerce during the holiday quarter. Online shopping was driven by the consumer group aged under 45, with roughly seven in 10 having done so.
Some 22.9% did not shop at all over the extended weekend, which could reflect early Black Friday deals and early holiday shopping. This option peaked among the oldest consumer group.
[caption id="attachment_120368" align="aligncenter" width="700"]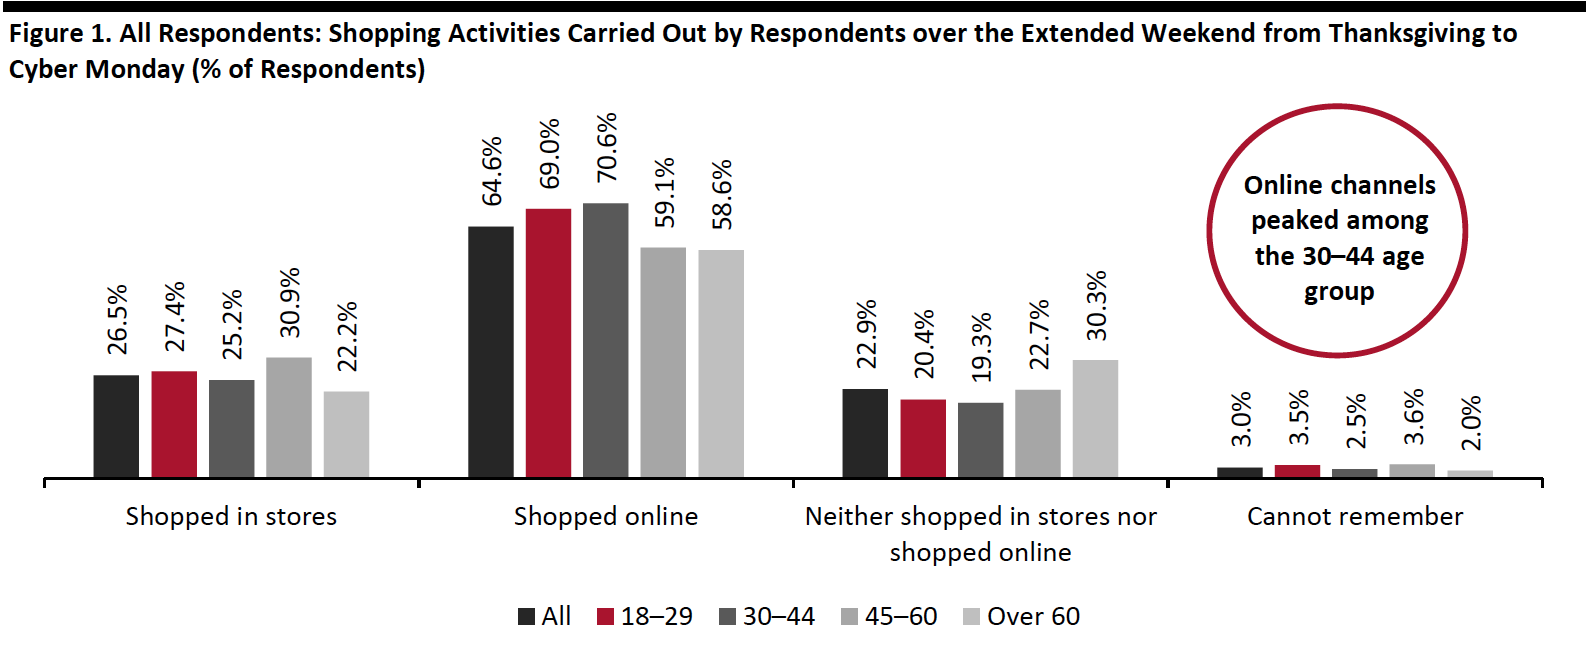 Base: 441 US respondents aged 18+
Source: Coresight Research[/caption]
A separate question confirms that consumers shopped more online, less in-store than last year this extended Thanksgiving weekend: Some 45.3% of Thanksgiving weekend shoppers said they had shopped more online, and 38.5% had shopped less in stores than last year.
[caption id="attachment_120369" align="aligncenter" width="550"]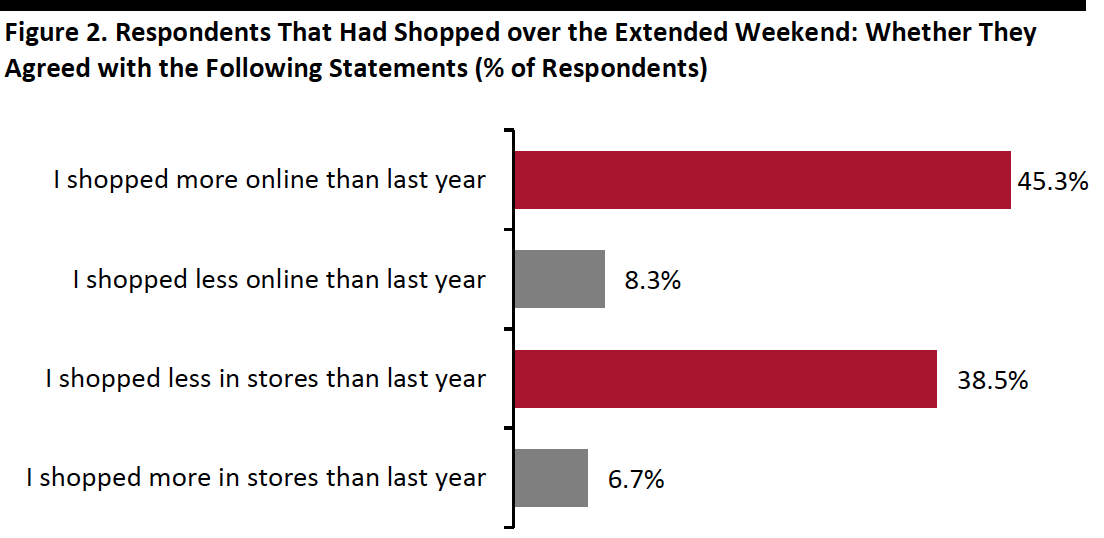 Base: 327 US respondents aged 18+ who had shopped over the extended weekend from Thanksgiving to Cyber Monday
Source: Coresight Research[/caption]
Appear and Footwear Is the Most-Shopped Category
Clothing, footwear or accessories was the number-one category consumer had shopped for, whether in-store or online over the extended weekend. Some 46.8% of Thanksgiving weekend shoppers had shopped this category, which suggests a holiday-driven improvement in this hard-hit category. Clothing and footwear remains a top option for holiday gifting and, even while everyday demand for apparel is likely to remain low (such as for the workplace), gifting should help to ease total category declines, versus pre-holiday months.
Apparel was followed by electronics, with 37.3% of Thanksgiving shoppers reporting that they had shopped in this category. This echoes the finding we discuss later in the report of record-low ratios of consumers buying less to those buying more in both apparel and electronics.
Another popular product category was pet products, with one-quarter of respondents reporting that they had shopped this category—likely helped by a boom in pet ownership during Covid-19.
Home products, including home improvement and furniture categories, which have performed strongly since the beginning of the pandemic, ranked as the lowest of the category options for Thanksgiving weekend shopping.
[caption id="attachment_120370" align="aligncenter" width="550"]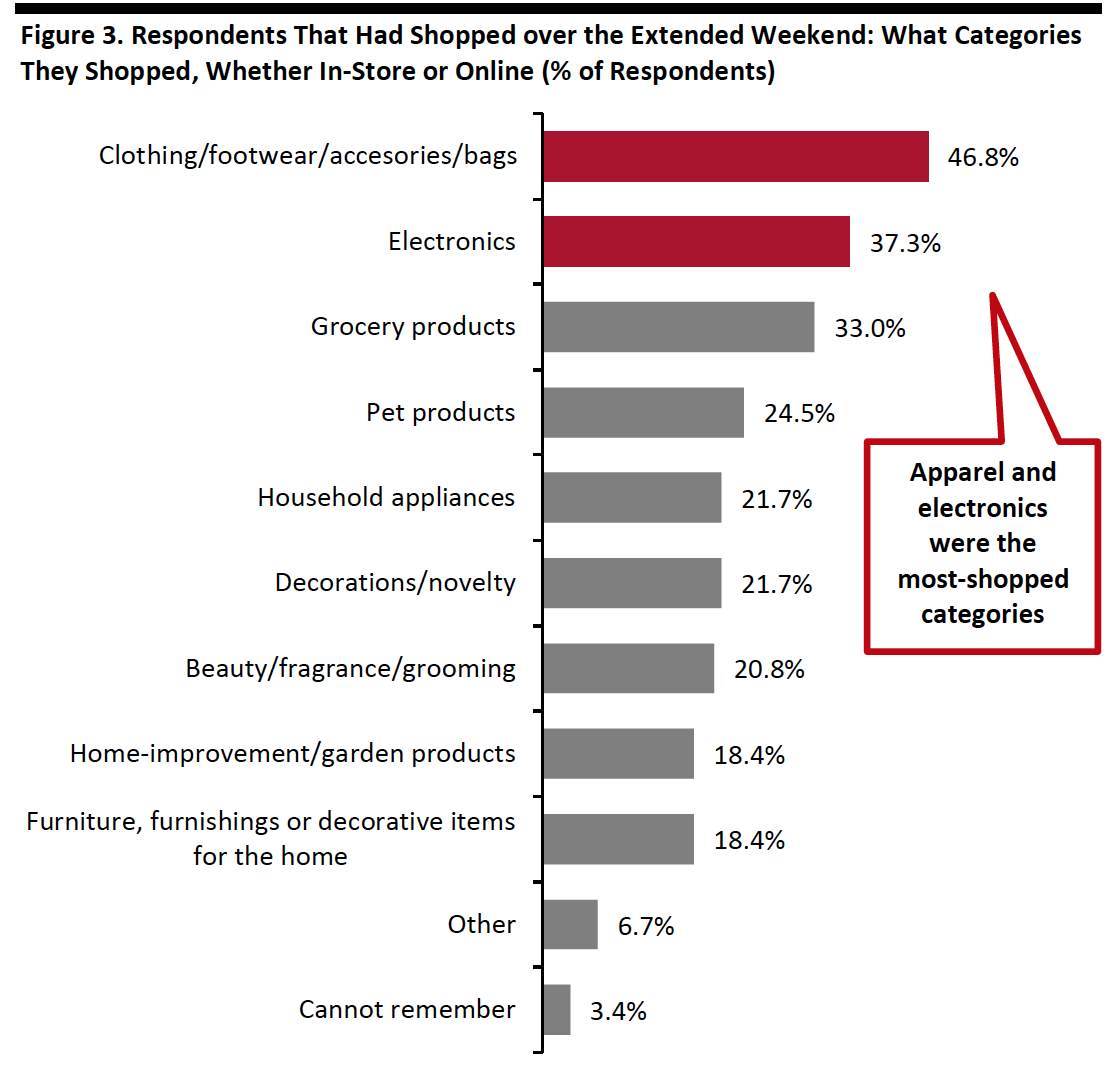 Base: 327 US respondents aged 18+ who had shopped over the extended weekend from Thanksgiving to Cyber Monday
Source: Coresight Research[/caption]
One-Quarter Are Disappointed with the Discounts This Year
With holiday promotions kicking off early this year, some 23.9% of Thanksgiving weekend shoppers said they had already shopped for deals earlier in November.
One-quarter of respondents said that they were disappointed with the deals and discounts this year, and one-fifth reported being disappointed with product availability—reflecting a potential lack of inventory or distribution capacity among retailers for the Thanksgiving weekend. Many retailers have been rolling out Black Friday promotions since early November instead of the typical one-day doorbuster deals seen in previous years, so consumers might not feel they got the best bargain over the Black Friday and Cyber Monday weekend.
Adoption of curbside pickup remained relatively niche, with only 13.2% reporting that they had used such a service, compared to 17.1% that had used in-store pickup.
[caption id="attachment_120371" align="aligncenter" width="700"]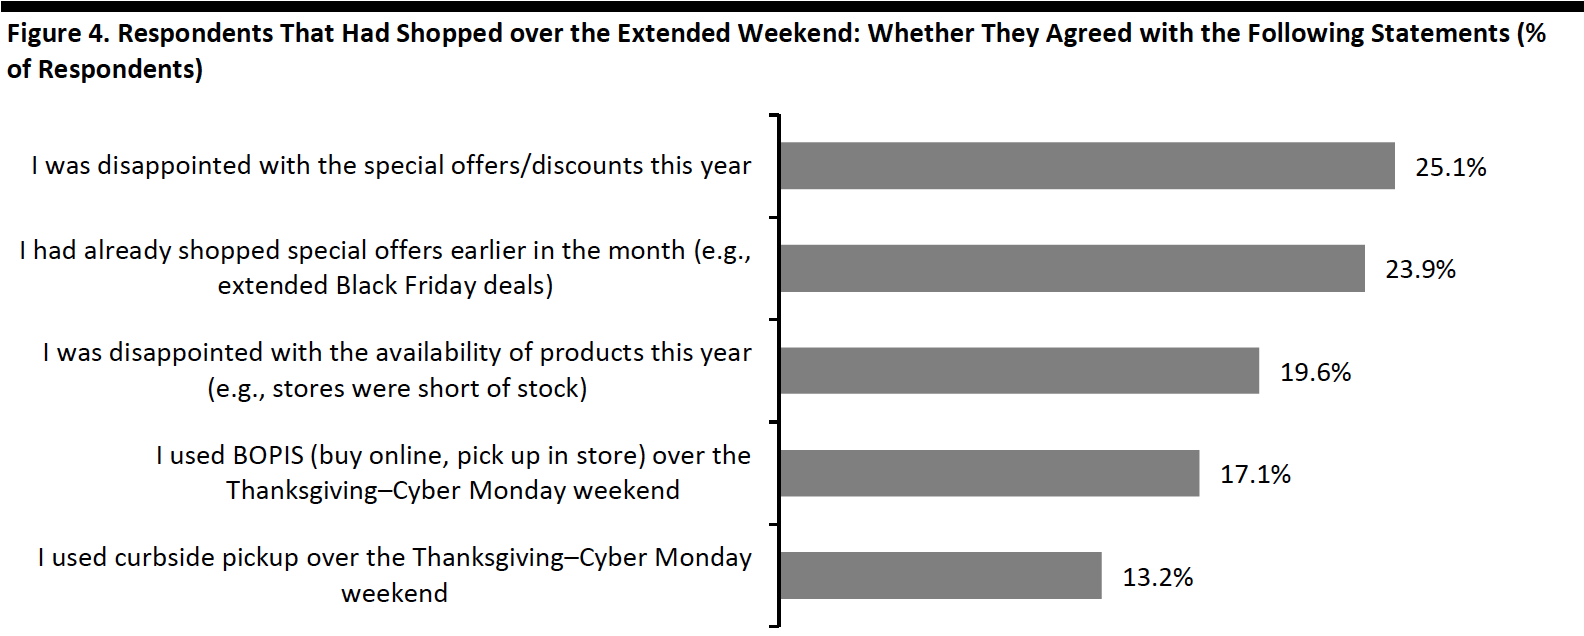 Base: 327 US respondents aged 18+ who had shopped over the extended weekend from Thanksgiving to Cyber Monday
Source: Coresight Research[/caption]
What Shoppers Are Doing and Where They Are Going
More Consumers Had Bought Apparel Online in the Past Two Weeks
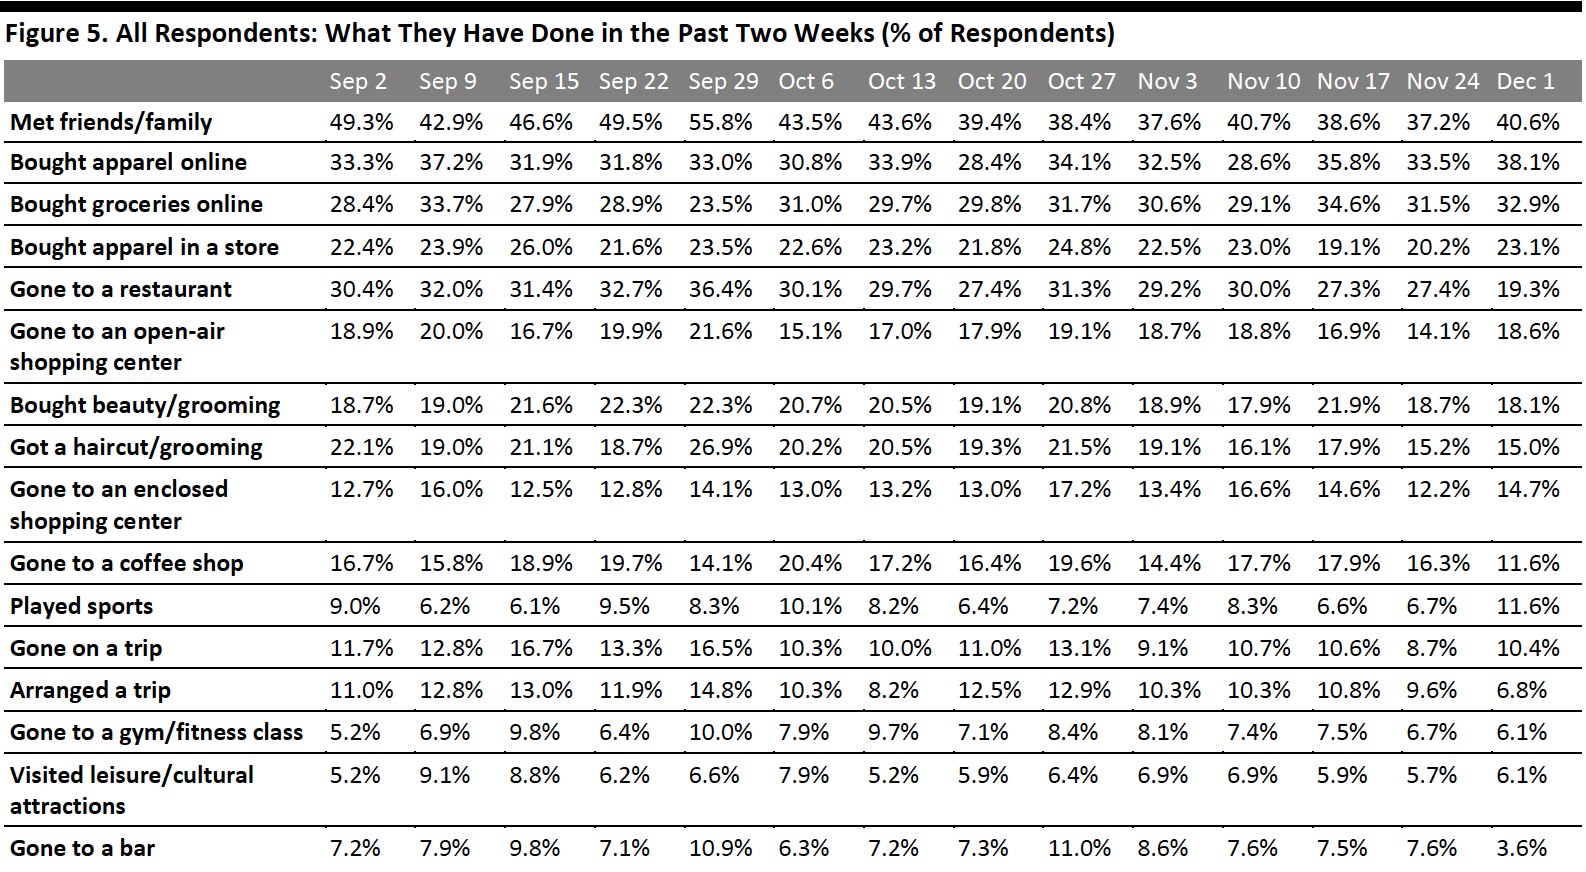
Each week, we ask consumers what they have done in the past two weeks. This week, the proportion of respondents slightly increased for half of the 16 options we provided for recent activities. Some of the week-over-week changes were within the margin of error; however, the directional trends, including over a number of weeks, can prove informative.
Reflecting the recent Thanksgiving weekend, more consumers this week told us that they had bought apparel online while fewer visited food-service locations. This week, the survey outcomes showed:
- A week-over-week jump of five percentage points for online apparel shopping, to a new high since June. Some 38.1% of respondents had bought clothing, footwear or accessories online in the past two weeks, versus around one-third last week. In-store apparel shopping increased slightly, to 23.1% from one-fifth last week, but remained much lower than the online level—reflecting consumers’ tendency to shop apparel online during the holiday season.
- Visits to food-service locations fell significantly this week. Around one-fifth had gone to a restaurant, down eight percentage points from 27.3% in the previous week. The proportion of consumers that had gone to a coffee shop tumbled by five percentage points to 11.6% this week. We also saw an increase in online grocery shopping, although to a smaller extent: One-third of respondents had bought groceries online, versus 31.5% last week.
- Also reflecting the post-Black Friday timing of our survey, visits to both open-air and enclosed shopping centers rebounded slightly after witnessing a declining trend in previous weeks. Some 18.6% had visited an open-air shopping center, up by almost five percentage points from last week. Only 14.7% had gone to an enclosed shopping center, compared to 12.2% last week. The low percentage is aligned with the high avoidance rate in such locations, which we discuss later in this report.
 Respondents could select multiple options
Base: US respondents aged 18+
Source: Coresight Research[/caption]
More Consumers Expect To Get a Haircut than Actual Behavior Indicates
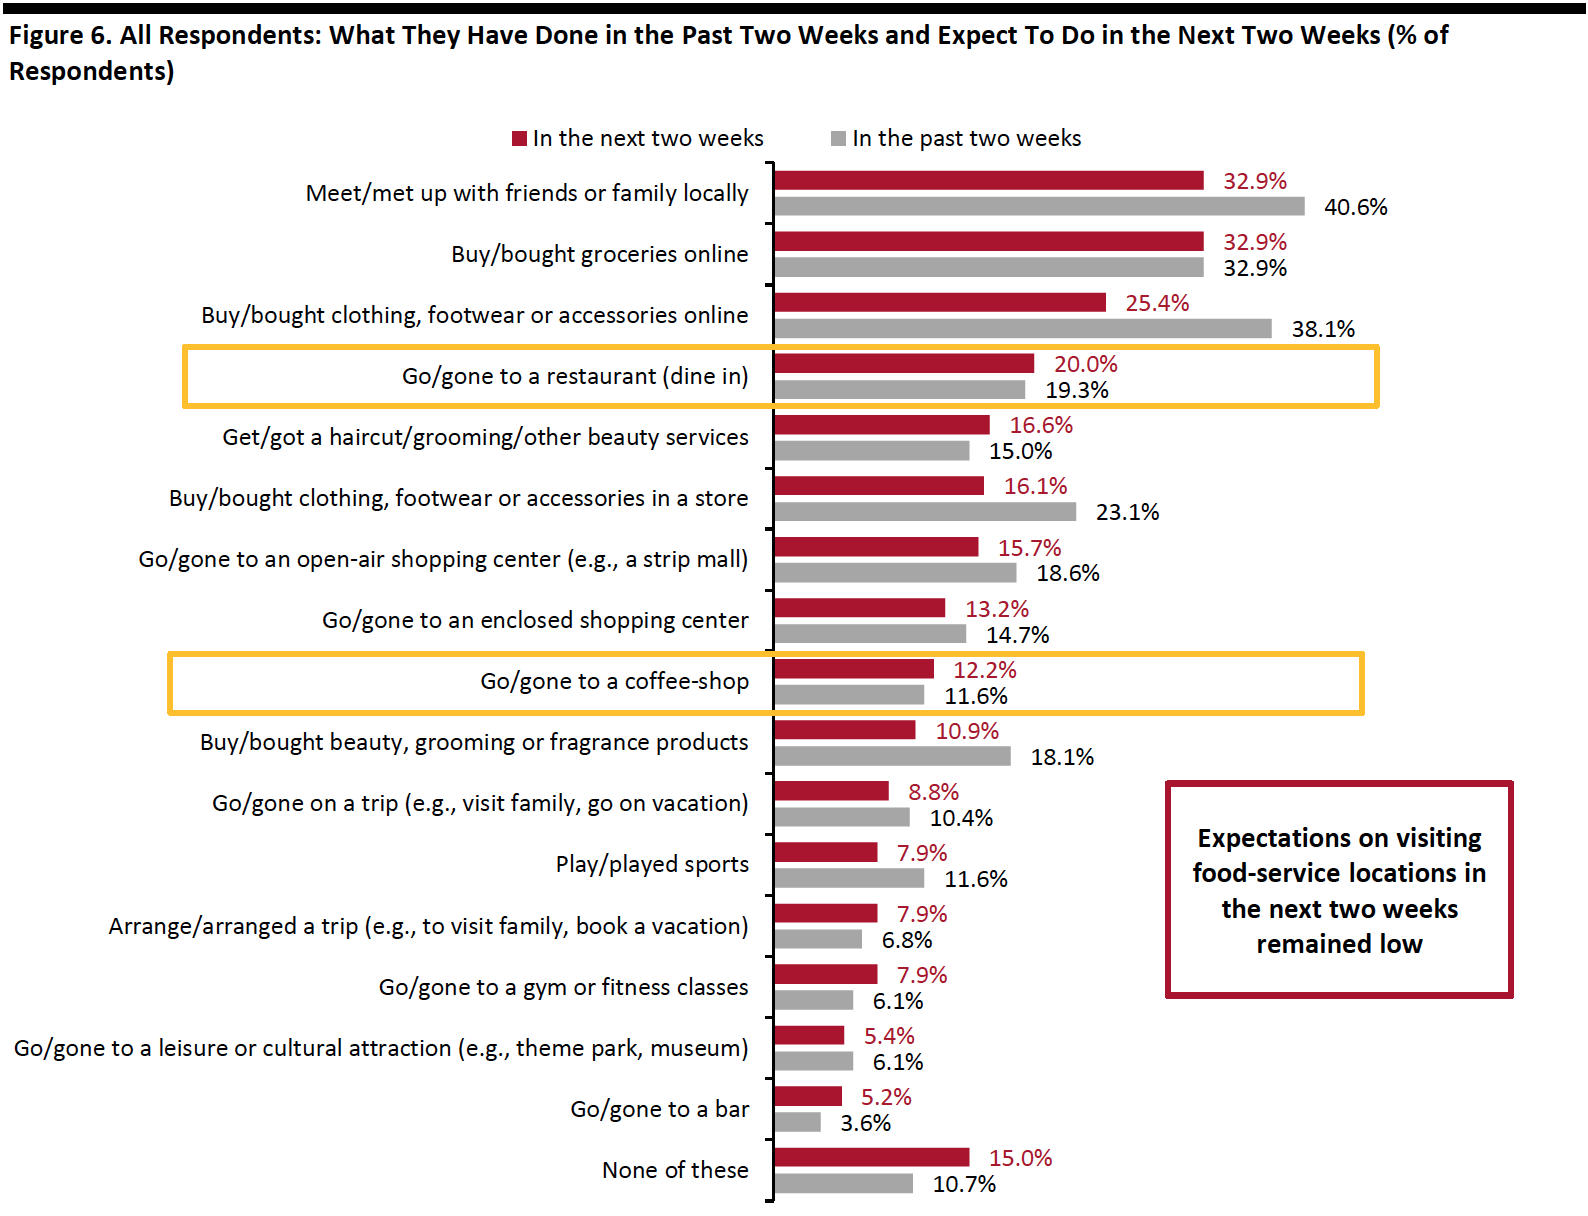
Each week, we also ask consumers what they expect to do in the next two weeks, with a set of options comparable to those for the last two weeks. In Figure 6, we compare these short-term expectations with recent actual behavior.
We saw slightly lower proportions of consumers expecting to do nine of the 16 options that we provided for activities in the next two weeks than actual behavior in the past two weeks.
For the next two weeks, expectations on visits to food-service locations remained low. Slightly more consumers expect to get a haircut or beauty service compared to the indications from recent actual behavior. This week, the survey outcomes showed:
- Online grocery shopping continued to be the top spending-related activity that consumers expect to do in the next two weeks, with an equal proportion (32.9%) of consumers planning to do so as recent actual behavior.
- The proportion of respondents that expect to buy clothing or footwear online came in at one-quarter, versus 24% last week. Some 16.1% of respondents plan to make purchases in this category in a store, slightly down from expectations of 18.9% last week (aligned with the post-Black Friday and Cyber Monday context). Based on past survey results, we expect to see higher proportions in actual behavior for both online and in-store apparel shopping than expected levels next week.
- Slightly more consumers reported that they expect to get a haircut, grooming or beauty service in the next two weeks than recent actual behavior suggests, despite an increase in avoidance of grooming service locations (as discussed later in this report).
- Expectations on visiting food-service locations broadly leveled with actual behavior in the past two weeks. The proportion that plan to dine in a restaurant is also the lowest expected level since we asked this survey question.
 Respondents could select multiple options
Base: US respondents aged 18+
Source: Coresight Research[/caption]
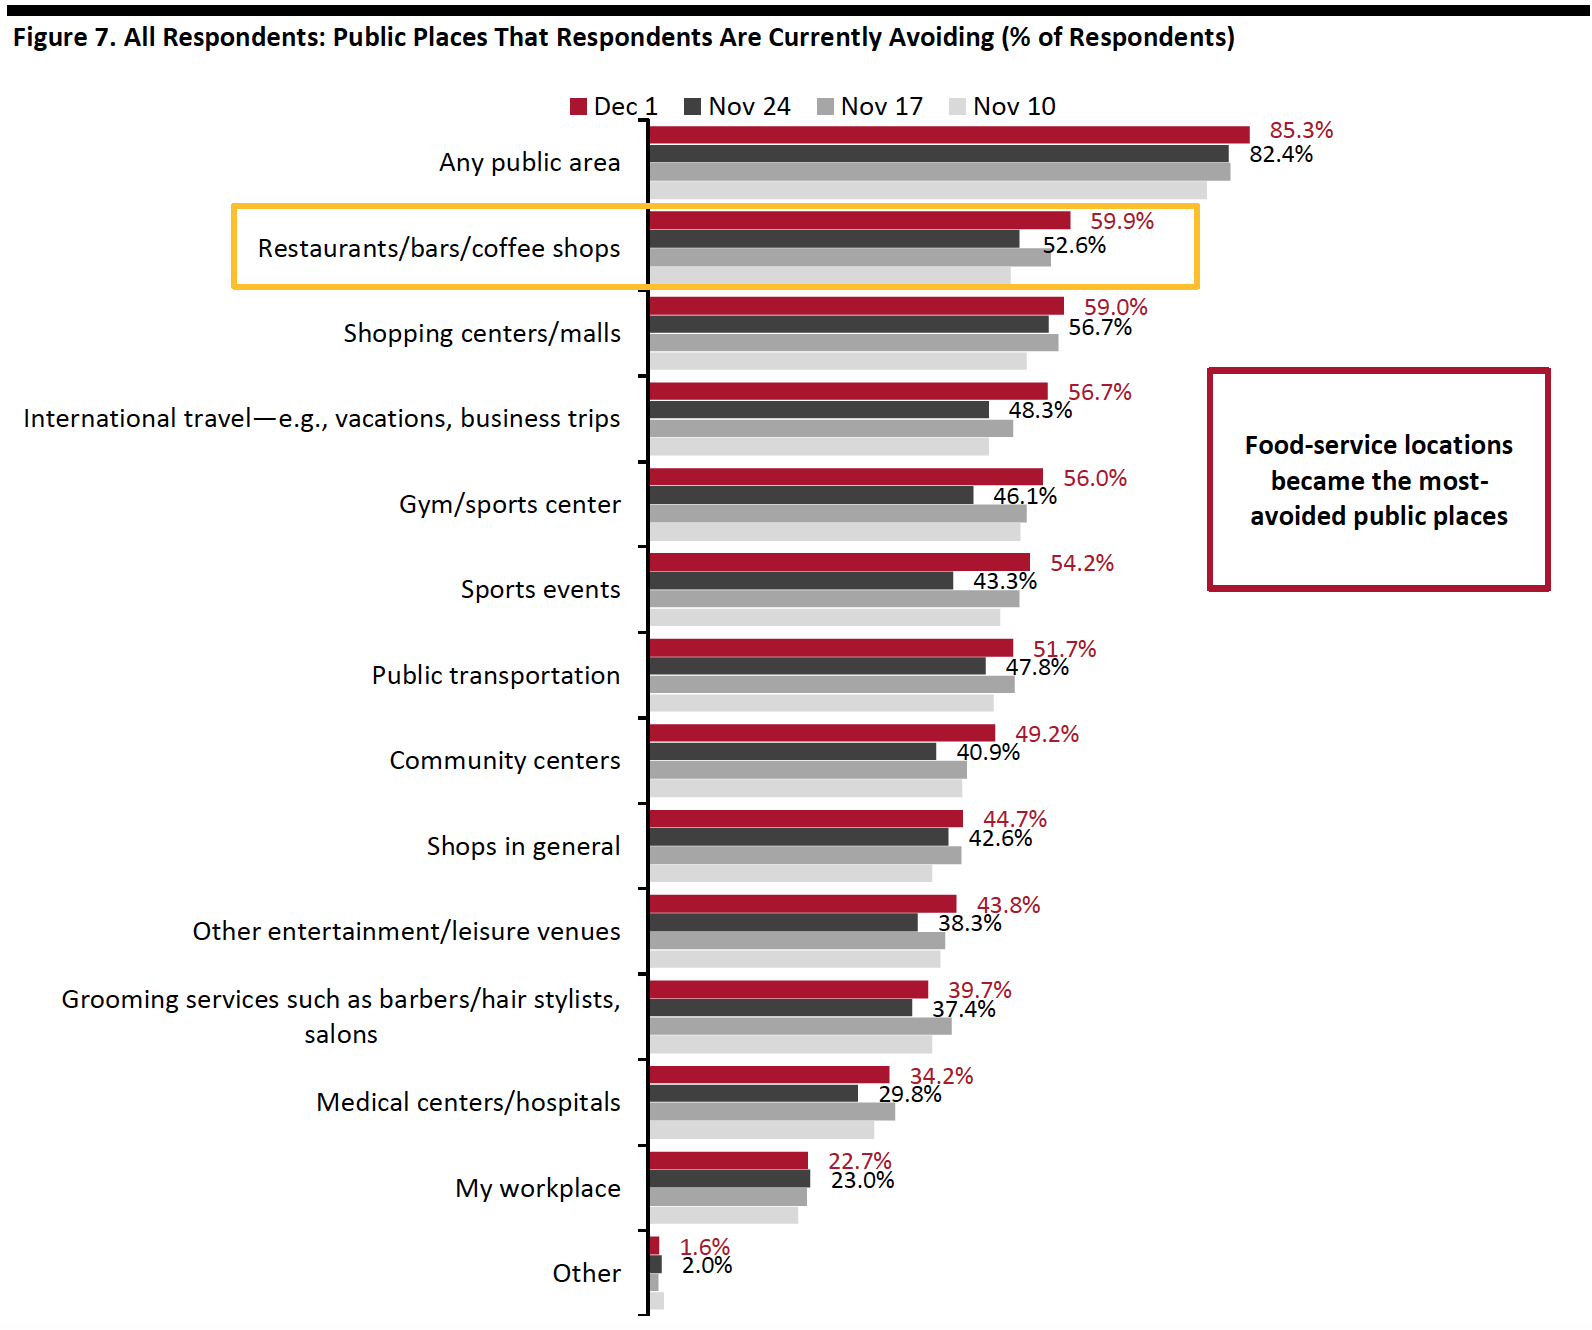
Over Eight in 10 Are Currently Avoiding Public Places
Providing further evidence of a truly digital-first Black Friday, this week, the avoidance rate of any type of public area spiked to a new high since September: Some 85.2% of respondents said that they are currently avoiding any public area, versus 82.4% last week. We saw week-over-week increases in avoidance for almost all of the 13 options provided, although some changes were within the margin of error.
Avoidance of retail locations and food-service locations hit new highs this week, as Covid-19 cases surged again recently:
- The proportion of respondents that are currently avoiding shopping centers/malls stood at 59.0%, compared to 56.7% last week. This week’s metric is the highest level we have seen since September.
- Aligned with our previous finding of a plunge in visits to restaurants and coffee shops, food-service locations saw a week-over-week increase of seven percentage points in the avoidance rate, from 52.6% last week to 59.9% this week. Food-service locations became the most-avoided type of public place among our respondents this week.
- Avoidance of shops in general has been fluctuating in the past few weeks. This week, the metric returned to the level we saw two weeks ago, at 44.7%, compared to 42.6% last week.
 Respondents could select multiple options
Base: US respondents aged 18+
Source: Coresight Research[/caption]
Reviewing Trend Data in Current Purchasing Behavior
What Consumers Are Currently Buying More Of and Less Of
This week, we saw a stable proportion of consumers currently buying more of any type of product versus the previous week with a figure of 65%. The proportion of respondents that are currently buying less of any products than pre-crisis fell slightly, from 53.5% last week to 51.7% this week.
- Buying more of any categories and buying less of any categories were not mutually exclusive options, so respondents could answer yes to both.
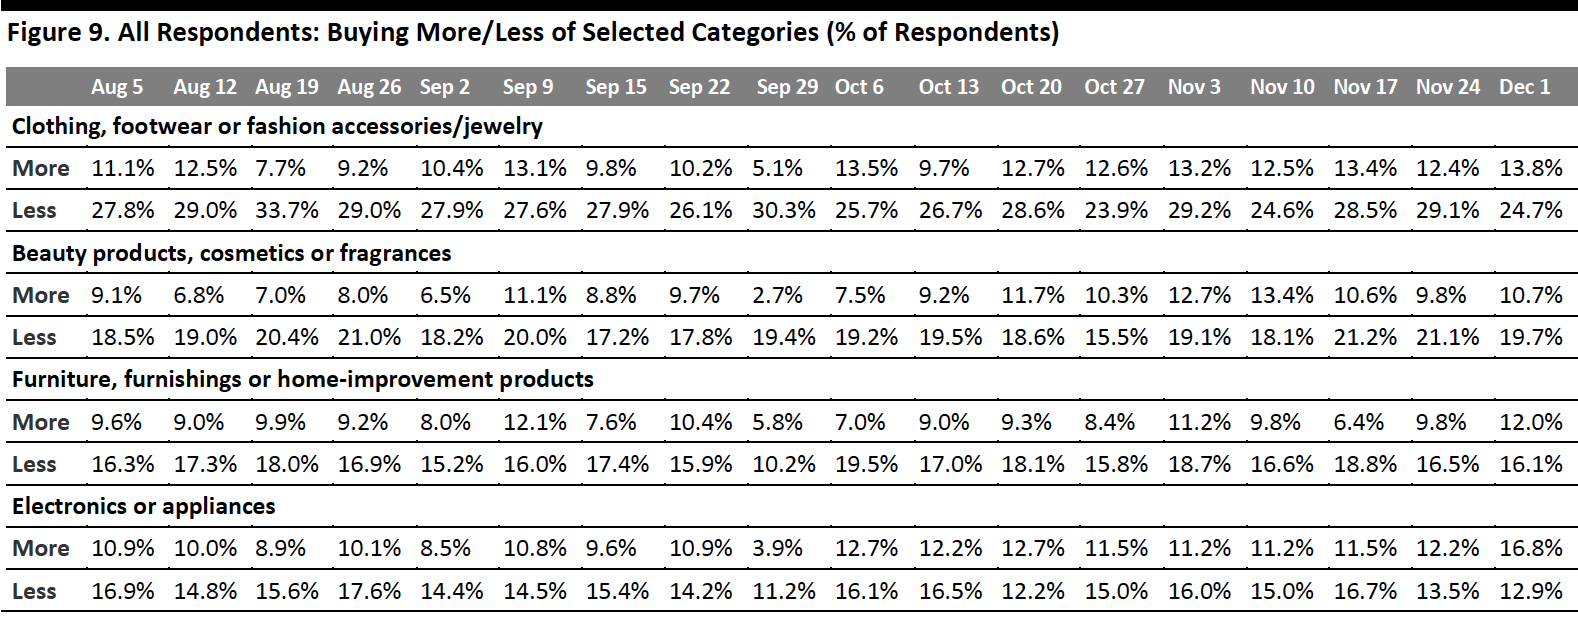
Buying more: Essentials—including health, household and personal care products—remained the most-purchased categories. Both personal care and health products saw a week-over-week upswing of almost eight percentage points.
Seasonal demand related to the extended shopping weekend was reflected in discretionary products, where electronics witnessed the biggest week-over-week increase of five percentage points—with 16.8% of consumers currently buying more in the category than before the crisis. This is the highest level we have recorded since the beginning of our surveys March.
Buying less: Further reflecting the strength of the apparel category over the big shopping weekend, clothing and footwear saw the largest week-over-week improvements in purchases, with lower proportions of consumers buying less than before the crisis compared to last week. The proportions of consumers that are currently buying less in the electronics and home products categories both remained relatively stable compared to last week.
Ratio of less to more: The ratios of the proportion of respondents buying less to the proportion buying more in all of the four discretionary categories tracked in Figure 9 slid week over week.
- The ratio for clothing and footwear dropped to its lowest level of 1.8 this week, compared to 2.4 last week and 2.1 two weeks ago.
- The ratio for electronics also declined to a record low: The proportion of consumers buying more electronics than pre-crisis exceeded those that are buying less. As a result, the ratio fell below 1 to 0.8 this week, from 1.1 last week. The uptick in purchases of apparel and electronics is consistent with our finding discussed earlier in the report that they were the most-purchased categories over the extended Thanksgiving weekend.
- The ratio for beauty came in at 1.9, versus 2.2 last week and 2.0 two weeks ago.
The ratio for the home category went down to 1.3, from 1.7 last week and 3.0 two weeks before.
[caption id="attachment_120375" align="aligncenter" width="700"]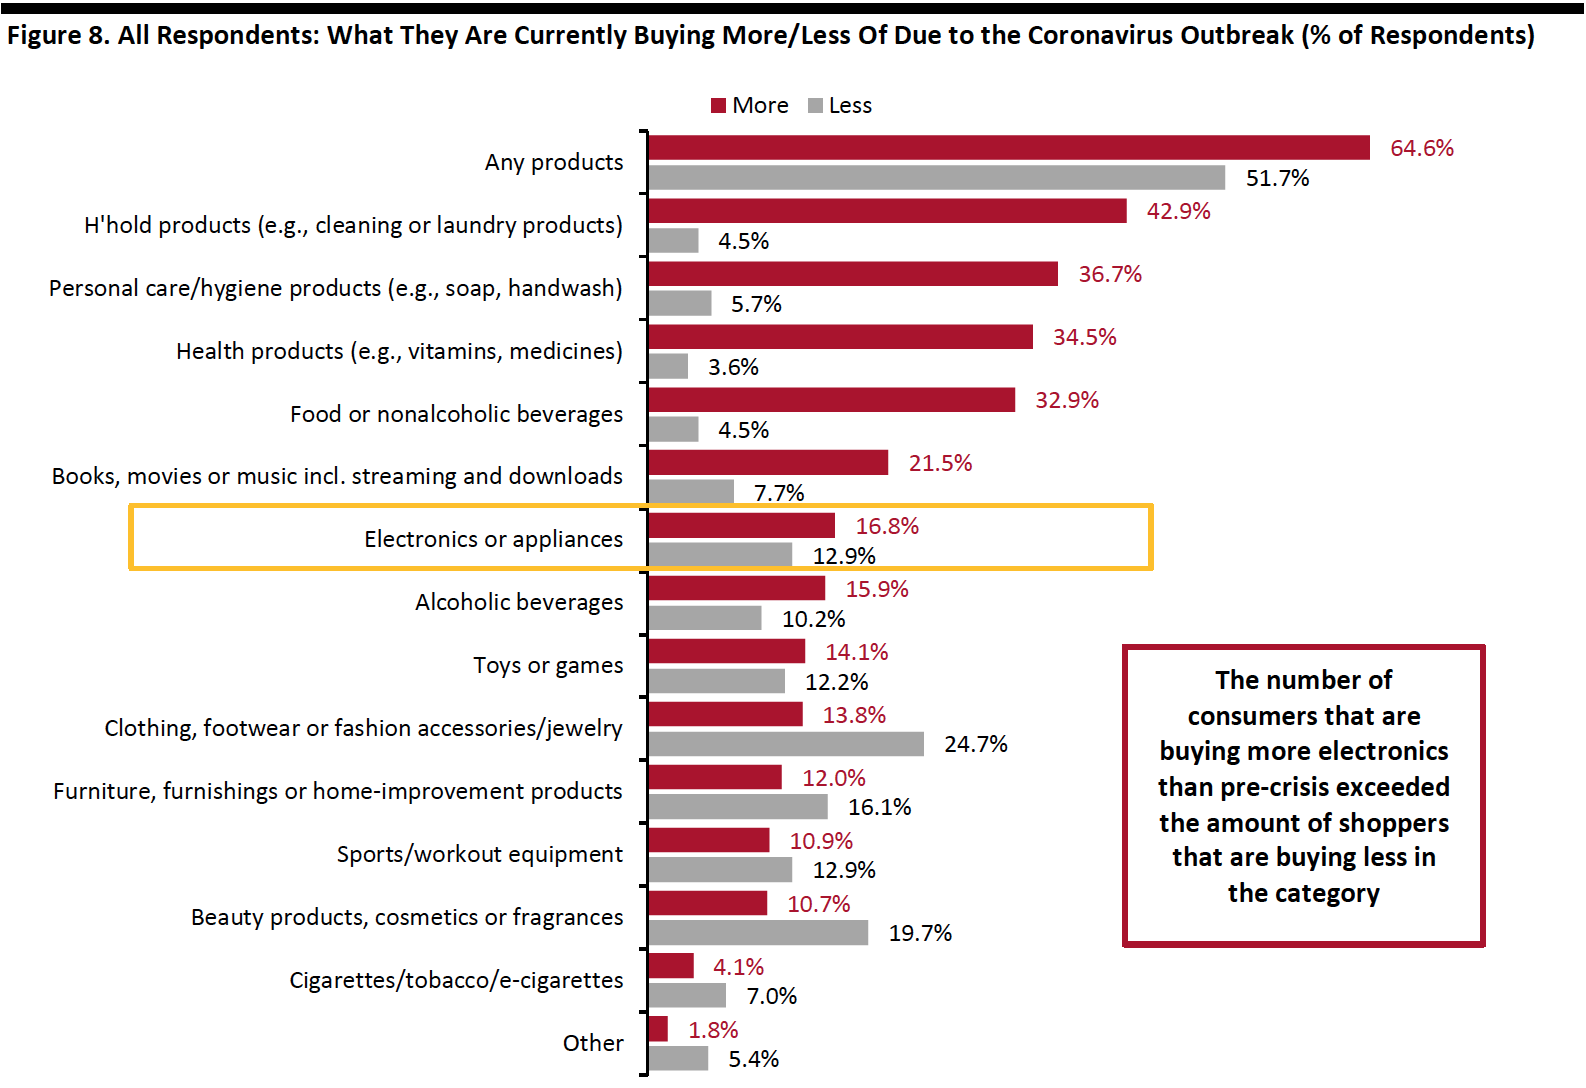 Respondents could select multiple options
Base: US respondents aged 18+
Source: Coresight Research[/caption] [caption id="attachment_120376" align="aligncenter" width="700"]
 Base: US respondents aged 18+
Source: Coresight Research[/caption]
Almost Three-Quarters Are Switching Spending Online
The proportion of consumers buying more online than they used to stood at 73.5%, compared to 71.3% last week. The high e-commerce level again confirms the strength of demand for shopping online over the extended Thanksgiving weekend. As we head toward the last few weeks of the holiday season, we expect this level to remain elevated.
[caption id="attachment_120377" align="aligncenter" width="700"]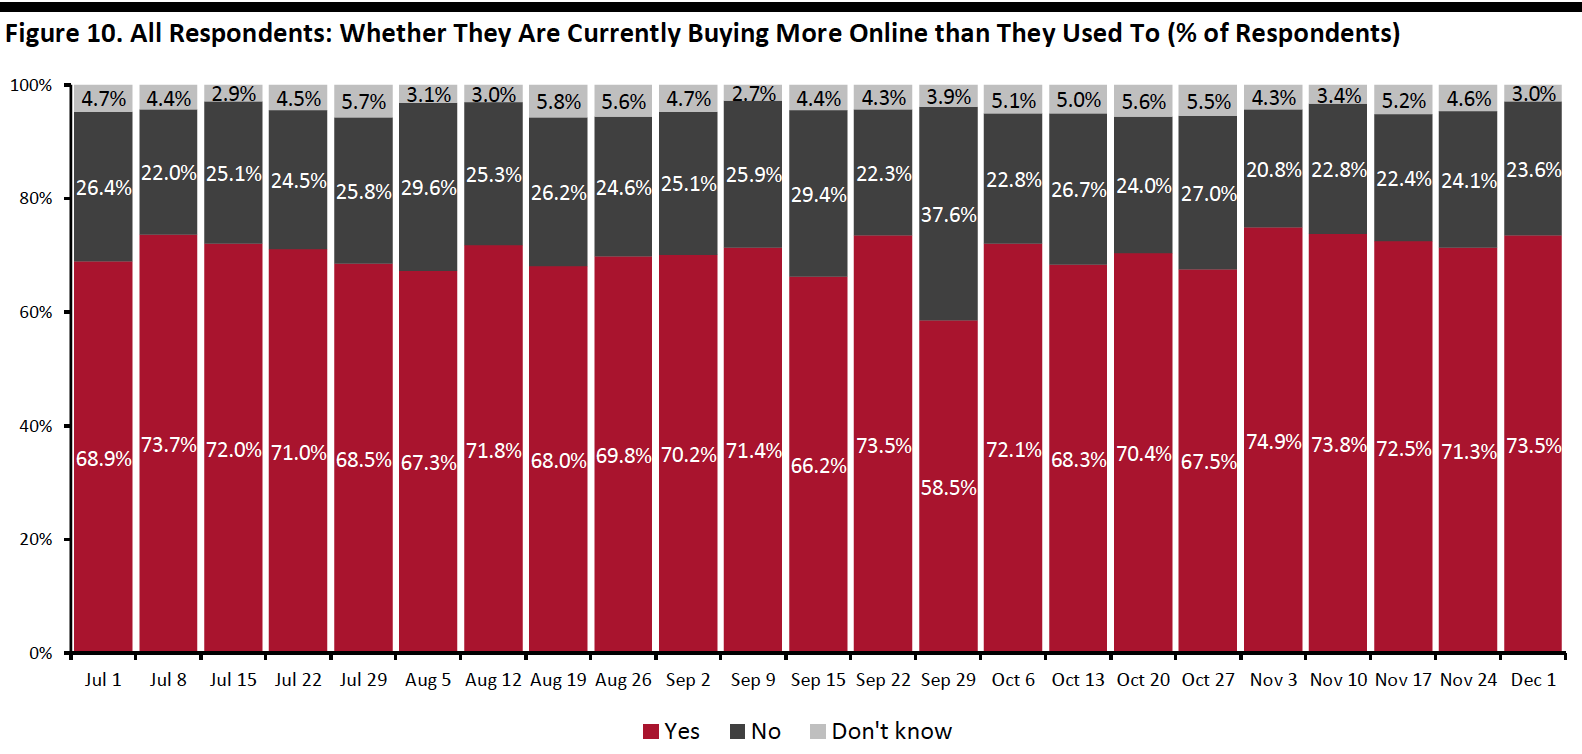 Base: US respondents aged 18+
Source: Coresight Research[/caption]
What Consumers Are Currently Buying More Of Online
Looking at specific categories, almost all of the 13 options we provided saw week-over-week increases in consumers buying more online than pre-crisis, although most of the changes were within the margin of error.
Both household products and personal care products returned to the level we saw two weeks ago, at around 35%. The proportion that are buying more food online than they used to increased to a record high of 28.8%, from 24.6% last week.
We found week-over-week growth in several discretionary categories, including apparel, electronics and home—all of which reached the highest levels we have seen since starting our survey in March. Some 31.5% are buying more clothing, footwear or accessories than pre-crisis, and 22.0% and 15.0% of respondents are buying more electronics and home products, respectively.
[caption id="attachment_120378" align="aligncenter" width="700"]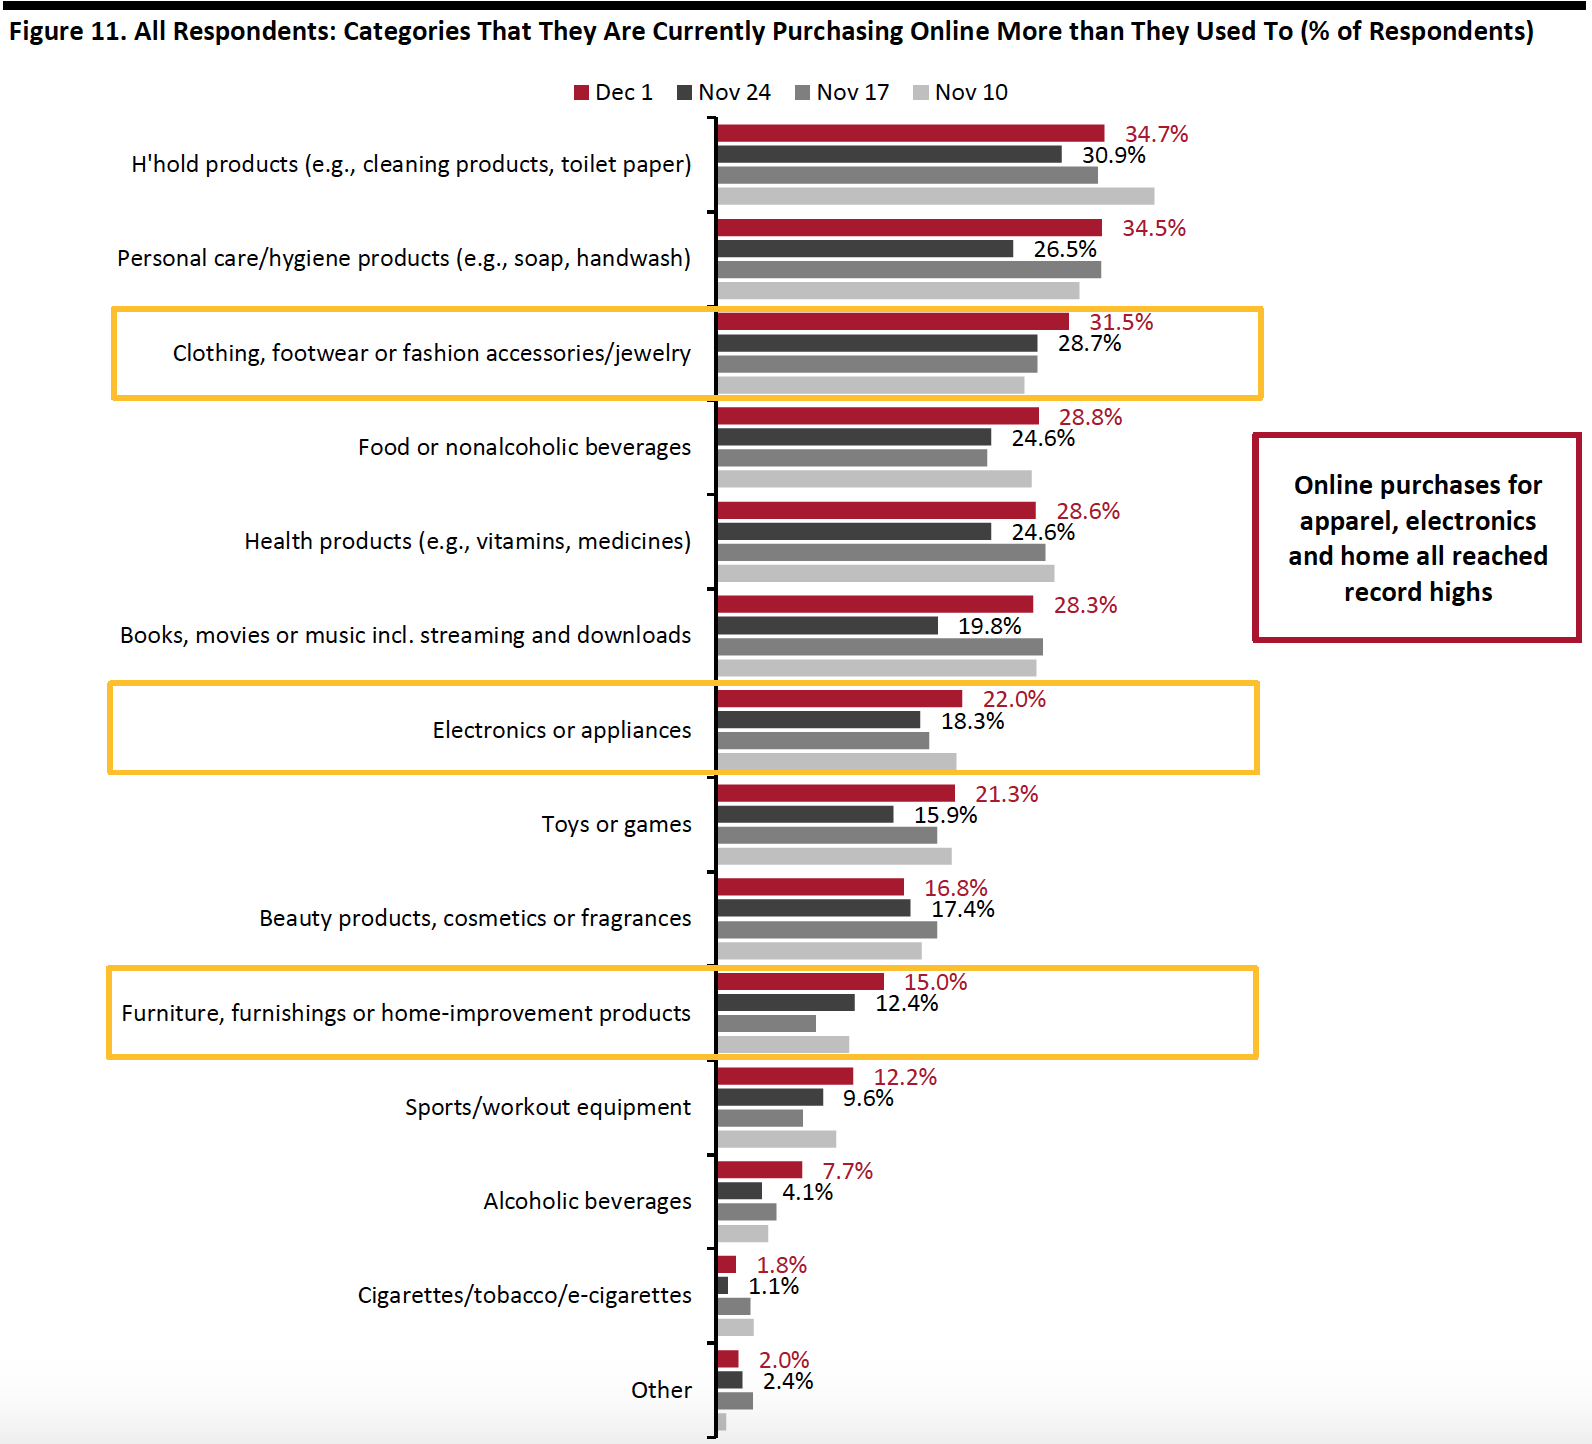 Respondents could select multiple options
Base: US respondents aged 18+
Source: Coresight Research[/caption]
What We Think
The extended Thanksgiving weekend, which runs from Thanksgiving to Cyber Monday, is typically the peak shopping time for the US holiday season. This year, holiday shopping kicked off in October and many retailers ran Black Friday deals for all or most of November. As a result, we found that around 23% of consumers did not shop at all during the extended weekend and 23.9% of Thanksgiving weekend shoppers had already shopped holiday-related deals prior to the weekend. Also, some consumers did not feel they got the best bargain on the Black Friday and Cyber Monday weekend: One-quarter of respondents said that they were disappointed with the discounts this year.
Our survey confirms the focus on digital channels in this year’s holiday season. Over the extended Thanksgiving weekend, 65% of consumers reported that they shopped online, versus 27% that shopped in-store. In addition, compared to last year, 45% said that they shopped more online this year. To some degree, our prior surveys have found that consumers expect to retain the behavior of shopping more online and less in stores post-crisis, so this trend is likely to carry over into 2021. Brands and retailers should continue to strengthen their e-commerce capabilities to fulfill consumer demands.
This week, we saw further evidence of holiday weekend-related demand in a number of our recurring weekly questions:
- Apparel: This week’s survey showed a strong improvement in apparel purchases. The ratio of buying less to more than pre-crisis in the apparel category fell to a historic low. This is aligned with our finding that apparel and footwear were the most-shopped product categories over the extended Thanksgiving weekend. The purchases were driven by online channels: Around 38% of respondents reported that they had bought apparel online and the proportion buying more clothing, footwear or accessories than pre-crisis also jumped to a new high of 32% this week. We may see demand slow a little in the upcoming weeks, although colder weather could drive purchases in outerwear and winter accessories.
- Electronics: The proportion of respondents that are buying more in electronics than pre-crisis exceeded those that are buying less, reflecting the popularity of electronics during the holiday season. Similarly to apparel, we saw online purchases of electronics reach the highest level since we began our surveys, at 22%. This trend may taper off in the next few weeks, as consumers buy big-ticket items less frequently.
- Online Grocery: Showing great resilience, it looks like this trend is here to stay. This week, we saw an uptick in online grocery shopping as consumers increasingly avoided food-service locations. This reflects the tradition of dining at home for the Thanksgiving weekend. The proportion of shoppers that had bought groceries online in the latest two-week period stood at one-third, and the proportion that of consumers buying more food online than they used to spiked to a new high of 29%. This supports our expectation of 60+% year-over-year growth in online food sales during the holiday period, which will propel full-year 2020 growth to around 75%. Our latest monthly US CPG Sales Tracker has recorded an upward trend in year-over-year growth rates of online food sales.
- E-Commerce: Over the past few weeks, we have seen a consistent proportion of over 70% of consumers buying more online than they used to in. This week, some 73.5% are buying more online and almost all product categories saw week-over-week increases in online purchases. As we head toward the last few weeks of the holiday season, the e-commerce level could remain elevated, as a greater proportion of consumers continue to avoid shopping centers, malls and shops in general. We expect total online sales to climb by around one-third in the holiday season. Our US holiday retail traffic report provides analysis of traffic trends during holiday 2020 and the implications for e-commerce. Read our US E-Commerce: Post-Crisis Outlook report for more e-commerce data and analysis.
Methodology
We surveyed respondents online on December 1 (441 respondents), November 24 (460 respondents), November 17 (425 respondents), November 10 (447 respondents), November 3 (418 respondents), October 27 (419 respondents), October 20 (409 respondents), October 13 (401 respondents), October 6 (416 respondents), September 29 (412 respondents), September 22 (422 respondents), September 15 (408 respondents), September 9 (406 respondents), September 2 (402 respondents), August 26 (414 respondents), August 19 (416 respondents), August 12 (400 respondents), August 5 (449 respondents), July 29 (403 respondents), July 22 (404 respondents), July 15 (454 respondents), July 8 (410 respondents), July 1 (444 respondents), June 24 (411 respondents), June 17 (432 respondents), June 10 (423 respondents), June 3 (464 respondents), May 27 (422 respondents), May 20 (439 respondents), May 13 (431 respondents), May 6 (446 respondents), April 29 (479 respondents), April 22 (418 respondents), April 15 (410 respondents), April 8 (450 respondents), April 1 (477 respondents), March 25 (495 respondents) and March 17–18 (1,152 respondents). The most recent results have a margin of error of +/- 5%, with a 95% confidence interval. Not all charted week-over-week differences may be statistically significant.