albert Chan
What’s the Story?
This report presents the results of Coresight Research’s latest weekly survey of US consumers, including on the impacts of the coronavirus outbreak, undertaken on November 17, 2020. We explore the trends we are seeing from week to week, following prior surveys on November 10, November 3, October 27, October 20, October 13, October 6, September 29, September 22, September 15, September 9, September 2, August 26, August 19, August 12, August 5, July 29, July 22, July 15, July 8, July 1, June 24, June 17, June 10, June 3, May 27, May 20, May 13, May 6, April 29, April 22, April 15, April 8, April 1, March 25 and March 17–18.
Consumer Attitudes Toward Product Returns
As consumers continue to shop online amid the pandemic, this week, we asked about their behavior and attitudes toward product returns. We asked respondents:
- Whether they had returned any unwanted purchases in the past 12 months.
- For those who had made any returns in the past 12 months, what product categories they returned and whether they agreed with any of four behavioral statements on product returns.
- Whether they agreed with any of eight attitudinal statements on this year’s holiday-season returns.
Clothing Is the Most Common Product Category To Return
A surprisingly low four in 10 respondents said they have returned an unwanted product purchase in the past 12 months. Among those, clothing was the number-one product category that consumers returned, with over half having returned apparel in the past 12 months. This was followed by electronics (21.9%) and was well ahead of footwear (15.4%).
[caption id="attachment_119713" align="aligncenter" width="700"] Base: 169 US respondents aged 18+ who had returned any unwanted purchases in the past 12 months
Source: Coresight Research[/caption]
Consumer Preferences for Product Returns amid The Pandemic
When it comes to returning online orders, we saw more shoppers favor shipping them back than visiting physical stores. Some 42.6% of those that had returned products in the past 12 months said they prefer to return online orders by mail. This compared to one-quarter that prefer to return in-store.
When we asked all respondents about their post-holiday returns this year, some 26.4% expect to return unwanted online purchases by mail, well ahead of the 17.9% that plan to do so in-store.
This could spell bad news for brands and retailers, as returns incur additional costs, including logistics and extra labor. The problem could be worse in the wake of pandemic this year, with consumers more likely to purchase products online for the holiday season.
[caption id="attachment_119714" align="aligncenter" width="700"]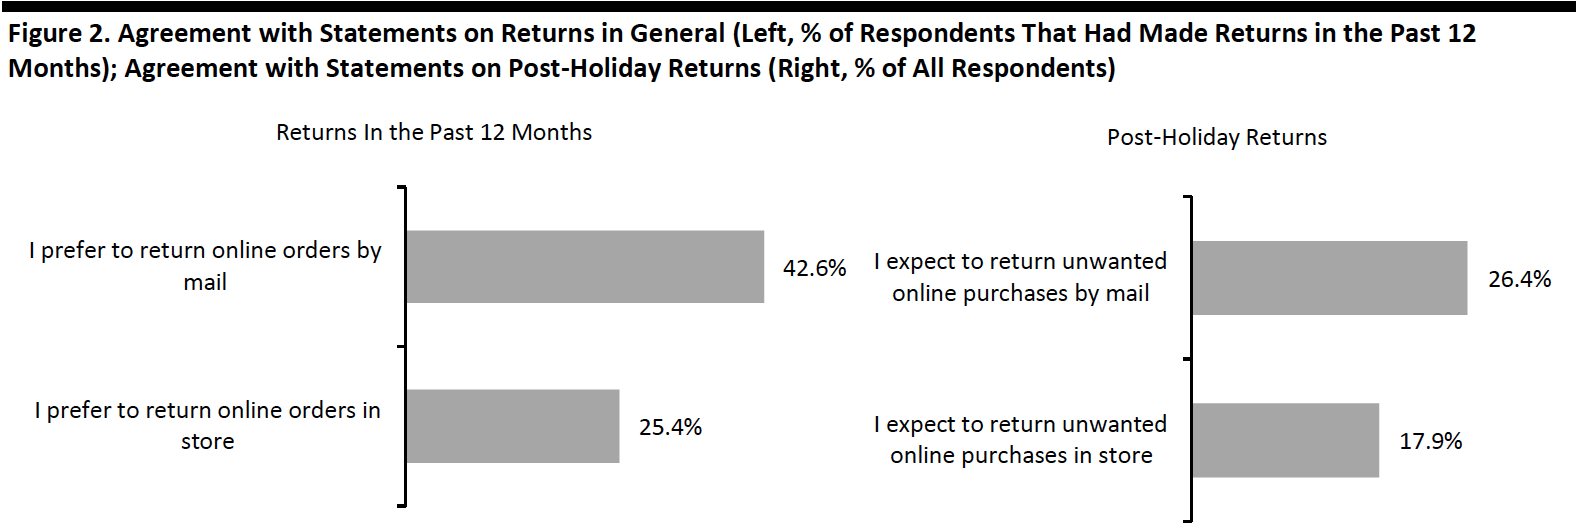 Base: 169 US respondents aged 18+ who had returned any unwanted purchases in the past 12 months (left) and 425 US respondents aged 18+ (right)
Source: Coresight Research[/caption]
Almost four in 10 respondents that had returned products in the past 12 months stated that retailers’ returns policies influence where they shop. For brands and retailers, a flexible returns policy could potentially attract consumers and boost sales. For this year’s holiday season, some 41.7% of all respondents think that retailers should offer a longer returns window, due to the pandemic. However, an extended returns window could mean that consumers return items after a season ends, making it difficult for brands and retailers to resell some seasonal products.
Some 37.2% of all respondents would like to have the option to return products through contactless drop-off points post holiday, and 26.4% would like the option to return in-store purchases through the mail. In the wake of Covid-19, retailers should innovate to provide consumers with more convenient and safer ways of returning purchases, just as they have rolled out services such as curbside pickup for purchase collection. For example, third-party returns platforms work with brands to offer contact-free returns: Happy Returns allows shoppers to simply use a QR code to drop off products at over 2,500 Return Bars.
Product returns often peak during or post holiday season, but we could see fewer returns overall this year due to Covid-19. Some 21.7% of all respondents expect to return fewer items this holiday season than last year, versus only 6.6% who plan to return more compared to last year.
[caption id="attachment_119715" align="aligncenter" width="700"]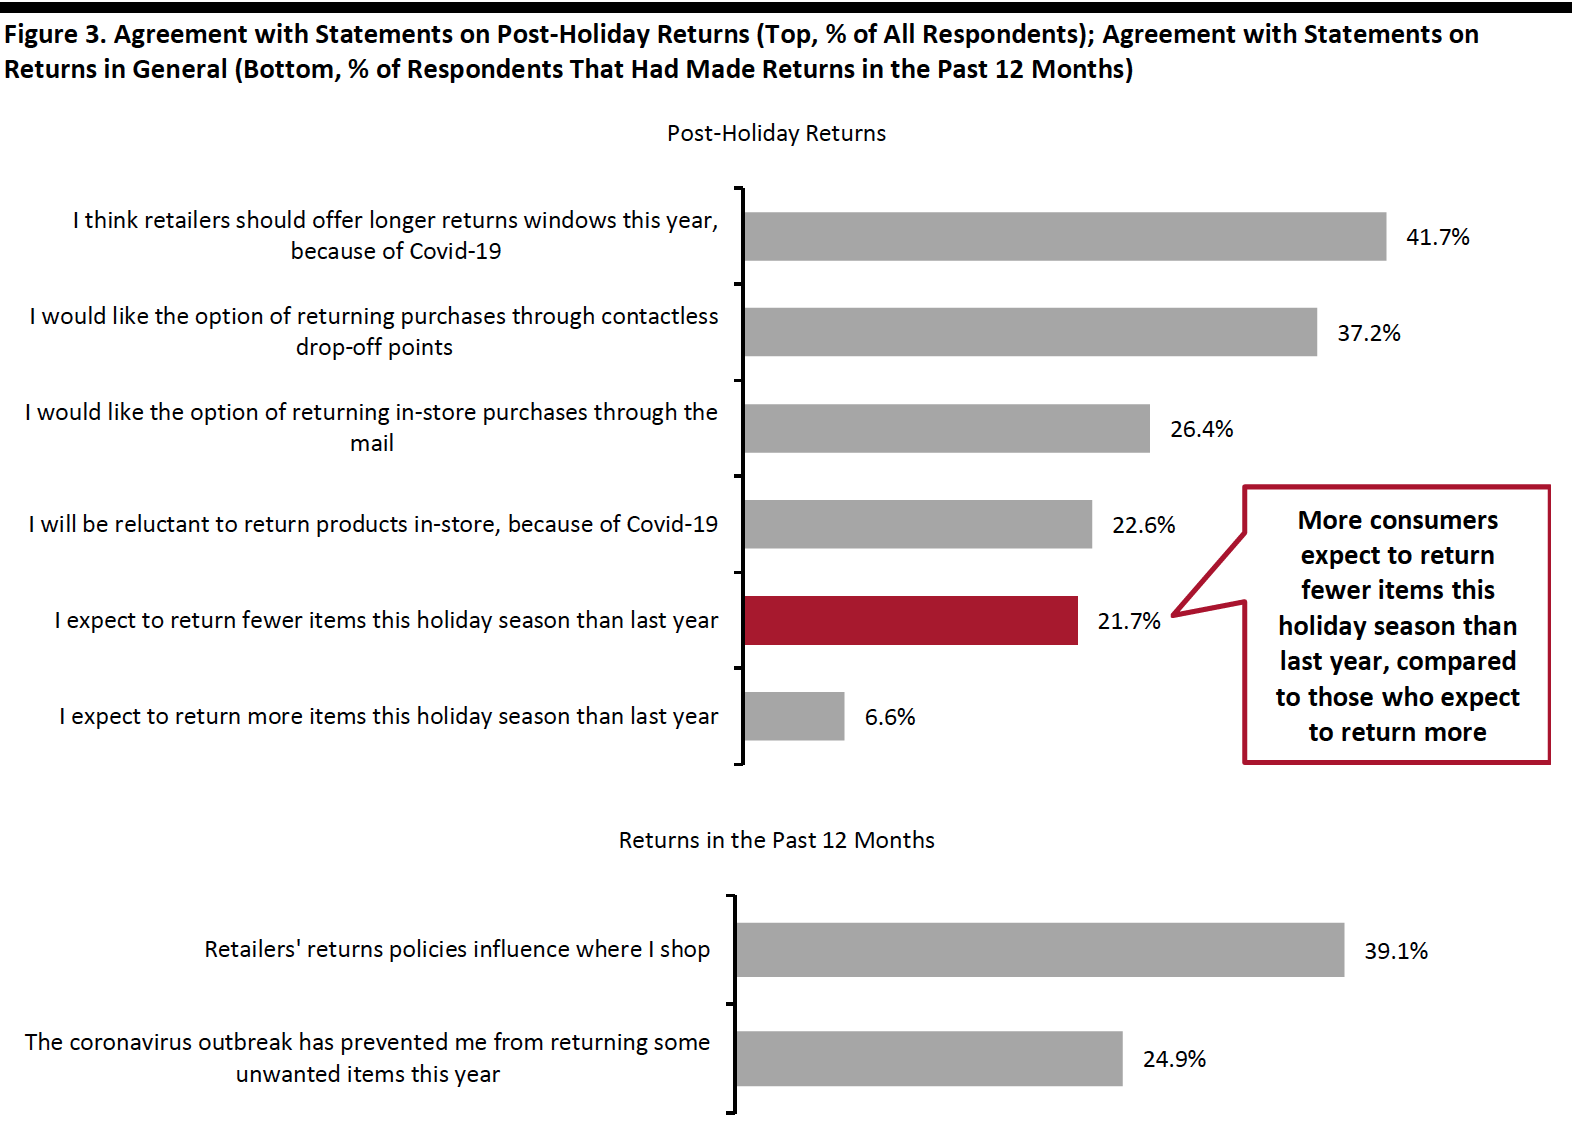 Base: 425 US respondents aged 18+ (top) and 169 US respondents aged 18+ who had returned any unwanted purchases in the past 12 months (bottom)
Source: Coresight Research[/caption]
What Shoppers Are Doing and Where They Are Going
More Consumers Had Bought Apparel Online in the Past Two Weeks
Each week, we ask consumers what they have done in the past two weeks. This week, the proportions of respondents slightly increased for four of the 16 options we provided for recent activities. Most of the week-over-week changes were within the margin of error; however, the directional trends, including over a number of weeks, can prove informative.
As we move further into the holiday shopping season, consumers are shopping more online but appear to be visiting shopping centers less:
- We saw a shift of apparel purchases from in-store to online this week. The proportion of respondents that had bought clothing, footwear or accessories online in the past two weeks jumped seven percentage points from 28.6% last week to 35.8% this week—the highest in two months. The proportion that bought apparel in-store fell below 20% for the first time since late August, to 19.1% this week. The uptick in online apparel purchases is aligned with our holiday survey results that showed clothing and footwear as the top category for gifting.
- The proportion of consumers that had bought groceries online also increased by almost six percentage points to a new high in two months, at 34.6% from 29.1% last week. On the contrary, the proportion of respondents that had dined in a restaurant fell slightly to 27.3% this week.
- The proportions of consumers that had visited an open-air shopping center and an enclosed shopping center both dropped this week. Some 16.9% had visited an open-air shopping center, and only 14.6% had gone to an enclosed center. These metrics remained low as avoidance in shopping centers/malls increased this week and such locations continued to be the most-avoided public places, which we discuss later in this report.
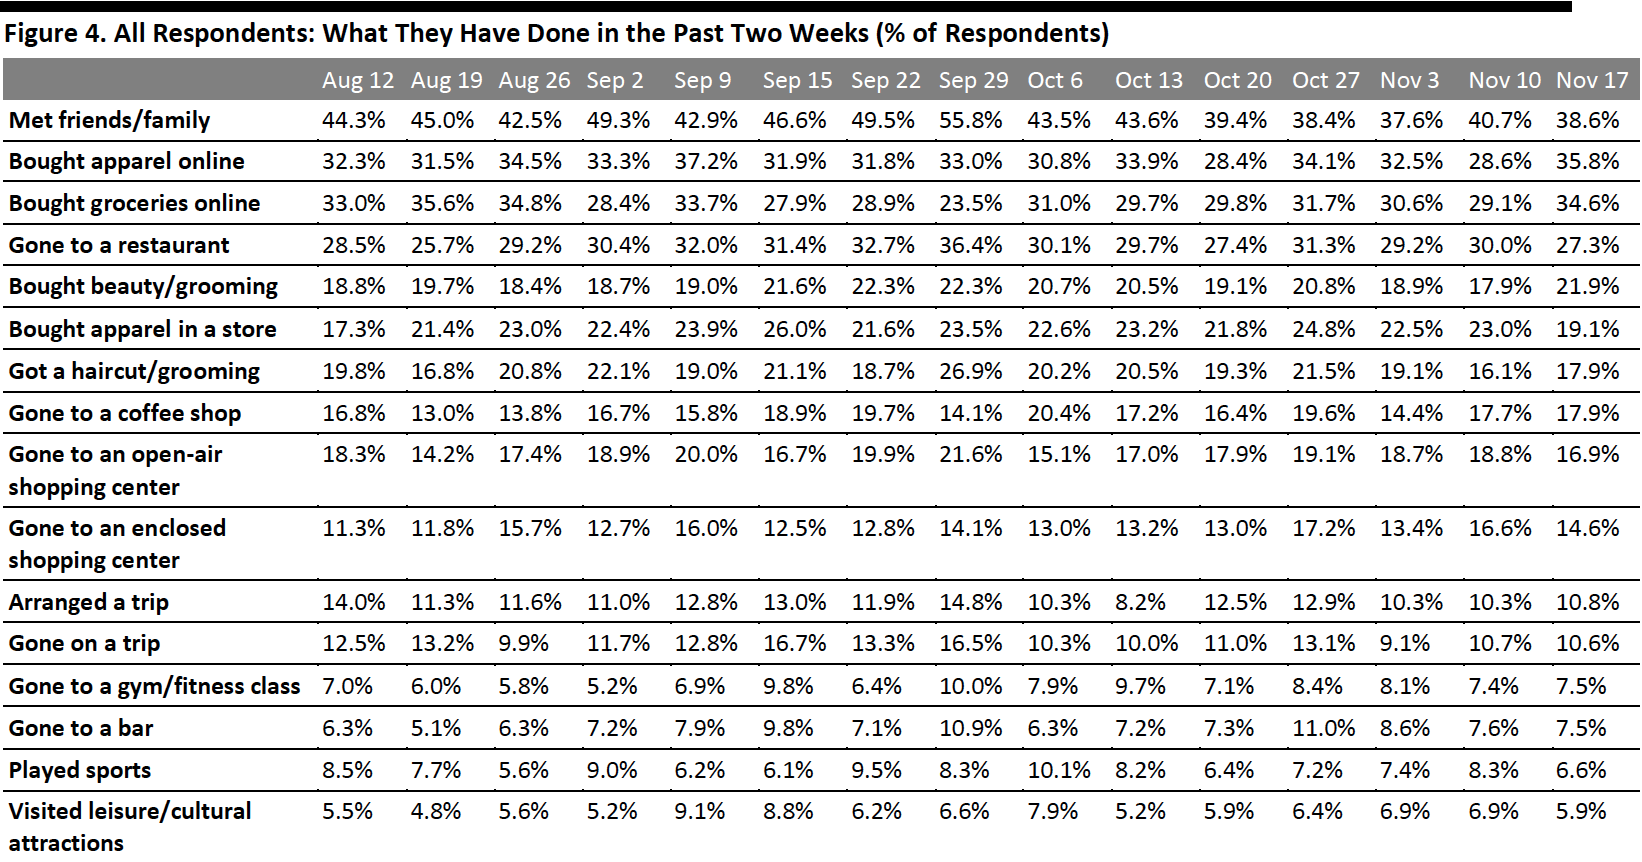 Respondents could select multiple options
Base: US respondents aged 18+
Source: Coresight Research[/caption]
Online Grocery Shopping Remains the Top Expected Spending Activity
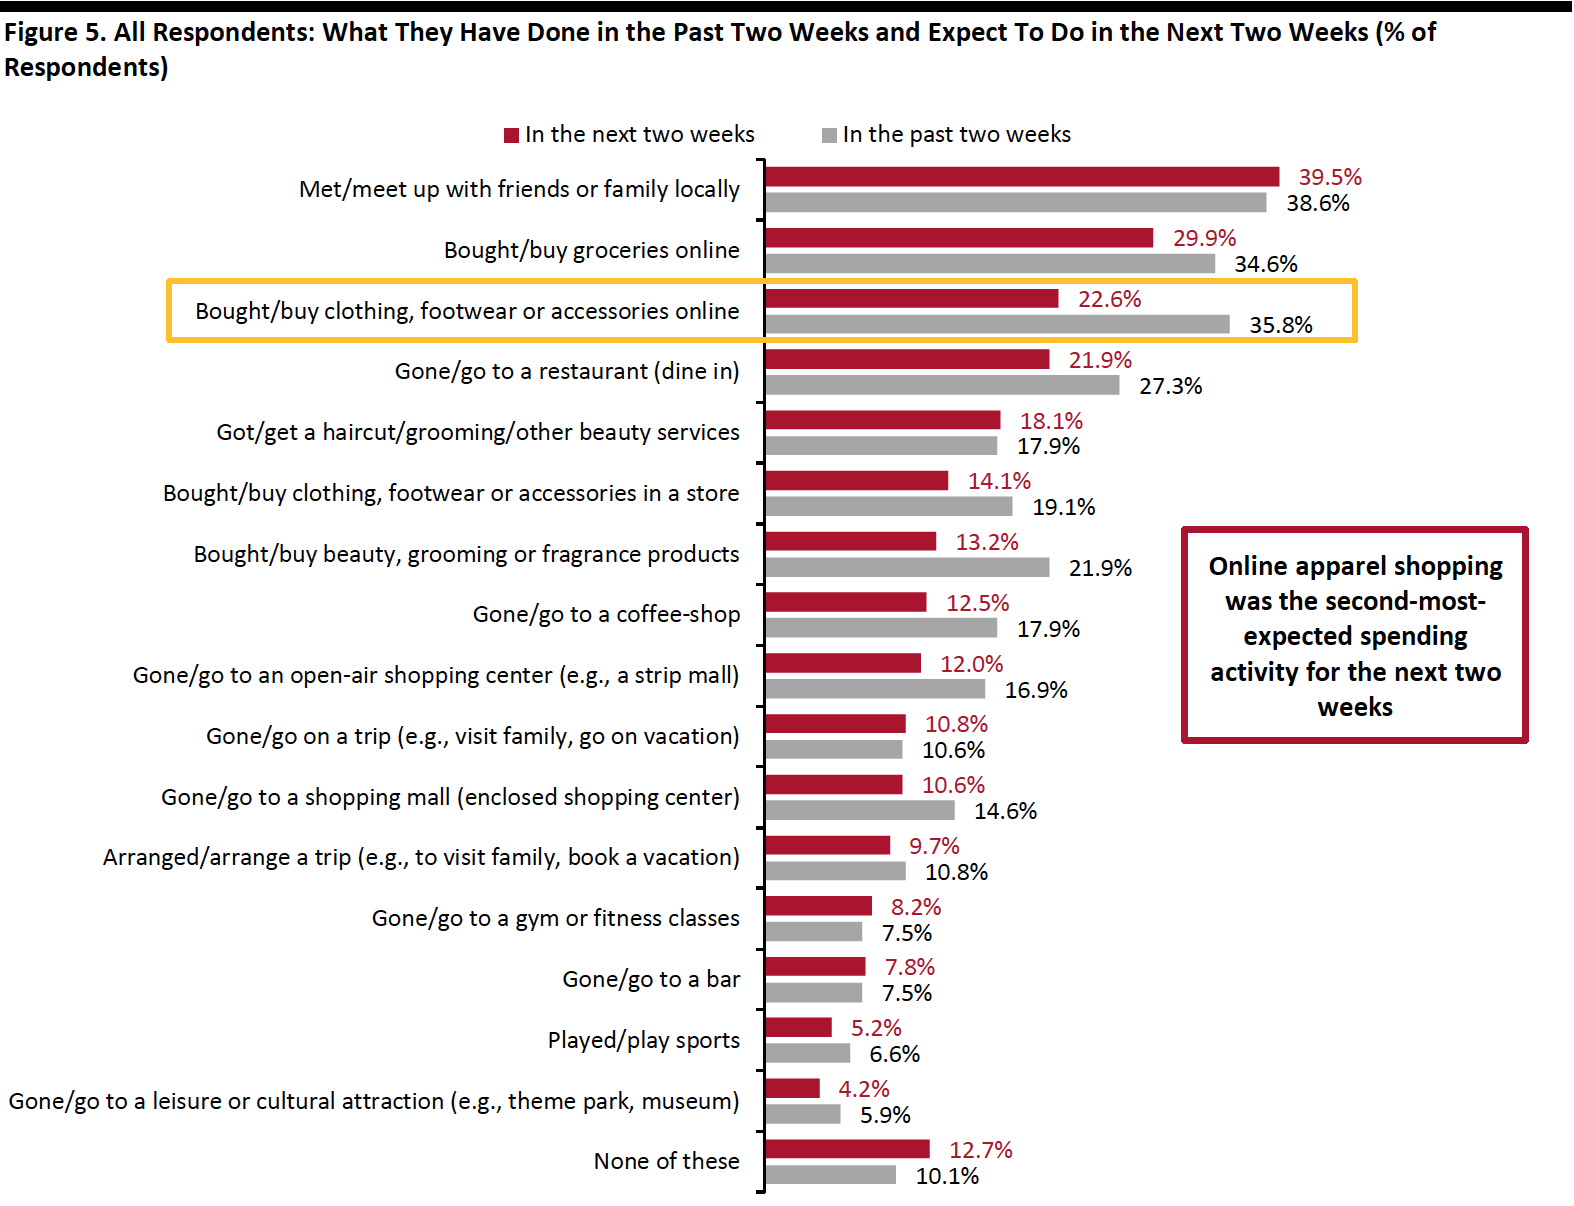
Each week, we also ask consumers what they expect to do in the next two weeks, with a set of options comparable to those for the last two weeks. In Figure 5, we compare these short-term expectations with recent actual behavior.
We saw slightly lower proportions of consumers expecting to do 11 of the 16 options we provided for activities in the next two weeks than actual behavior in the past two weeks.
For the next two weeks, consumers still expect to shop more online, while go to food-service locations less:
- Online grocery shopping once again took the top spot of expected spending-related activity for consumers to do in the next two weeks, with slightly fewer consumers planning to do so (29.9%) compared to the 34.6% of actual behavior in the past two weeks.
- Fewer consumers expect to dine in a restaurant and go to a coffee shop in the next two weeks than recent actual behavior. Expectation to dine in a restaurant also dropped from 23.3% last week to 21.9% this week, making it the third most-expected spending activity.
- The proportion of respondents that expect to buy clothing or footwear online came in at 22.6%, versus 21.3% last week. Some 14.1% plan to buy this category in a store, down from 17.2% last week. This reflects the continued shift from in-store to online compared to last week’s findings. Based on past survey results, we expect to see higher proportions in actual behavior of apparel shopping than expected levels next week.
 Respondents could select multiple options
Base: US respondents aged 18+
Source: Coresight Research[/caption]
Over Eight in 10 Are Currently Avoiding Public Places
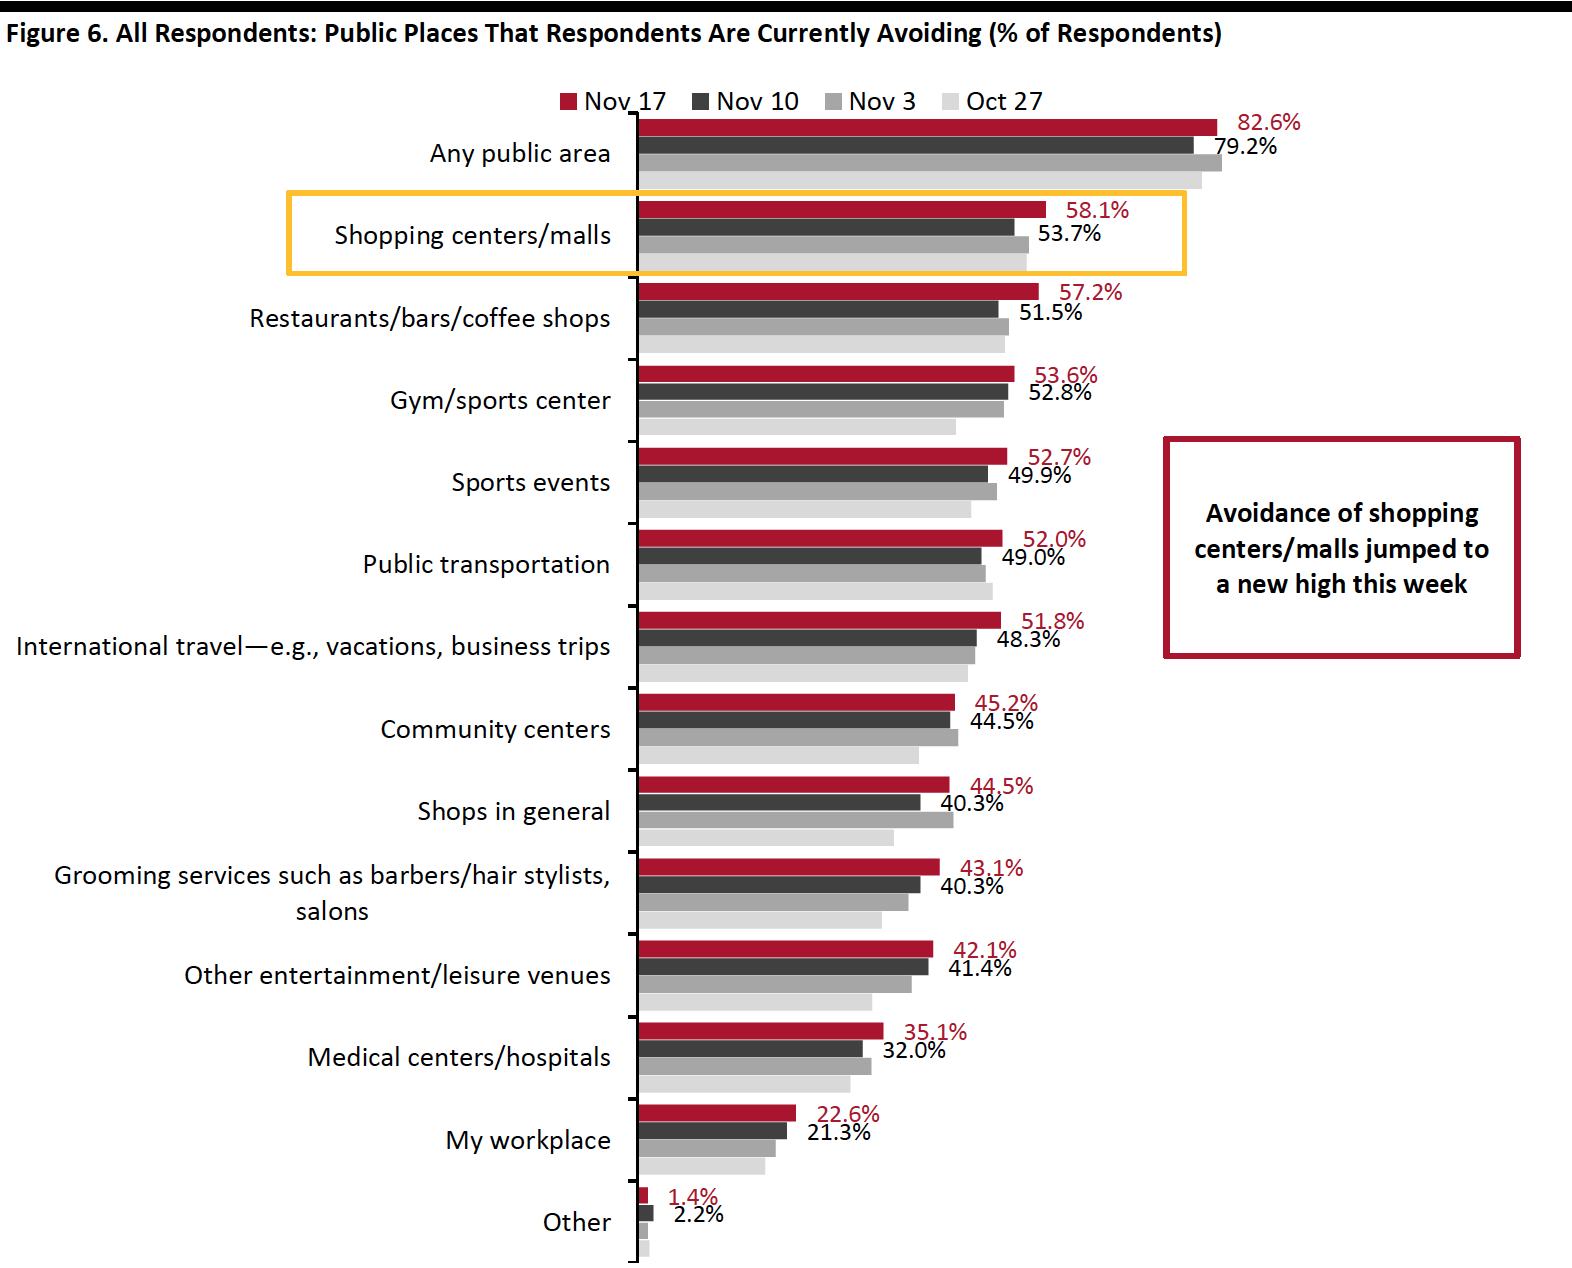
This week, the avoidance rate of any type of public area returned to the elevated level we saw two weeks ago: Some 82.6% said that they are currently avoiding any public area, versus 79.2% last week. As Covid-19 cases continue to rise, the avoidance rate could remain high for the next week, including on Thanksgiving and Black Friday.
We saw increases in the avoidance rate for nine of the 13 options provided, although most changes were within the margin of error.
Avoidance in retail locations and food-service locations both went up this week:
- The proportion of respondents that are currently avoiding shopping centers/malls jumped to a new high in months, from 53.7% last week to 58.1% this week. Shopping centers/mall also remained the most-avoided public place.
- Aligned with our earlier finding of a decline in the proportion of respondents that had dined in a restaurant, we saw the avoidance rate of food-service locations surge by almost six percentage points to 57.2%, from 51.5% last week.
- Avoidance of shops in general bounced back to the level we saw two weeks ago: Some 44.5% are currently avoiding such places, compared to 40.3% last week.
 Respondents could select multiple options
Base: US respondents aged 18+
Source: Coresight Research[/caption]
Reviewing Trend Data in Current Purchasing Behavior
What Consumers Are Currently Buying More Of and Less Of
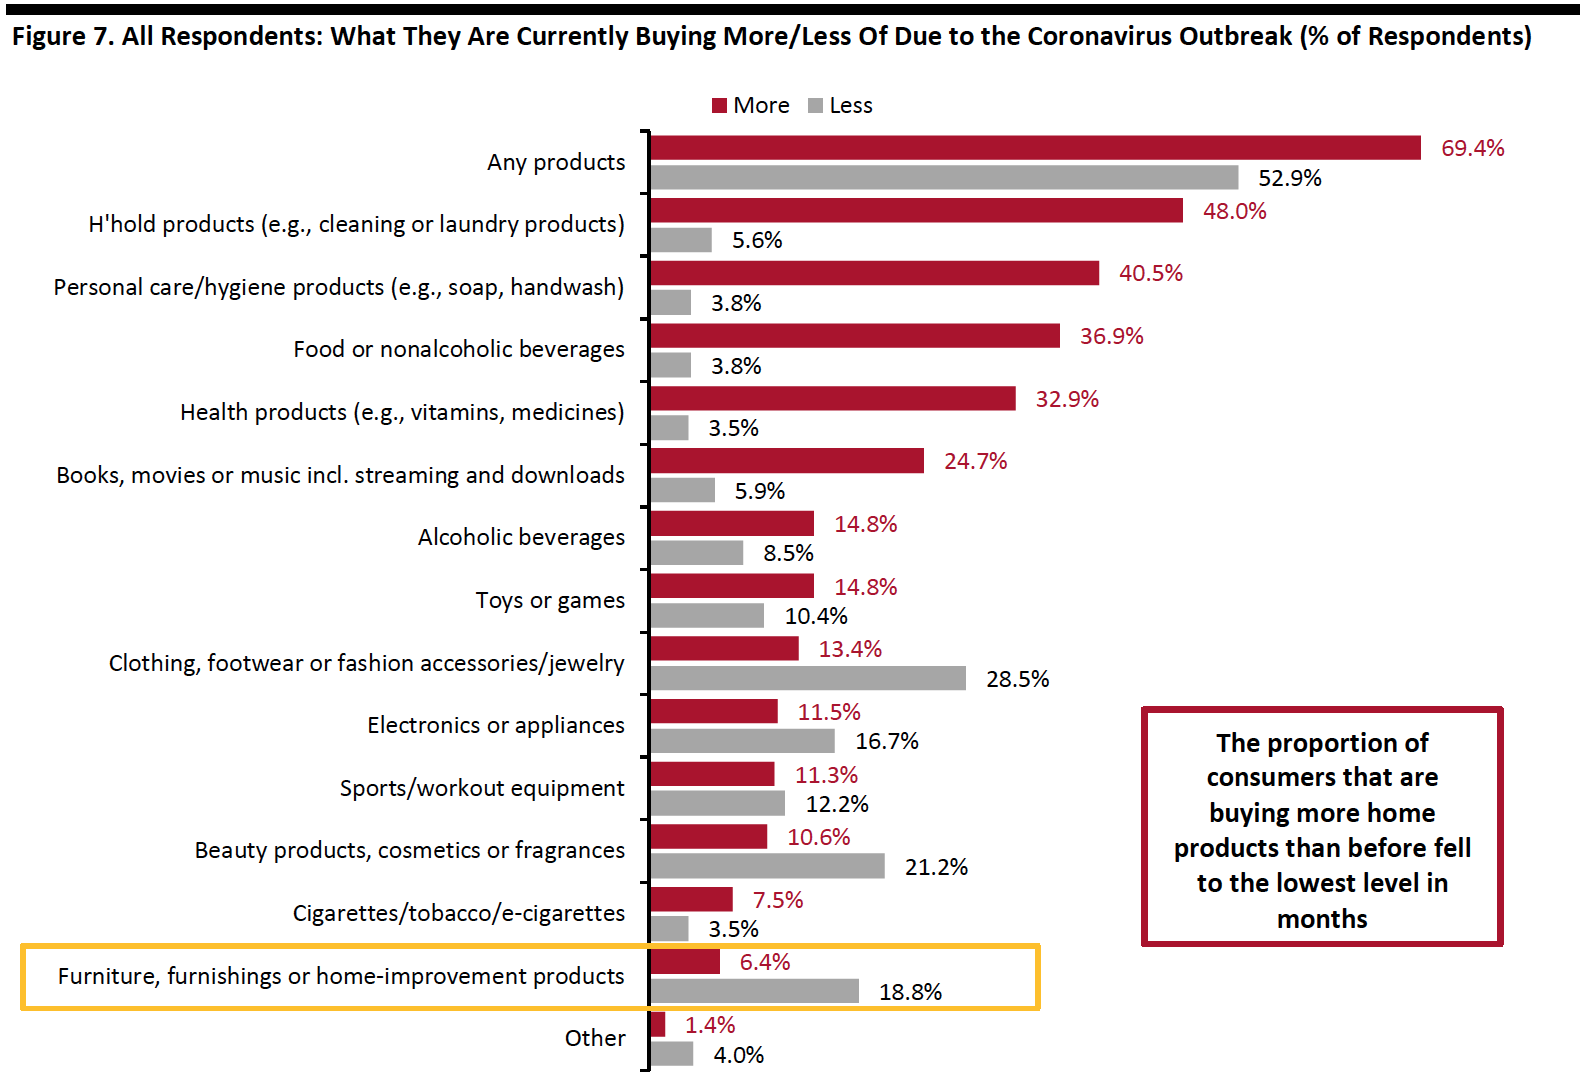
We have seen fluctuation in the proportion of respondents that are currently buying more of any products due to the coronavirus crisis in recent weeks. This week, some 69.4% are currently buying more, up nine percentage points from 60.2% last week and roughly the same level as two weeks ago. The proportion of respondents that are currently buying less than pre-crisis also increased slightly from last week, to 52.9%.
- Buying more of certain categories and buying less of certain categories were not mutually exclusive options, so respondents could answer yes to both.
Buying more: Essentials—including household products, personal care and food—saw the largest upswings week over week and remained the most-purchased categories. The proportions of consumers buying more in household products and personal care both increased by roughly 10 percentage points to new highs. Beauty and home products saw slightly fewer consumers buying more than pre-crisis, while the proportions buying more apparel and electronics broadly leveled off this week.
Buying less: Discretionary categories—including clothing and footwear, beauty, electronics and home—all saw week-over-week increases in the proportions of consumers buying less than before the crisis. Some 28.5% are currently buying less apparel—the hardest-hit category—and over one-fifth are buying less in the beauty category.
Ratio of less to more: The ratios of the proportions of respondents buying less to the proportions buying more in apparel, home, beauty and electronics all increased.
- The ratio for clothing and footwear raised slightly to 2.1, from 2.0 last week, but still below 2.2 two weeks ago.
- The ratio for beauty jumped to 2.0 after declining to an all-time low of 1.4 last week.
- The ratio for home spiked to 3.0, the highest level we have seen in months, compared to a consistent ratio of 1.7 in the past few weeks. Home categories, particularly home improvement, have been strong, fueling US retail sales growth this year. This week, with the proportion of consumers buying more home products than pre-crisis falling to the lowest level in months and a higher proportion buying less in the home categories, this might be an early indicator of a slowdown in home products. We will continue to monitor the trend in the upcoming weeks.
- The ratio for electronics returned to that of two weeks ago, at 1.4, from 1.3 last week.
 Respondents could select multiple options
Base: US respondents aged 18+
Source: Coresight Research[/caption] [caption id="attachment_119720" align="aligncenter" width="700"]
 Base: US respondents aged 18+
Source: Coresight Research[/caption]
Almost Three-Quarters Are Switching Spending Online
The proportion of consumers buying more online than they used to stood at 72.5%, compared to 73.8% last week. The e-commerce level has remained high despite the fluctuations in the proportion of consumers buying more in any category overall than before the crisis in the past couple of weeks, discussed previously.
[caption id="attachment_119721" align="aligncenter" width="700"]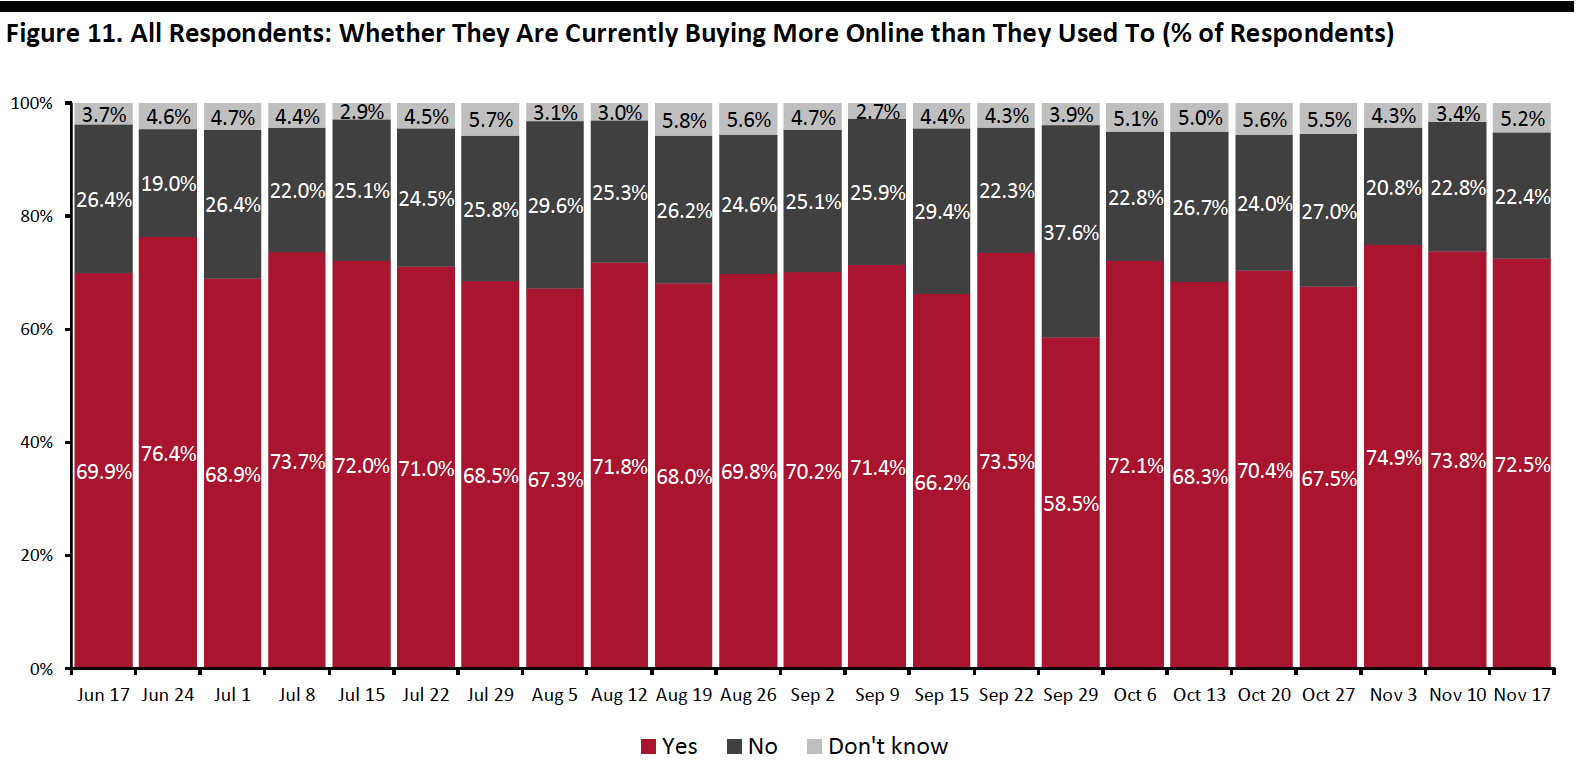 Base: US respondents aged 18+
Source: Coresight Research[/caption]
What Consumers Are Currently Buying More Of Online
Looking at specific categories, almost half of the 13 options we provided saw week-over-week declines in consumers buying more online than pre-crisis, although most of the changes were within the margin of error.
Household products saw the largest cutback of five percentage points in online purchases this week, after reaching a new high last week. Meanwhile, online purchases of personal care have seen a consistent upward trend in the past few weeks. The proportion of consumers buying more food also went down from 28.2% last week to 24.2% this week, although we saw more consumers had bought grocery online in the past two weeks, in a separate question.
The proportions of consumers buying more clothing, footwear or accessories and beauty online both increased slightly, week over week. Some 28.7% are buying more apparel online, and almost one-fifth are buying more beauty online than they used to. Online electronics purchases fell back a little after seeing an upward trend in the past month.
[caption id="attachment_119722" align="aligncenter" width="700"]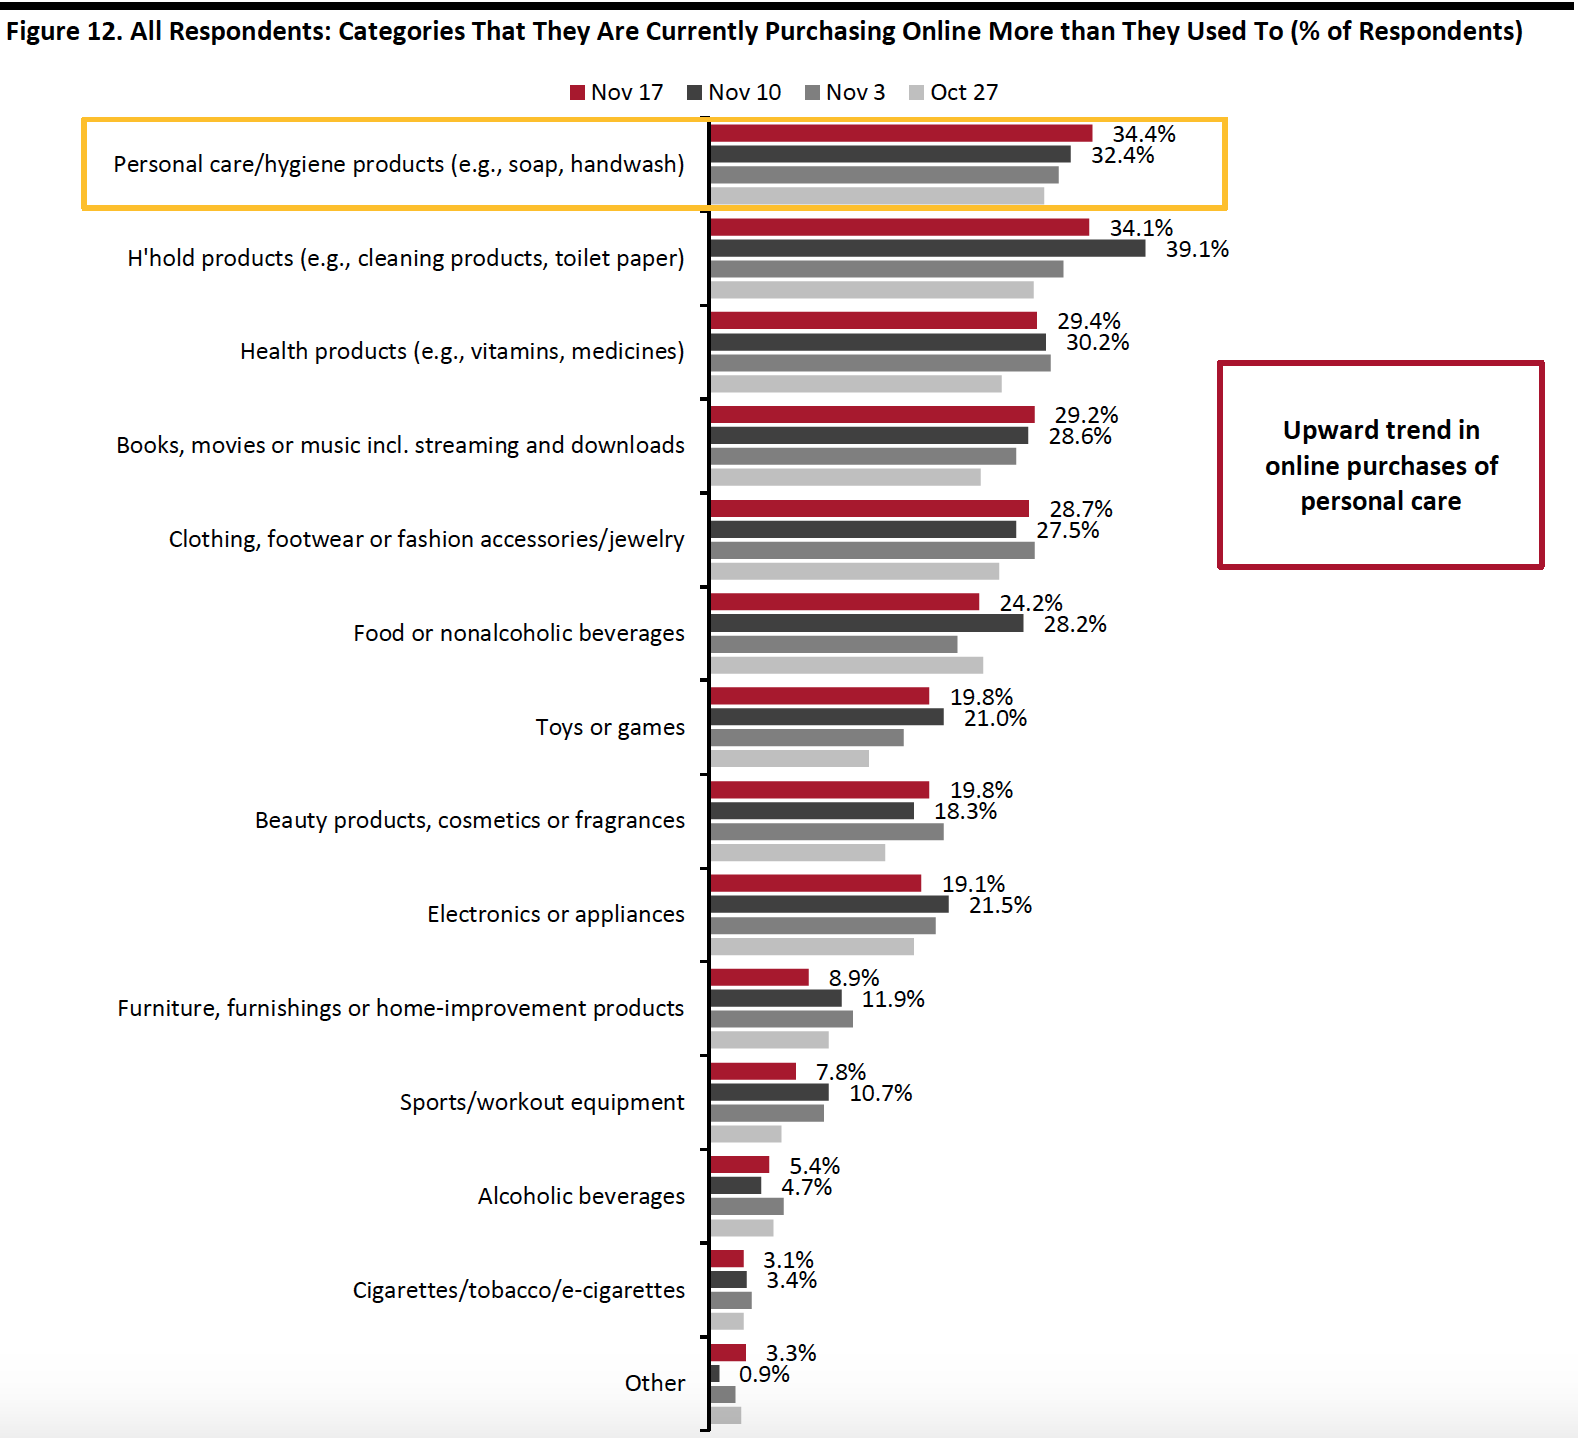 Respondents could select multiple options
Base: US respondents aged 18+
Source: Coresight Research[/caption]
What We Think
Product returns has been an ongoing problem for retailers, costing US retail hundreds of billions of dollars each year, especially as e-commerce continues to boom. Our survey results showed that among those that had returned unwanted purchases in the past 12 months, a much higher proportion (42.6%) prefer to return online orders by mail than in stores (25.4%), mounting logistics and labor costs.
Almost four in 10 also said that retailers’ returns policies influence where they shop, pressing retailers to adopt flexible returns policies. This could be a double-edge sword for retailers—a more relaxed returns policy helps attract and retain shoppers and potentially boost sales, but also contributes to rising returns.
For this year’s holiday season, a substantial proportion of consumers said they think that retailers should offer a longer returns window this year, due to Covid-19. However, we could see fewer returns this year than last year due to the pandemic, which is positive for retailers: A greater proportion of consumers expect to return fewer items versus last year than expect to return more items versus last year.
Retailers, especially of fashion and electronics, which saw the highest returns rates in the past 12 months, should be prepared to offer a smooth and convenient returns process and attempt to reduce the likelihood of online returns in the first place. This could include providing detailed sizing and fit information, or partnering with third-party innovators. For example, Newmine employs an artificial intelligence-powered platform to provide returns reduction solutions.
Some 37.2% of consumers would like the option to return through contactless drop-off points. Brands and retailers can partner with third-party platforms to meet this demand. For instance, third-party returns platforms Narvar and Happy Returns are working with brands to accept returns at different drop-off points such as malls, pharmacies and postal offices.
This week, we saw the following from our recurring weekly questions:
- Apparel: One week before Thanksgiving and Black Friday, we have seen an uplift in online apparel shopping this week, at the expense of in-store purchases. The proportion that had recently bought apparel online surged by seven percentage points to 35.8%—the highest in two months—while the proportion that bought apparel in-store fell to 19.1% this week. In a separate question, we also saw a slight increase in the proportion of consumers that are currently buying more clothing and footwear online than pre-crisis, week over week. Apparel remains the number-one category to buy as gifts for the holidays this year, and we are likely to see this metric remain high, especially in the online channel, as we move further into the season.
- Online Grocery: Online grocery shopping has shown great resilience, and the trend is here to stay: Our survey consistently finds roughly 30% of shoppers have bought groceries online in the latest two-week period. This week, the metric jumped to a new high in two months, to 34.6%. This supports our expectation of 60+% year-over-year growth in online food sales during the holiday period, which will propel full-year 2020 growth to around 75%. See our monthly US CPG Sales Tracker for more data on the trajectory of grocery e-commerce sales in the past few months.
- E-Commerce: We have been seeing a consistent proportion of almost three-quarters of consumers currently buying more online than they used to in the past couple of weeks, despite fluctuation in the proportion that are buying more overall than pre-crisis. The e-commerce level could remain elevated, as avoidance of shopping centers/malls and shops in general both appear to be creeping up. We expect total online sales to climb by around one-third in the holiday season. See our Holiday 2020: US Shopper Survey for more data on consumers’ holiday shopping expectations, and the US E-Commerce: Post-Crisis Outlook report for more e-commerce data and analysis.
Methodology
We surveyed respondents online on November 17 (425 respondents), November 10 (447 respondents), November 3 (418 respondents), October 27 (419 respondents), October 20 (409 respondents), October 13 (401 respondents), October 6 (416 respondents), September 29 (412 respondents), September 22 (422 respondents), September 15 (408 respondents), September 9 (406 respondents), September 2 (402 respondents), August 26 (414 respondents), August 19 (416 respondents), August 12 (400 respondents), August 5 (449 respondents), July 29 (403 respondents), July 22 (404 respondents), July 15 (454 respondents), July 8 (410 respondents), July 1 (444 respondents), June 24 (411 respondents), June 17 (432 respondents), June 10 (423 respondents), June 3 (464 respondents), May 27 (422 respondents), May 20 (439 respondents), May 13 (431 respondents), May 6 (446 respondents), April 29 (479 respondents), April 22 (418 respondents), April 15 (410 respondents), April 8 (450 respondents), April 1 (477 respondents), March 25 (495 respondents) and March 17–18 (1,152 respondents). The most recent results have a margin of error of +/- 5%, with a 95% confidence interval. Not all charted week-over-week differences may be statistically significant.