
albert Chan
What’s the Story?
This report presents the results of Coresight Research’s latest weekly survey of US consumers on the coronavirus outbreak, undertaken on August 19, 2020. We explore the trends we are seeing from week to week, following prior surveys on August 12, August 5, July 29, July 22, July 15, July 8, July 1, June 24, June 17, June 10, June 3, May 27, May 20, May 13, May 6, April 29, April 22, April 15, April 8, April 1, March 25 and March 17–18.
Online Grocery Shopping Behavior
This week, we asked consumers about their online grocery shopping behavior in the past 12 months and how the coronavirus pandemic has changed that behavior. We compare some of the results with findings from our main annual US online grocery survey, conducted five months earlier on March 17–18, 2020. We asked respondents who had bought groceries online in the past 12 months:
- Which retailers they bought from.
- How much of their total grocery shopping is done online.
- Whether the coronavirus outbreak has affected how they buy groceries online.
- Whether they expect to change their frequency of online grocery shopping compared to now, once the outbreak eases or ends.
Walmart Overtakes Amazon as the Most-Shopped Online Grocery Retailer
Some 60.1% of respondents had bought groceries online in the past 12 months, up eight percentage points from 52.0% in March. By age, we saw the highest proportion that had purchased online groceries in the 30–44 age group, the same as in March.
A large proportion of consumers are buying in any two-week period: As we show later, our regular weekly question found that 35.6% of all respondents had bought groceries online in the past two weeks.
Among respondents who bought groceries online in the past year, Walmart overtook Amazon as the most-shopped retailer: Some 56.4% have bought from Walmart, versus 52.3% in March, indicating that Walmart’s continued investments in online grocery are paying off in its battle with Amazon. The proportion of online grocery shoppers buying from Amazon declined by nearly eight percentage points to 54.8%.
Most of the other retailers saw relatively consistent results compared to five months ago. Except for Amazon, multichannel retailers remain more popular than online pure plays—albeit often with the assistance of service providers such as Instacart.
We found that online grocery shoppers bought from an average of 2.2 retailers, about the same as in March.
[caption id="attachment_114947" align="aligncenter" width="700"]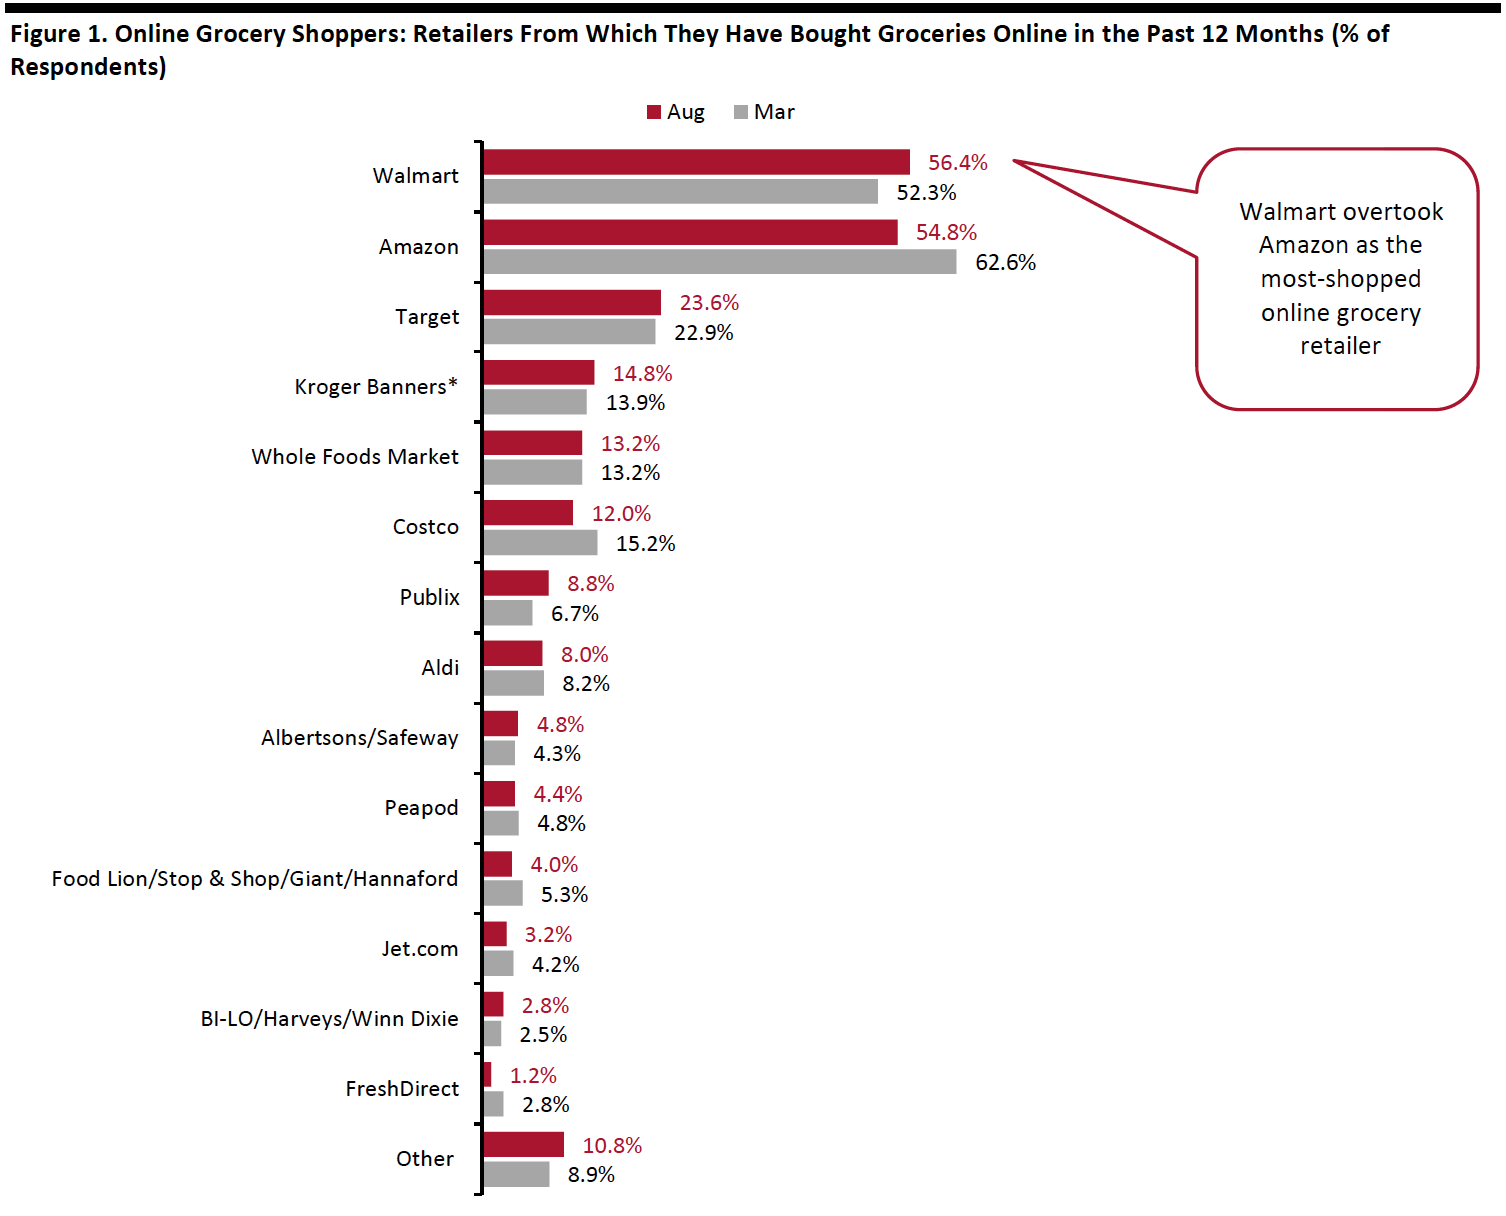 Respondents could select multiple options
Base: US Internet users aged 18+ who had bought groceries online in the past 12 months (599 in March, 250 in August)
*Kroger banners include Fred Meyer, Harris Teeter, Kroger, Smith’s Food & Drug, King Soopers, City Market and Ralphs
Source: Coresight Research[/caption]
In the past week, Walmart reported 97% year-over-year growth in online sales at its Walmart US segment in its second quarter (including nongrocery orders). Amazon had previously reported a tripling of its global online grocery sales in its second quarter. Squaring these figures with our survey data implies that Amazon grew its US sales primarily through existing customers placing bigger-basket orders or more frequent orders, while Walmart’s growth may also have been fueled by attracting new online shoppers.
Consumers Are Taking on Larger Share of Their Grocery Shopping Online
Online grocery shoppers are shifting more of their grocery shopping to e-commerce:
- A total of 47.6% of online grocery shoppers said they do “almost none” or “a small amount” of their grocery shopping online—down 16 percentage points from 63.1% in March.
- A total of 27.6% of online grocery shoppers said they do “most” or “all or almost all” of their grocery shopping online—up around 14 percentage points from 14.0% in March.
The proportion of respondents doing “a small amount” of their grocery shopping online saw the sharpest decline of 12 percentage points. While consumers who said “all or almost all” of their grocery shopping is currently done online witnessed a 10-percentage-point increase.
[caption id="attachment_114948" align="aligncenter" width="700"]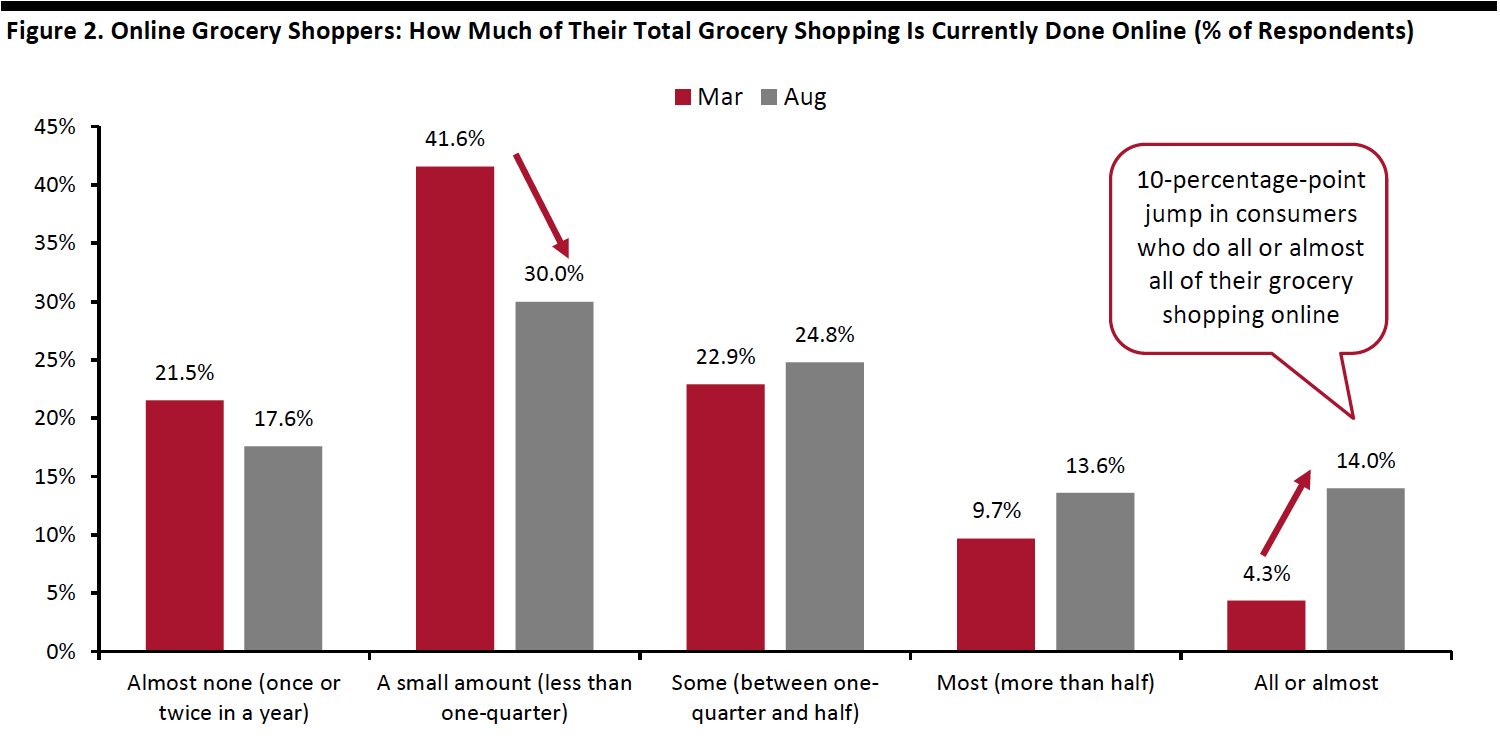 Base: US Internet users aged 18+ who had bought groceries online in the past 12 months
Source: Coresight Research[/caption]
Covid-19 Boosts the Adoption of Online Grocery Shopping
The coronavirus pandemic has pushed more consumers to purchase groceries online: 64.0% of online grocery shoppers said they are buying more or started buying grocery online due to the crisis, up 15 percentage points from around half in mid-March, when the outbreak just began to spread across the country. This is in line with the surge in consumer demand for online grocery, reported by major retailers including Amazon, Kroger, Target and Walmart.
- Around one-quarter said they started buying groceries online, a jump of 11 percentage points from 14.4% in March. By age, we noticed that new adopters of online grocery shopping peak among consumers who are over 60.
- Some 38.4% are buying more groceries online because of the pandemic, slightly up from 34.9% in March.
- Consumers who said that the Covid-19 has had no impact on their online grocery shopping also dropped by 13 percentage points, to 27.2% from 40.2% in March.
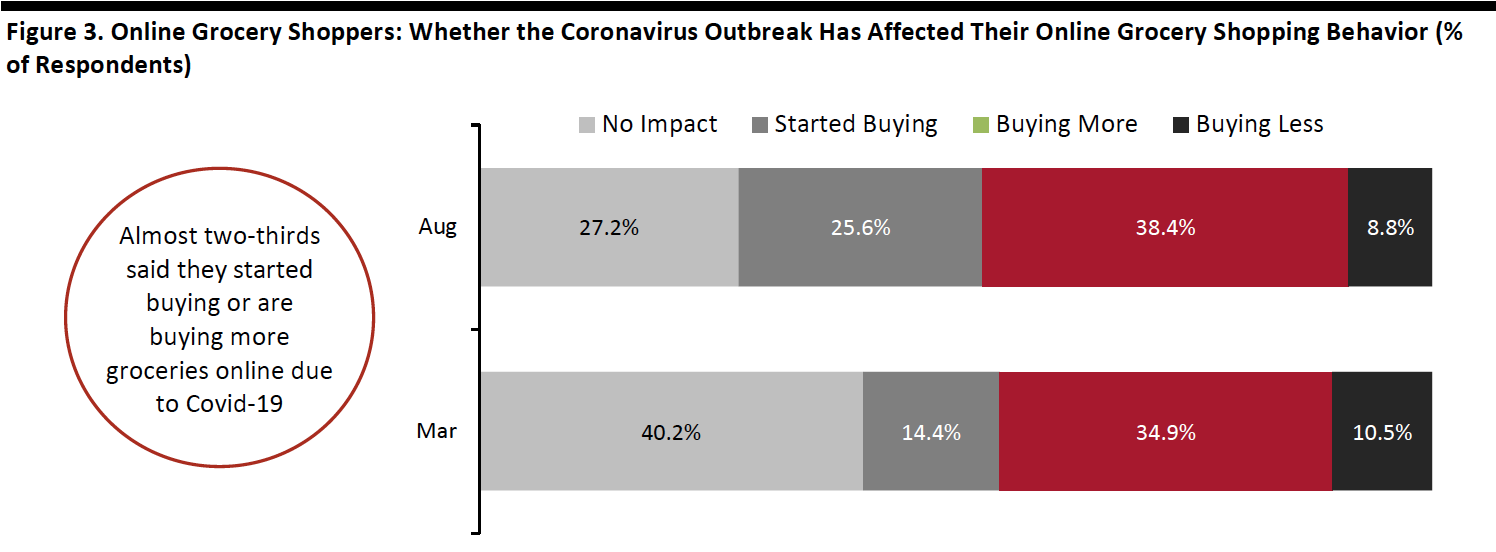 Base: US Internet users aged 18+ who had bought groceries online in the past 12 months
Source: Coresight Research[/caption]
Our survey suggests the change in online grocery shopping frequency caused by the pandemic is likely to stay.
- Some 36.4% of online grocery shoppers do not expect to change their online grocery shopping habits once the crisis eases or ends. We found that 18.8% of online grocery shoppers who started buying or buying more groceries online plan to remain their current purchase frequency.
- Almost one-third expect to shop for groceries online “somewhat less often” or “much less often” (which we defined as cutting frequency by more than half) compared to now. Only 7.2% expect to stop buying groceries online.
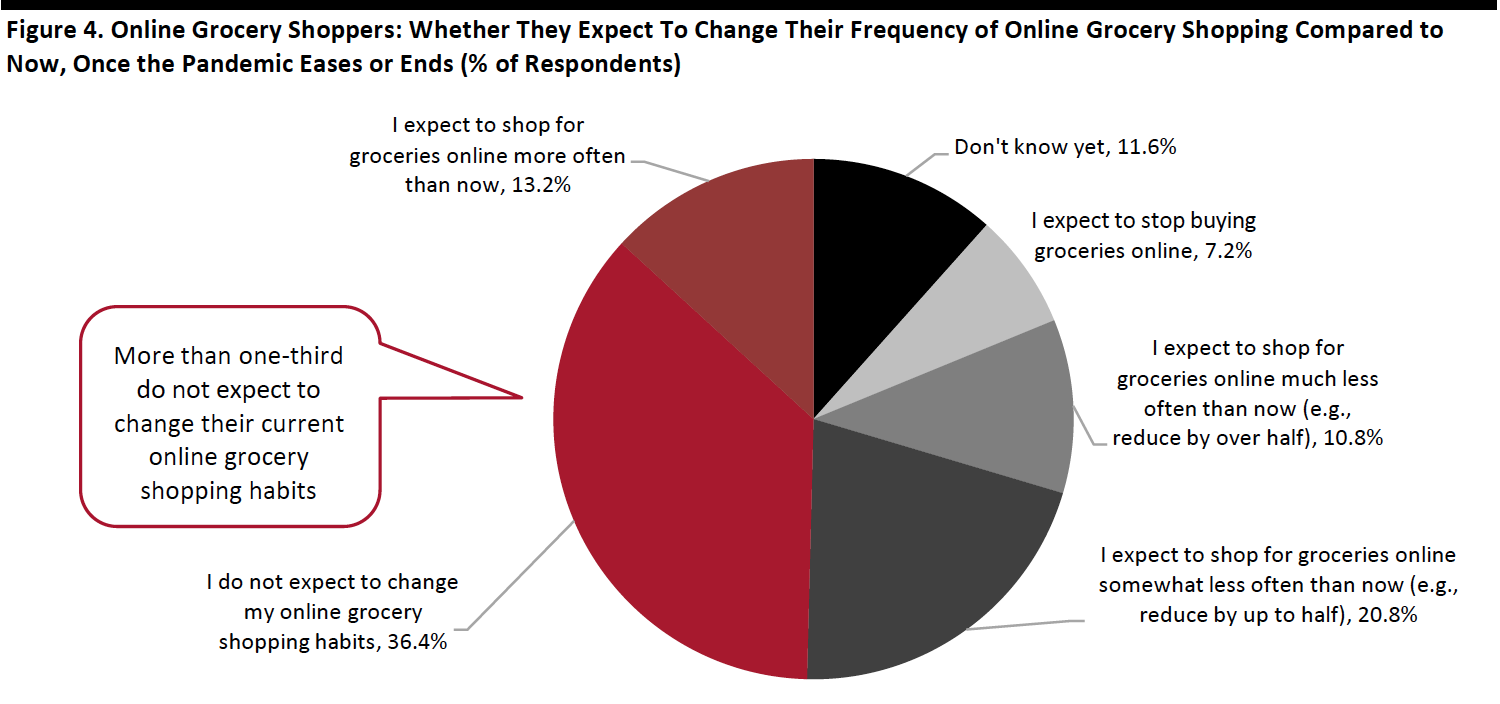 Base: 250 US Internet users aged 18+ who had bought groceries online in the past 12 months
Source: Coresight Research[/caption]
The surge in adoption of online grocery shopping due to the pandemic is consistent with the elevated level of consumers that are buying more groceries online than they used to and those that had bought grocery online in the past two weeks—these are two of the questions we ask each week and the results of which we discuss in the next section.
What Shoppers Are Doing and Where They Are Going
Online Grocery Shopping Remains the Top Spending Activity in the Past Two Weeks
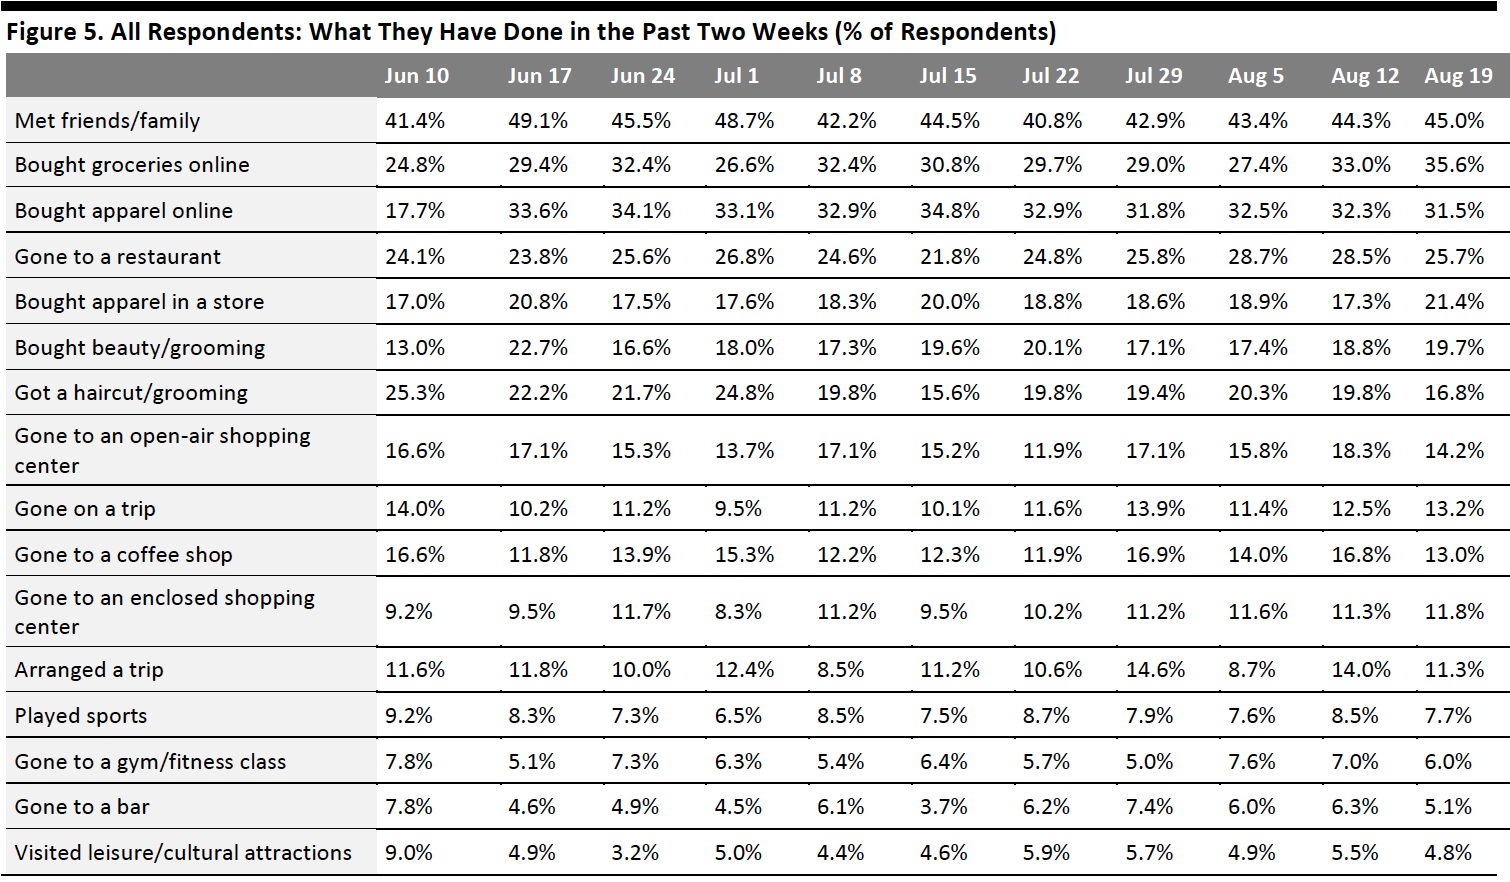
Each week, we ask consumers what they have done in the past two weeks. This week, the proportions of respondents increased for six of the 16 options we provided for activities done recently—although all such changes were within the margin of error.
- For the second week running, online grocery shopping proved more popular than online apparel shopping. The proportion of respondents that had bought groceries online spiked to a new high: 35.6% versus one-third last week. This is aligned with the increasing level of consumers that are currently buying more groceries online than before the pandemic (discussed later in the report).
- Some 31.5% respondents had bought apparel online in the past two weeks, fairly consistent from the figure last week. Over one-fifth had bought apparel in a store, slightly up from 17.3% last week; this is the highest level since we started asking the question.
- The proportion of respondents that had visited an open-air shopping center declined slightly after reaching the highest level last week. One in seven had visited this type of public place this week. The proportion of consumers that visited an enclosed shopping mall has plateaued in recent weeks, at around 12%.
 Respondents could select multiple options
Base: US Internet users aged 18+
Source: Coresight Research[/caption]
Expectations To Visit Shopping Malls over the Next Two Weeks Are Low
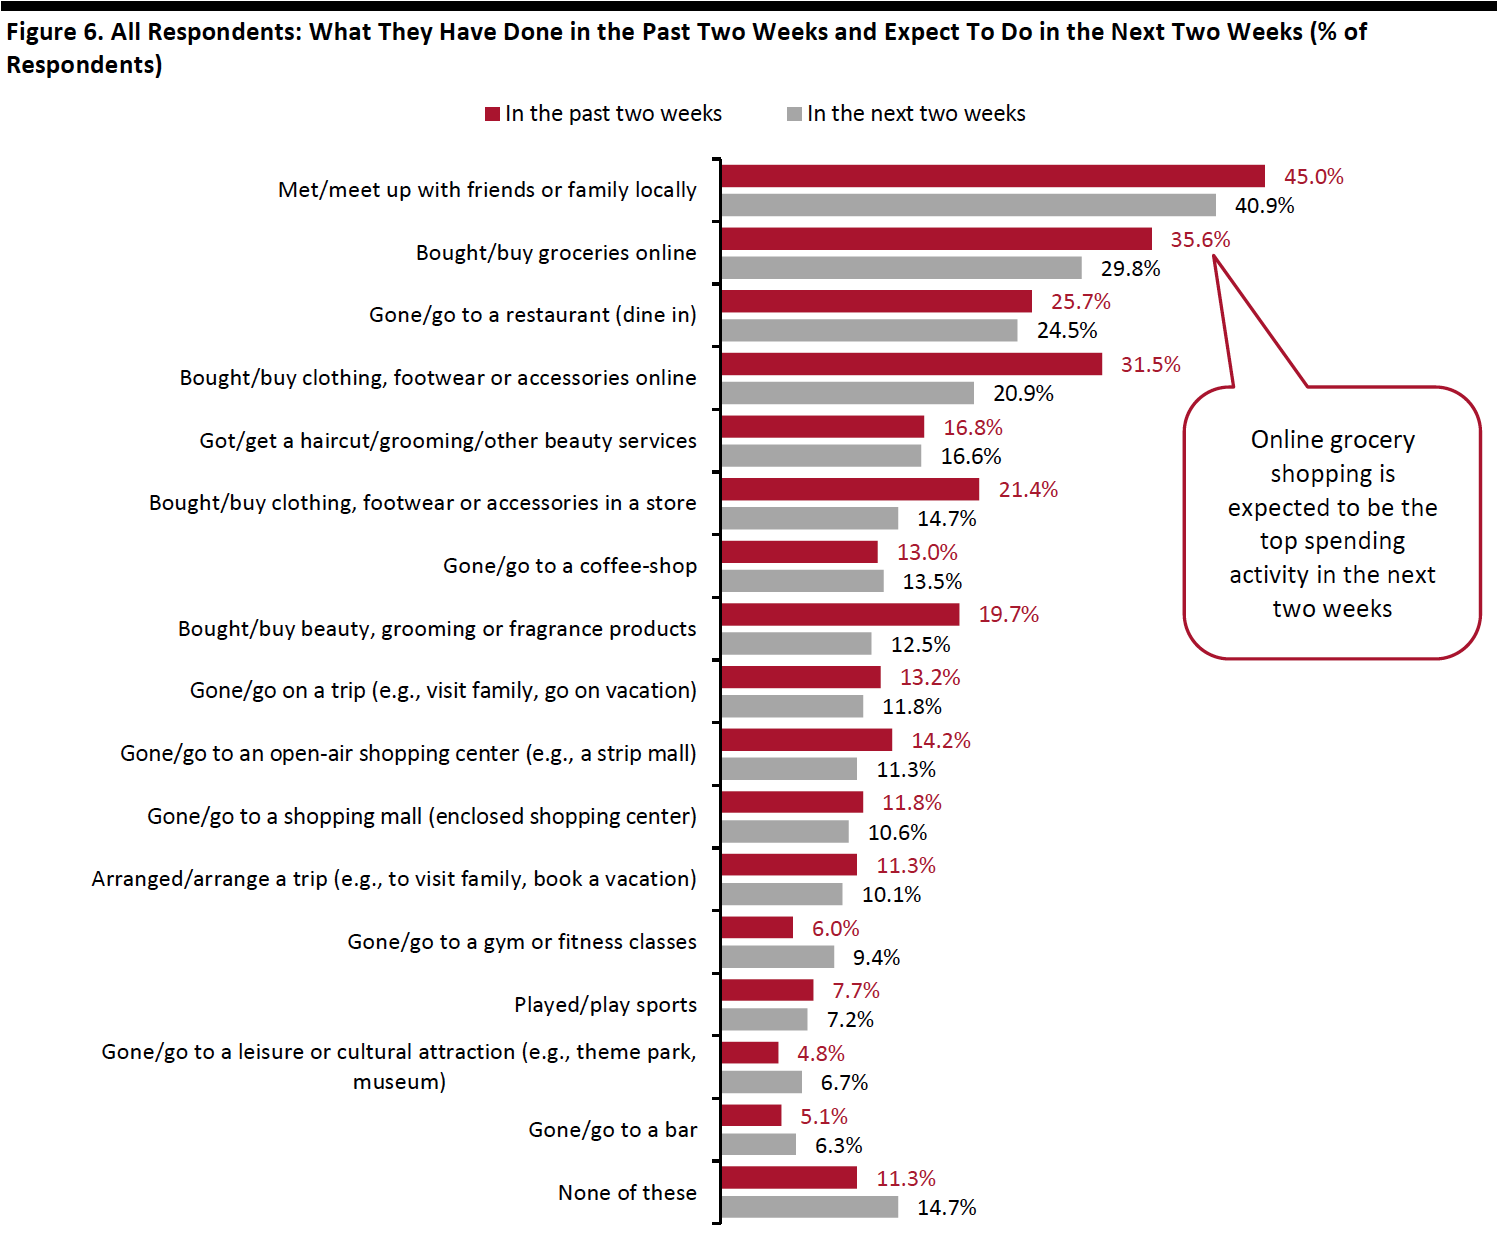
Each week, we ask consumers what they expect to do in the next two weeks, with a comparable set of options to those for the last two weeks. In the chart below, we compare these short-term expectations with recent actual behavior.
We saw slightly lower proportions of consumers expecting to do 11 of the 16 options we provided for activities in the next two weeks than actual behavior in the past two weeks.
- Online grocery shopping continues to be the number-one spending activity in the next two weeks, with three in 10 planning to do so, six percentage points lower than the actual behavior of such activity in the last two weeks.
- One-quarter expect to buy clothing or footwear online in the next two weeks, and 14.7% plan to do so in a store. Only 12.5% expect to purchase beauty products. We expect to see higher proportions in actual behaviors of these activities, as consumers may not plan discretionary purchases ahead.
- Only one in 10 expect to visit both open-air and enclosed shopping malls. The low expectation in going to such locations is aligned with consumers’ high avoidance of shopping centers/malls, which we discuss in the next section of this report.
 Respondents could select multiple options
Base: US Internet users aged 18+
Source: Coresight Research[/caption]
Eight in 10 Are Currently Avoiding Public Places
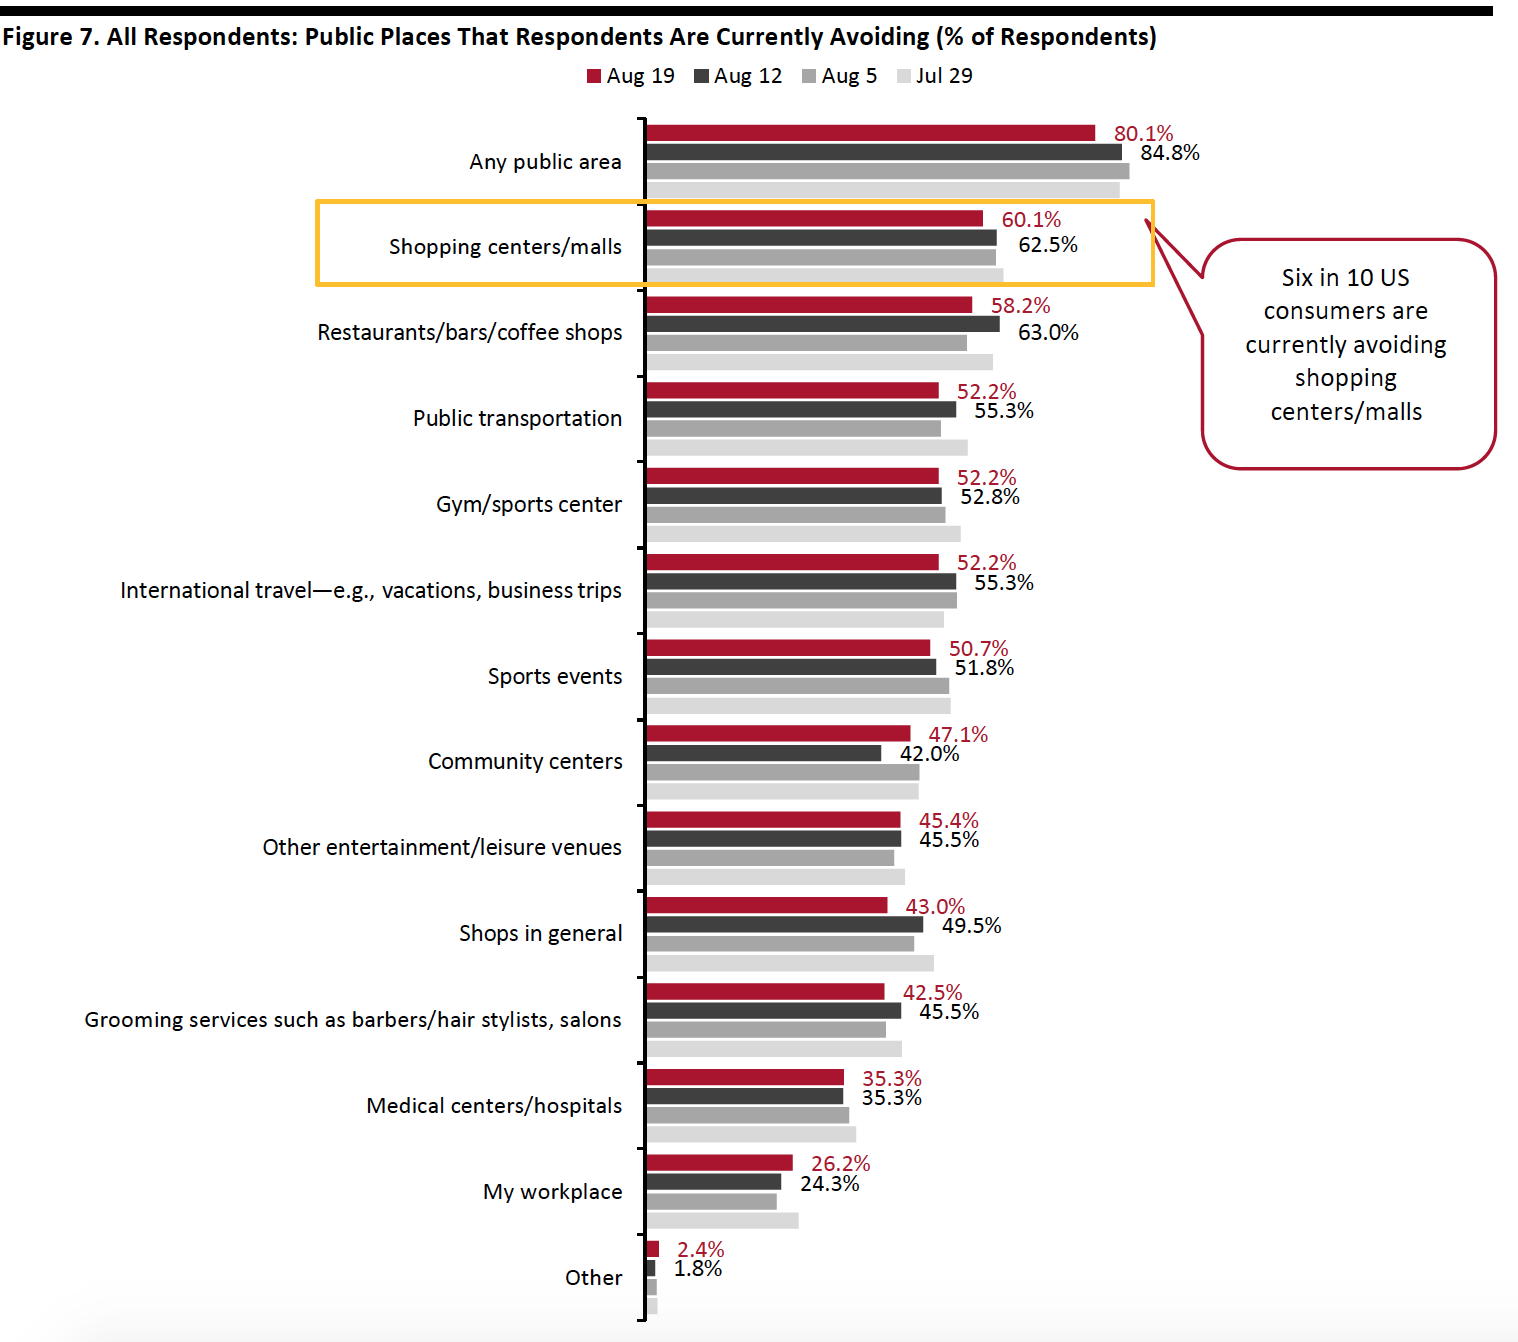
This week, the proportion of respondents saying that they are avoiding any type of public area dropped almost five percentage points to 80.1%, from 84.8% last week.
We saw slight decreases in avoidance for around half of the 12 options provided, although most of the changes were within the margin of error:
- The proportion of respondents that are currently avoiding shopping centers/malls slid slightly to six in 10 this week, compared to 62.5% last week. We have seen a gradual declining trend in the avoidance rate of malls after the peak of two-thirds a month ago. However, the rate remains high, and shopping centers/malls continue to be the most-avoided place among consumers.
- The proportion of respondents that are currently avoiding food-service locations fell back by five percentage points to the level we saw two weeks ago, after jumping to the highest level last week. Some 58.2% are currently avoiding restaurants/bars/coffee shops, down from 63.0% last week.
- Shops in general saw the highest decline in avoidance this week, of almost seven percentage points: Some 43.0% of respondents are currently avoiding these places, versus almost half last week.
 Respondents could select multiple options
Base: US Internet users aged 18+
Source: Coresight Research[/caption]
Reviewing Trend Data in Current Purchasing Behavior
What Consumers Are Currently Buying More Of and Less Of
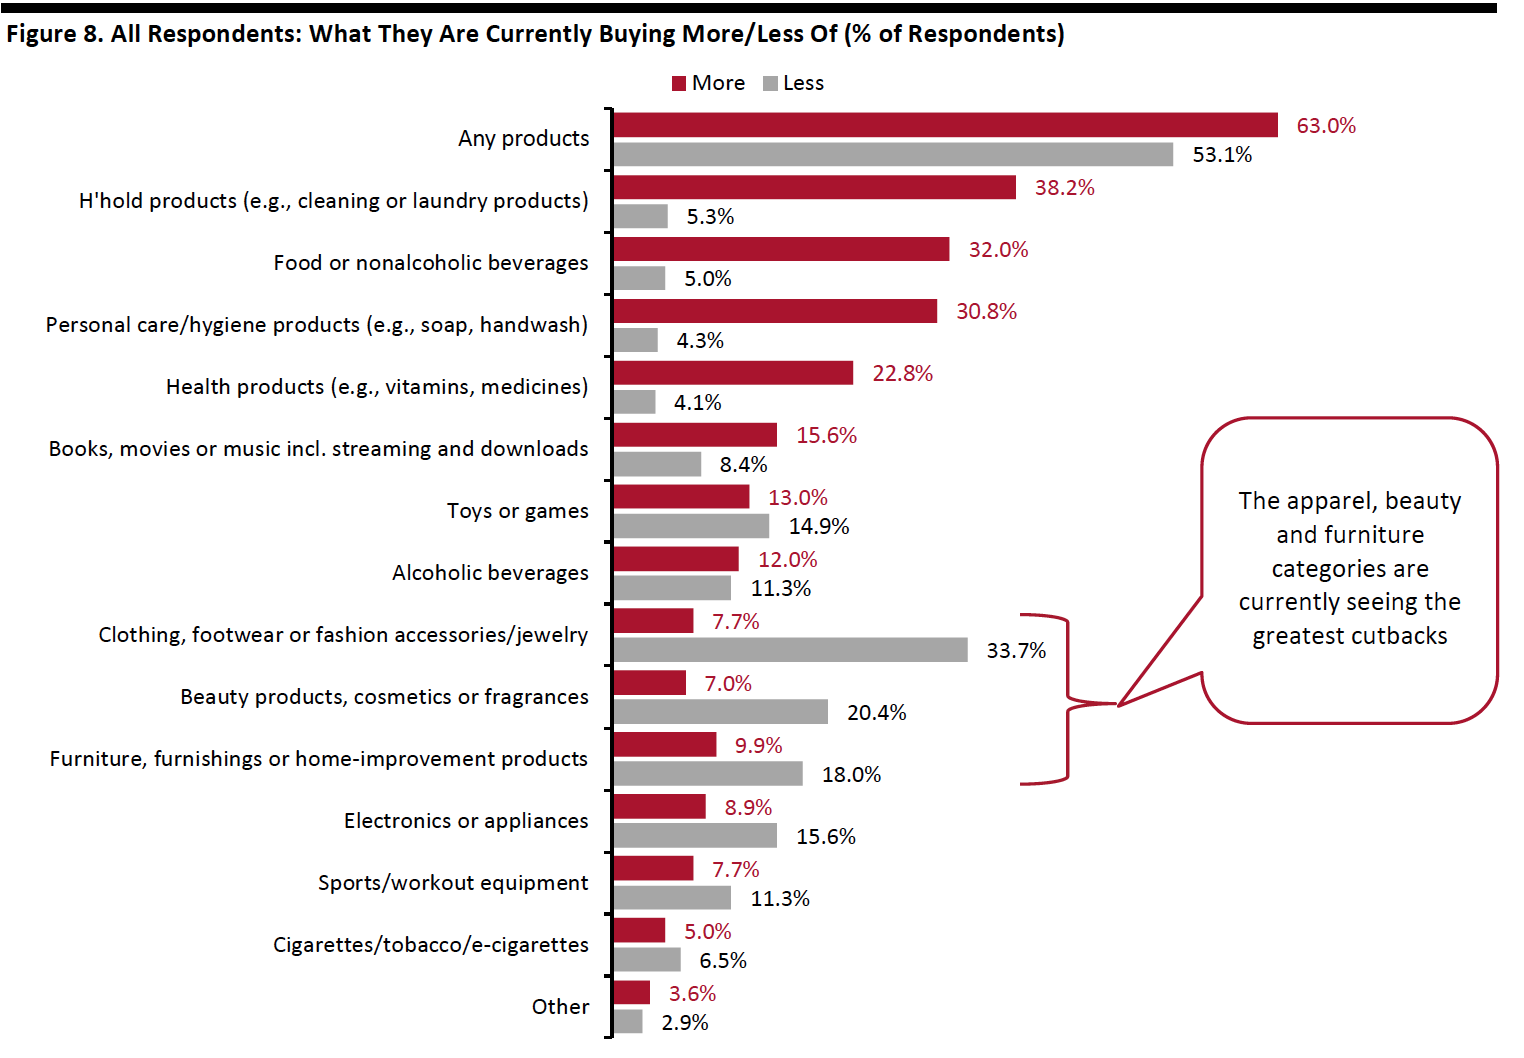
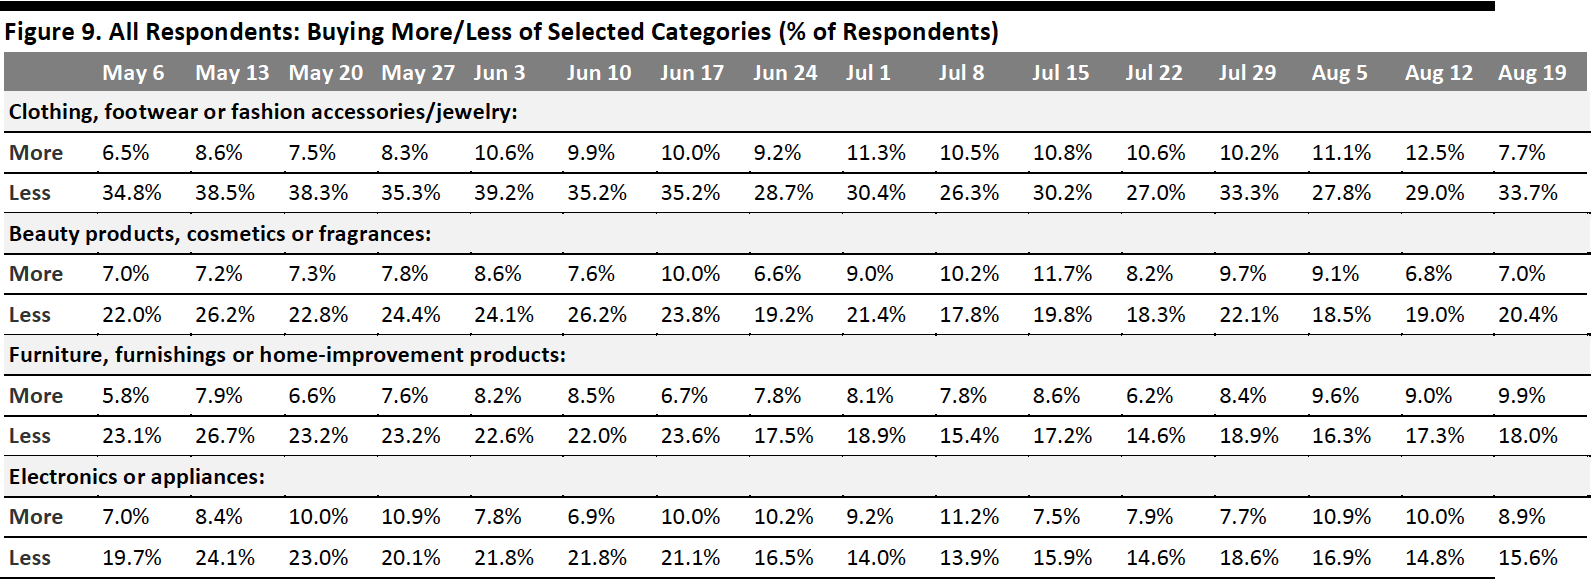
The proportion of respondents that are currently buying more of any category stood at 63.0% this week, versus two-thirds last week. The proportion of respondents that are currently buying less increased slightly to 53.1%, from half last week.
- Buying more of certain categories and buying less of certain categories were not mutually exclusive options, so respondents could answer yes to both.
Buying more: Essentials, including household products, food and personal care, continue to take the top spot of buying more, but the proportions in all three categories declined week over week. Personal care products saw the largest drop of nine percentage points this week.
Buying less: We have seen fluctuations in the proportions of respondents buying less in discretionary categories over the past couple of weeks. This week, we saw more consumers buying less in apparel. One-third are currently spending less on apparel, up almost five percentage points from 29.0% last week. The proportions of respondents buying less in other discretionary categories, including beauty, home and electronics, remained relative stable week over week.
Ratio of less to more: The ratios of the proportions of respondents buying less to the proportions buying more in all discretionary categories listed in Figure 9 (except the home category) saw increases.
- The ratio for apparel jumped to 4.4 after reaching the lowest ratio last week. This is also the first time since end of May that the ratio bounced back to above four.
- The ratio for electronics raised to 1.8 from 1.5 last week.
- The ratio for beauty stood at 2.9, versus 2.8 last week.
- The ratio for home went down slightly to 1.8 this week, compared to 1.9 last week.
 Respondents could select multiple options
Base: US Internet users aged 18+
Source: Coresight Research[/caption] [caption id="attachment_114955" align="aligncenter" width="700"]
 Base: US Internet users aged 18+
Source: Coresight Research[/caption]
Over Two-Thirds Are Switching Spending Online
This week, we saw the proportion of consumers buying more online than they used to fall slightly after a five-percentage-point jump last week. Some 68.0% of consumers stated that they are buying more online than they used to this week, versus 71.8% last week (this change is within the margin of error).
[caption id="attachment_114956" align="aligncenter" width="700"]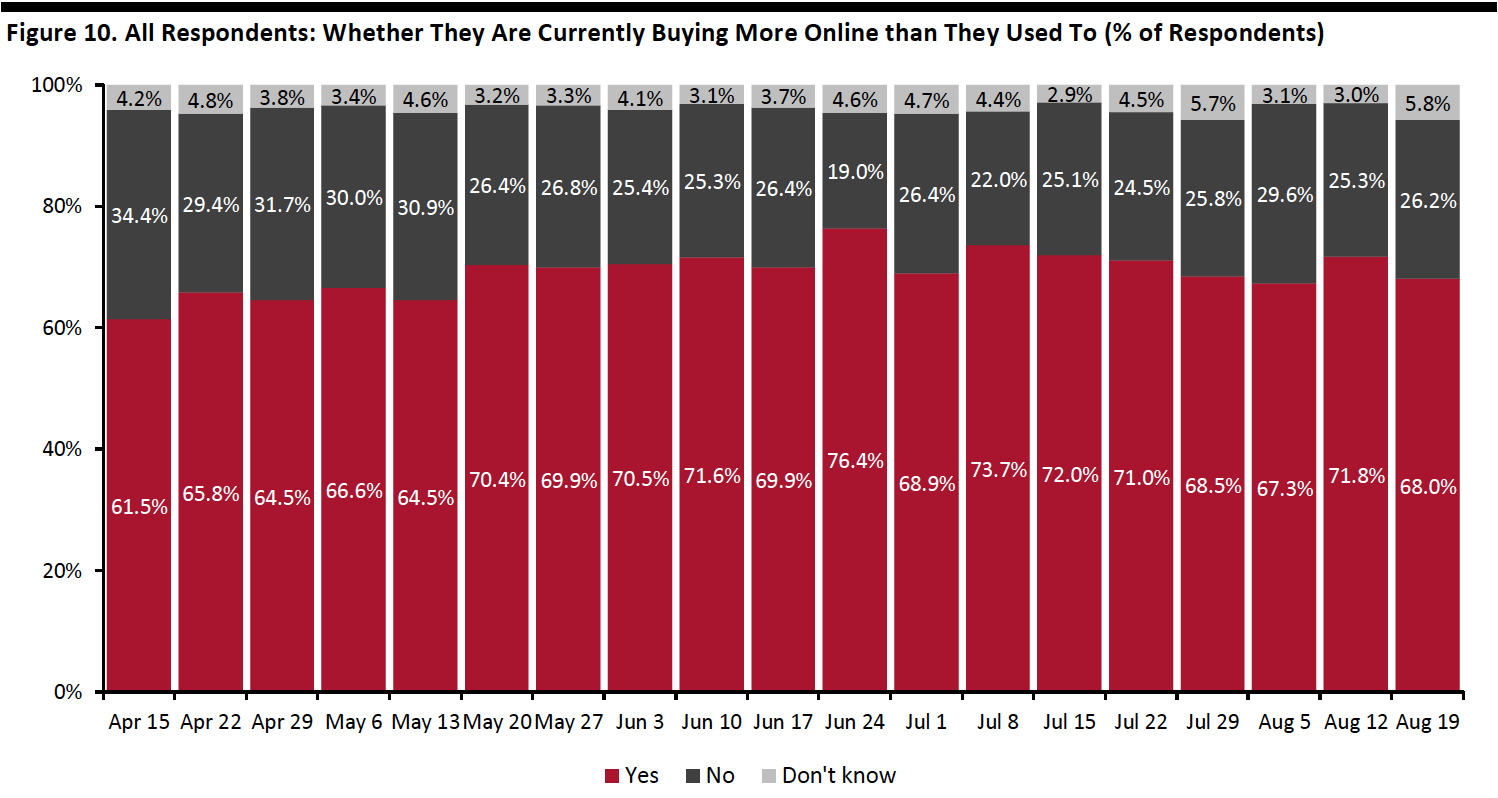 Base: US Internet users aged 18+
Source: Coresight Research[/caption]
What Consumers Are Currently Buying More Of Online
This week, we saw decreases in the proportions of consumers that are currently buying more online than they used to in about half of the 13 categories, driven by purchases of essential products. Personal care saw the largest decline, of nine percentage points, after a surge last week, with 27.2% saying they are currently buying more online. Household products also fell back to the level we saw two weeks ago.
Food is the only essentials category that saw a slight increase and became the top category consumers are buying more of online this week. Some 27.6% are buying more food online, versus 26.0% last week. This is also the highest level we have seen since April, echoing our previous finding that more consumers had shopped grocery online in the past two weeks.
The proportion of consumers that are currently buying more apparel online also went down slightly this week, to 23.8% from 27.0% last week. The proportion of respondents that are currently buying more discretionary including beauty, home and electronics online remained fairly stable this week.
[caption id="attachment_114957" align="aligncenter" width="700"]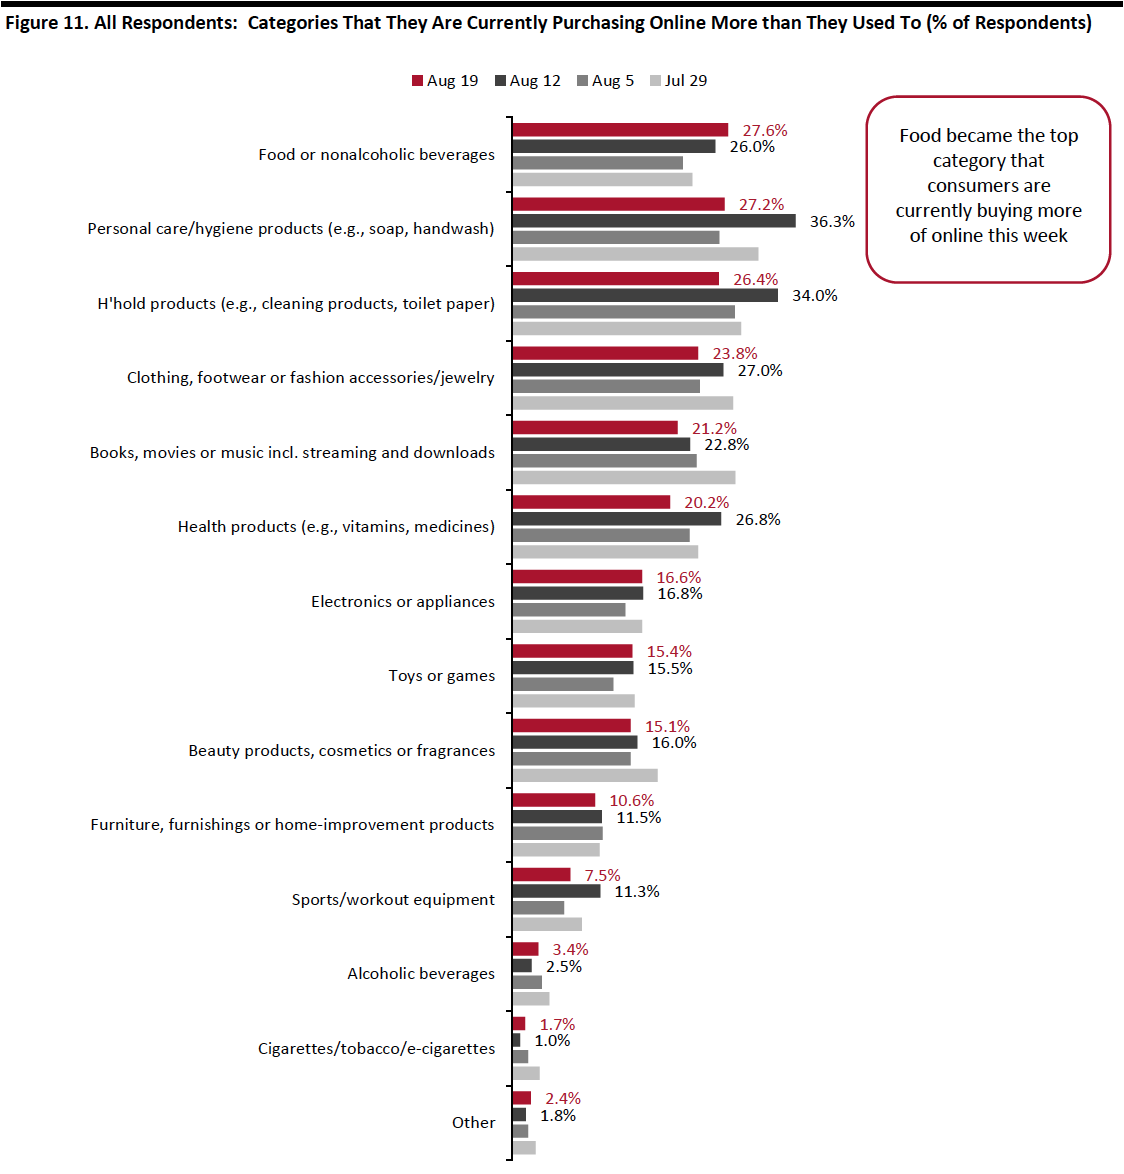 Respondents could select multiple options
Base: US Internet users aged 18+
Source: Coresight Research[/caption]
What We Think
Implications for Brands and Retailers
Our survey results show that online grocery shopping trend is here to stay—only 7.2% plan to stop online grocery shopping outbreak eases or ends. Meanwhile, shopping for groceries online in the past two weeks and the proportion of consumers that are buying more groceries online rose slightly this week.
We estimate that food and beverage e-commerce market will surge by 45–50% in 2020 and growth will taper off to low single digits in 2021, as demand gradually stabilizes.
The online channel is becoming a “must-have” for grocery retailers because of the pandemic. However, the costs associated with online grocery fulfillment and delivery are high. Bigger grocery retailers should continue to ramp up investments in automated fulfillment capabilities and use their physical stores as micro-fulfillment centers to serve consumer demand at lower costs. Offering pickup services including in-store and curbside pickup also help save delivery costs. Smaller grocers can also consider partnering with third-party delivery service providers such as Instacart.
This week, we also saw the following:
- Apparel: Online remains the preferred channel over brick-and-mortar retail for apparel shopping. We have seen a stable proportion of over 30% of consumers buying apparel online in the two weeks prior to each weekly survey, and 23.8% of respondents are currently purchasing more apparel online than pre-crisis. However, apparel remains the most-cut category, with more consumers reporting that they are currently purchasing less apparel than that of last week. The ratio of respondents buying less apparel to those buying more this week also went up to 4.4 from 2.3 last week.
- E-Commerce: This week, we found 68% of consumers said that they are currently buying more online than they used to, versus 72% last week. The level is close to the plateau of around seven in 10 that we saw in most of the weeks since late May, reflecting that the trend of shift to online shows no signs of slowdown. We expect capacity in logistics to be an inhibitor on e-commerce growth as we move toward the holiday peak.
Methodology
We surveyed respondents online on August 19 (416 respondents), August 12 (400 respondents), August 5 (449 respondents), July 29 (403 respondents), July 22 (404 respondents), July 15 (454 respondents), July 8 (410 respondents), July 1 (444 respondents), June 24 (411 respondents), June 17 (432 respondents), June 10 (423 respondents), June 3 (464 respondents), May 27 (422 respondents), May 20 (439 respondents), May 13 (431 respondents), May 6 (446 respondents), April 29 (479 respondents), April 22 (418 respondents), April 15 (410 respondents), April 8 (450 respondents), April 1 (477 respondents), March 25 (495 respondents) and March 17–18 (1,152 respondents). The most recent results have a margin of error of +/- 5%, with a 95% confidence interval. Not all charted week-over-week differences may be statistically significant.