
Nitheesh NH
What’s the Story?
This report presents the results of Coresight Research’s latest weekly survey of US consumers, including on the impacts of the coronavirus outbreak, undertaken on October 20, 2020. We explore the trends we are seeing from week to week, following prior surveys on October 13, October 6, September 29, September 22, September 15, September 9, September 2, August 26, August 19, August 12, August 5, July 29, July 22, July 15, July 8, July 1, June 24, June 17, June 10, June 3, May 27, May 20, May 13, May 6, April 29, April 22, April 15, April 8, April 1, March 25 and March 17–18.What Shoppers Are Doing and Where They Are Going
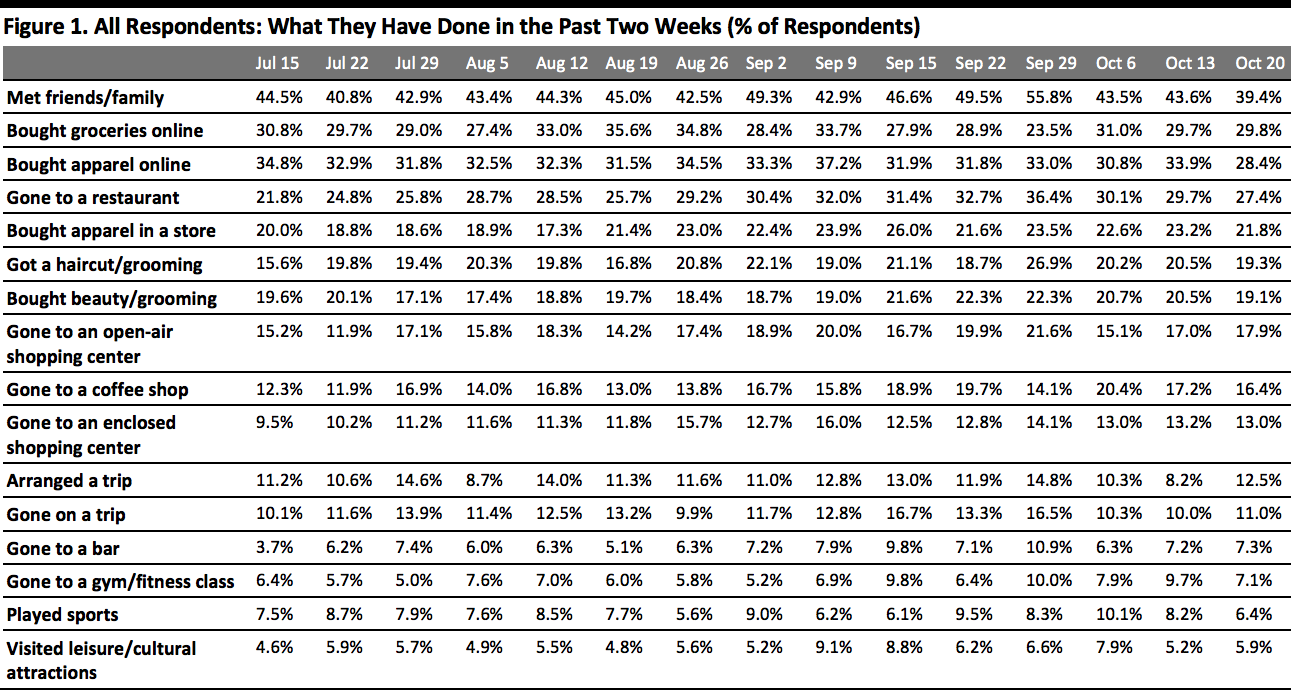
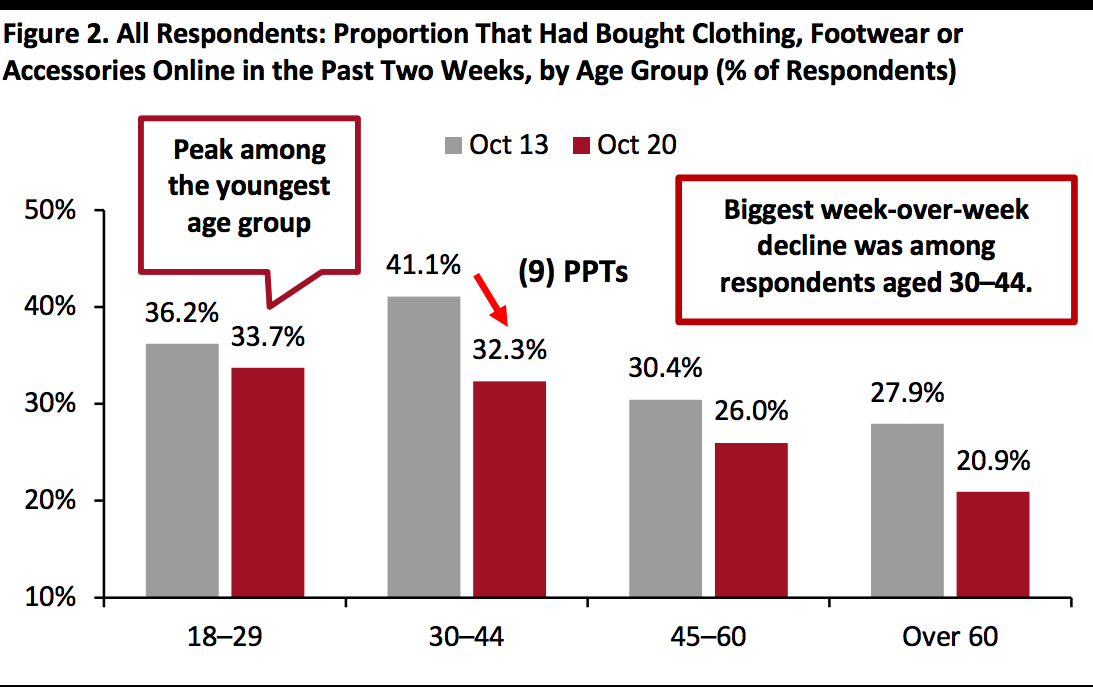
Fewer Consumers Are Buying Apparel Online Each week, we ask consumers what they have done in the past two weeks. This week, the proportion of respondents slightly declined for half of the 16 options we provided for recent activity options. Most of the week-over-week changes were within the margin of error; however, the directional trends, including over a number of weeks, can prove informative.- We saw online apparel shopping taper off this week: The proportion of respondents that had bought clothing, footwear or accessories online in the past two weeks fell below 30% for the first time; some 28.4% had done so, down almost six percentage points from 33.9% last week. This is also the lowest level we have seen since June 17. By looking at age distribution, shown in Figure 2, we saw the largest week-over-week decline in respondents aged 30–44, with around a nine-percentage-point drop.
- However, we did not see a shift of apparel purchase to in-store—The proportion that had bought apparel in a store stood at 21.8%, compared to 23.2% last week. This suggests that consumers were buying less clothing, footwear or accessories overall, possibly due to a switch of spending to other categories on Amazon’s Prime Day or during other promotional events.
- Some 29.8% of respondents said they had bought groceries online in the past week, level with the findings last week. In a separate survey question in this report, the proportion of consumers that are buying more food online than before the pandemic also remained relatively stable.
- The proportion of consumers that visited both open-air and enclosed shopping centers remained stable: Some 17.9% had gone to an open-air shopping center, and 13.0% had visited an enclosed one. However, we saw the avoidance rate of shopping centers/malls fall to a new low since July, which we discuss later in this report.
 Respondents could select multiple options
Base: US respondents aged 18+
Source: Coresight Research[/caption] [caption id="attachment_118122" align="aligncenter" width="600"]
 Base: US respondents aged 18+
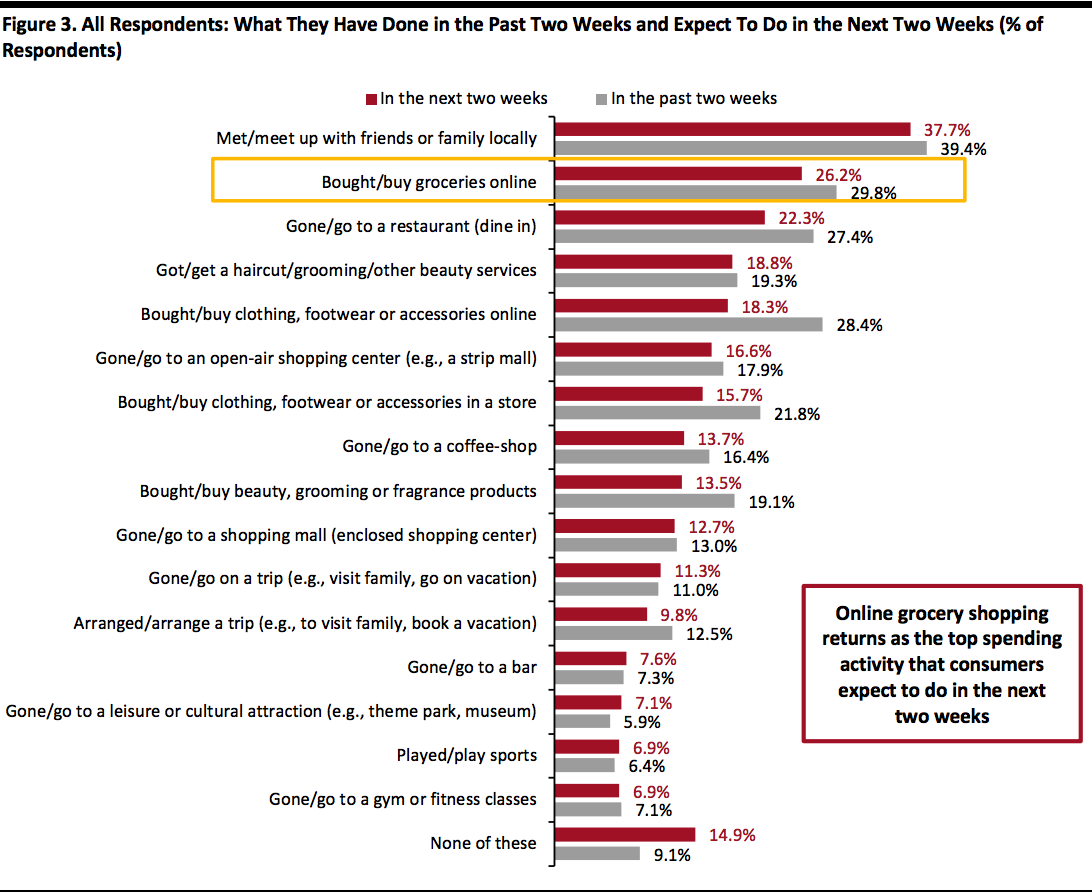
Source: Coresight Research[/caption] Online Grocery Shopping Returns as the Top Spending Activity for the Next Two Weeks Each week, we ask consumers what they expect to do in the next two weeks, with a set of options comparable to those for the last two weeks. In the chart below, we compare these short-term expectations with recent actual behavior. We saw slightly lower proportions of consumers expecting to do nine of the 16 options we provided for activities in the next two weeks than actual behavior in the past two weeks.
- Online grocery shopping returned as the top expected spending-related activity for consumers to do in the next two weeks, with 26.8% planning to do so, a little lower than the 29.8% of actual behavior in the past two weeks.
- The proportion of respondents that expect to buy clothing or footwear online stood at 18.3%, and 15.7% plan to do so in a store. Some 13.5% of consumers expect to purchase beauty products. We expect to see higher proportions in actual behavior of these shopping activities, especially in apparel, as we are entering the holiday season and the actual behavior of those activities has typically exceeded expected behavior in past survey results.
 Respondents could select multiple options
Base: US respondents aged 18+
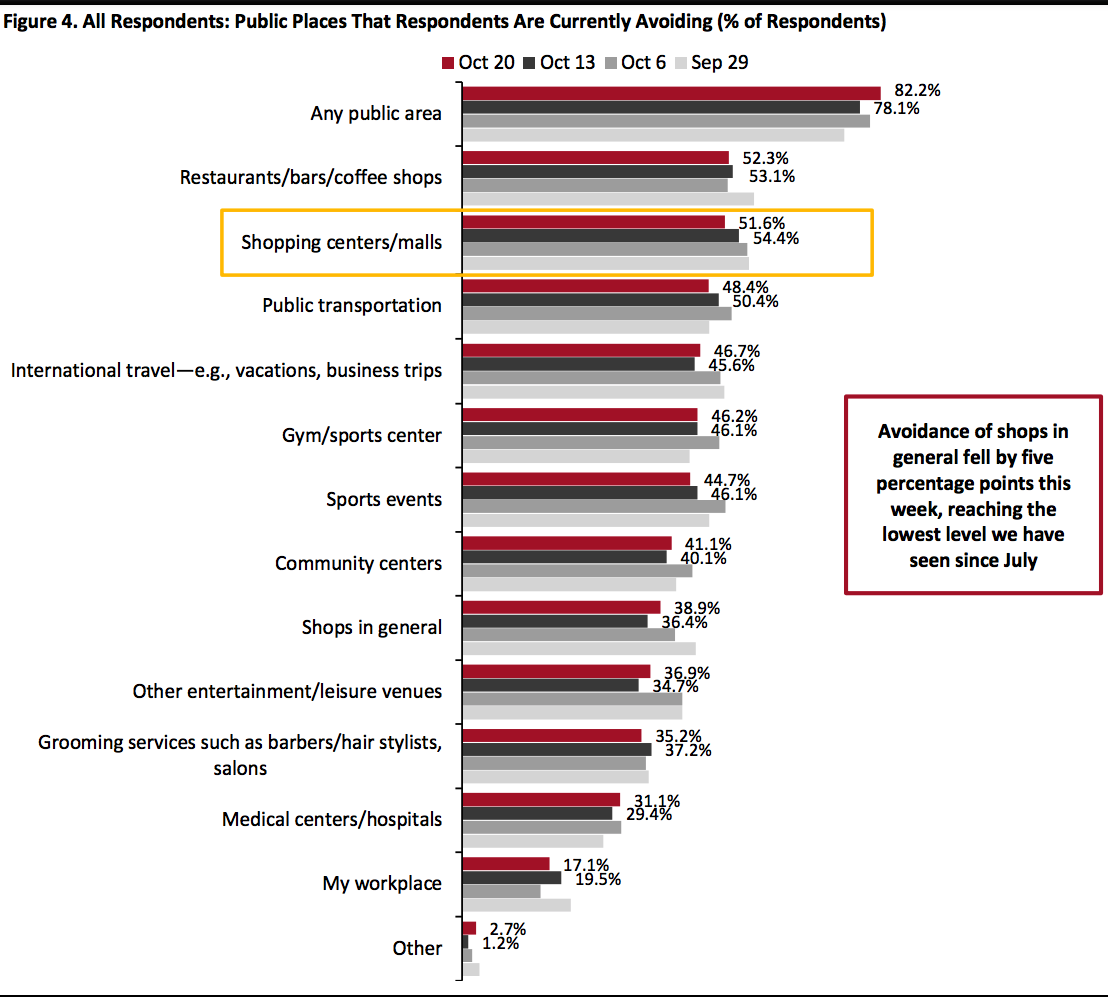
Source: Coresight Research[/caption] Over Eight in 10 Are Currently Avoiding Public Places We have seen fluctuations in the avoidance rate of public places in the past couple of weeks. This week, the proportion of respondents saying that they are avoiding any type of public area went above 80%: Some 82.2% are avoiding public places, the highest in the past two months, versus 78.1% last week. We still saw slight decreases in avoidance for five of the 12 options provided, although all changes were within the margin of error.
- The proportion of respondents that are currently avoiding shopping centers/malls fell for the fourth consecutive week (changes were within the margin of error) to a new low. Some 51.6% are currently avoiding such places, compared to 54.4% last week. In terms of ranking, shopping centers became the second-most-avoided public places, following food-service locations. The avoidance rate of shopping malls/centers has decreased by almost seven percentage points from a month ago and 15 percentage points from the peak of two-thirds on July 22.
- Avoidance of shops in general bounced back a little after reaching the lowest level last week, but still remained below 40%. Some 38.9% are currently avoiding such places, compared to 36.4% last week.
 Respondents could select multiple options
Base: US respondents aged 18+
Source: Coresight Research[/caption]
Reviewing Trend Data in Current Purchasing Behavior
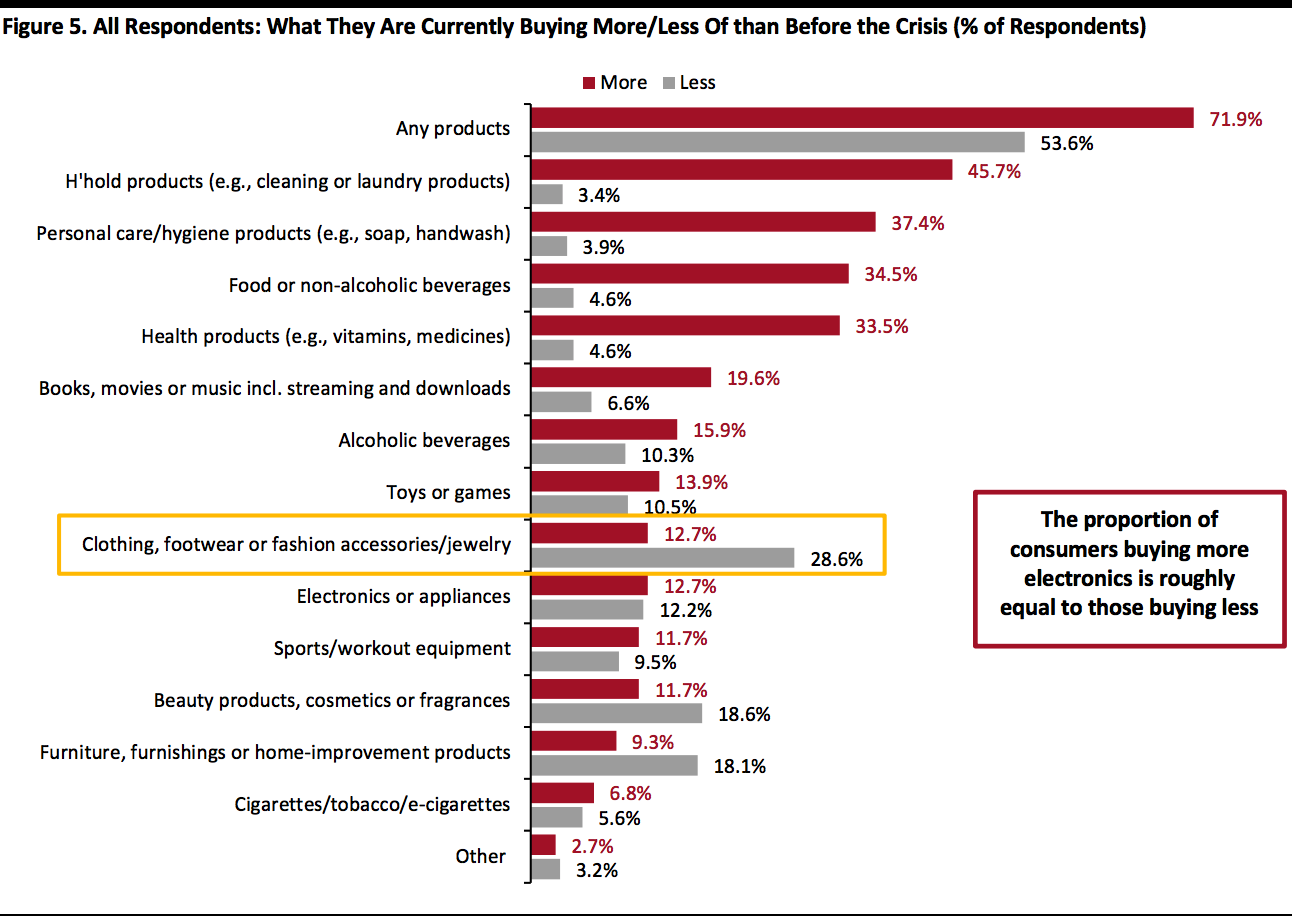
What Consumers Are Currently Buying More Of and Less Of This week, the proportion of respondents that are currently buying more of any products than before the crisis jumped by eight percentage points, to 71.9%. The proportion of respondents that are currently buying less than pre-crisis also went up slightly to 53.6%, from 49.9% last week.- Buying more of certain categories and buying less of certain categories were not mutually exclusive options, so respondents could answer yes to both.
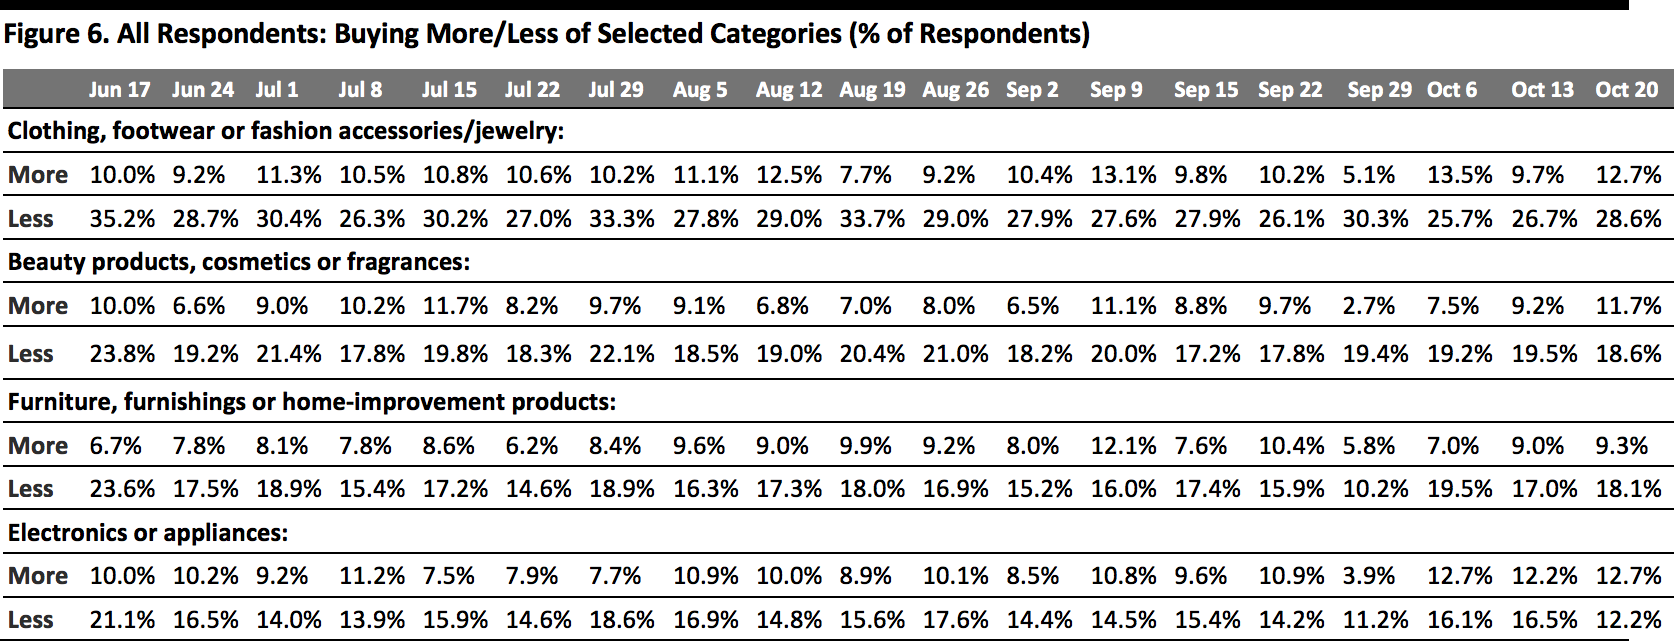
- The ratio for clothing and footwear fell to 2.3, from 2.7 last week.
- The ratio for beauty fell to its lowest this week, at 1.6, versus 2.1 last week and 2.6 two weeks before.
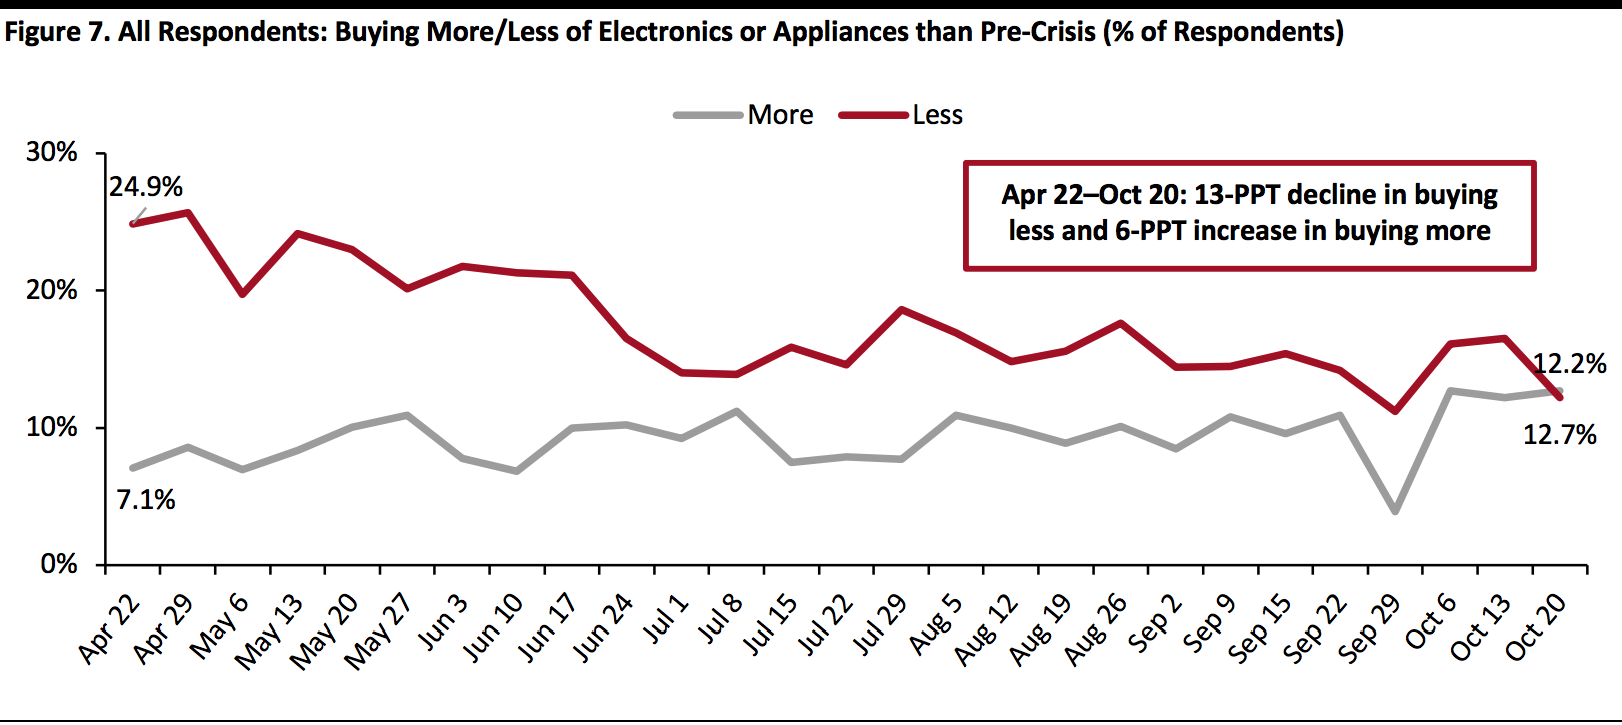
- The ratio for electronics also dropped to a new low at 1.0 (i.e., roughly equal levels), from 1.3 last week. For the first time, the proportion that are buying more in electronics than pre-crisis exceeded those that are buying less, although only by very little. We charted the trended data in Figure 7. The recent uptick in electronics shopping could have been driven by promotional events such as Amazon’s Prime Day, as electronics is a key category on Prime Day.
- The ratio for home stayed consistent week over week at 1.9.
 Respondents could select multiple options
Base: US respondents aged 18+
Source: Coresight Research[/caption] [caption id="attachment_118126" align="aligncenter" width="700"]
 Base: US respondents aged 18+
Source: Coresight Research[/caption] [caption id="attachment_118127" align="aligncenter" width="700"]
 Base: US respondents aged 18+
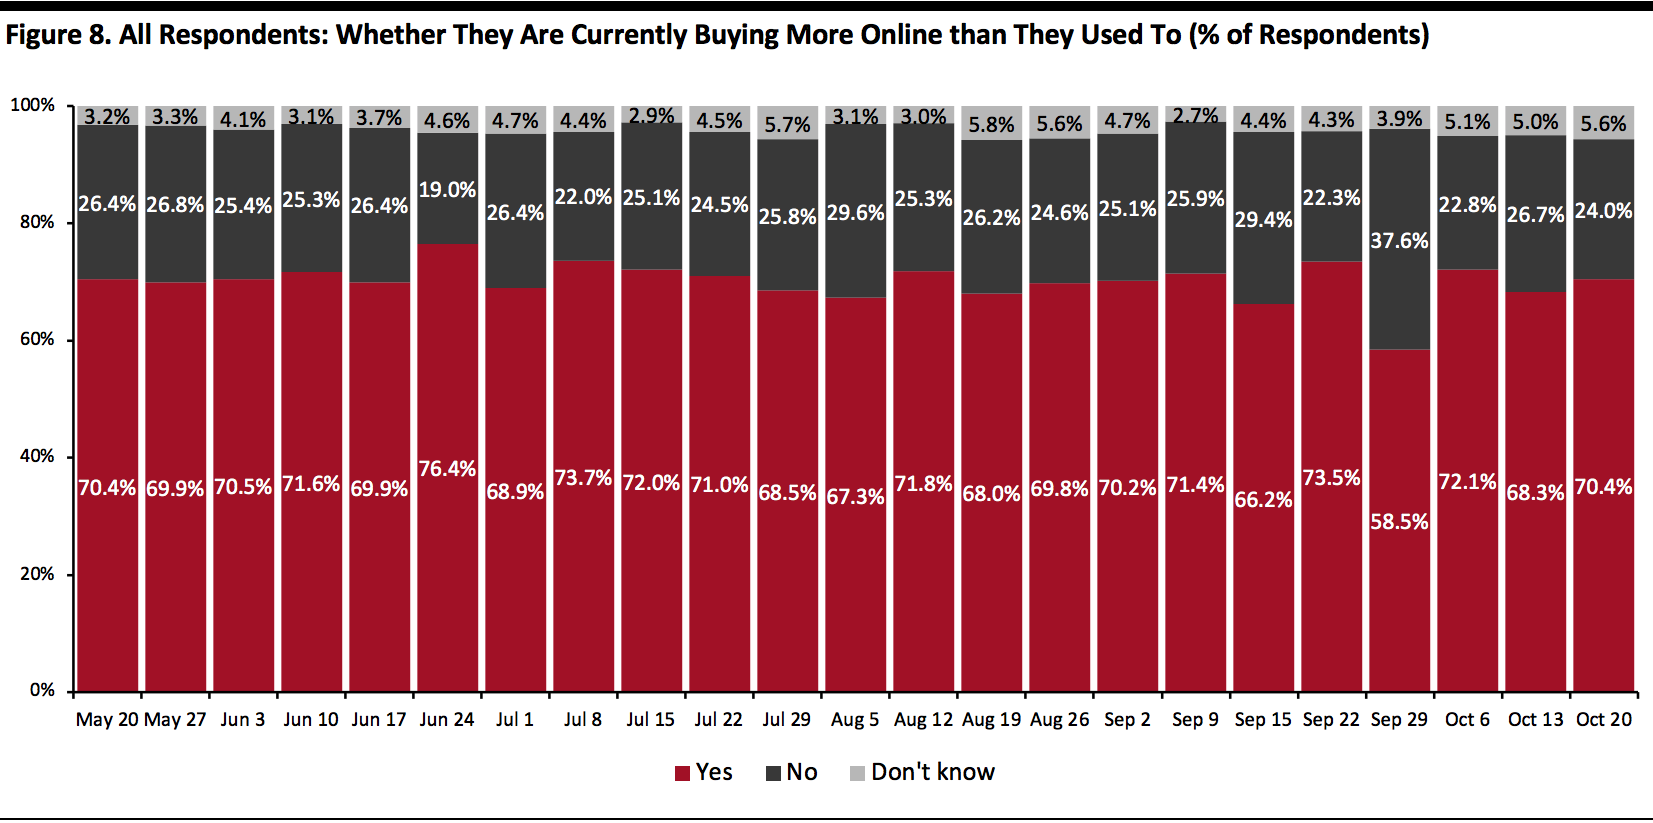
Source: Coresight Research[/caption] Seven in 10 Are Switching Spending Online The proportion of consumers buying more online than they used to became fairly stable in recent weeks after fluctuating in September. This week, the proportion stood at 70.4%, compared to 68.3% last week. [caption id="attachment_118128" align="aligncenter" width="700"]
 Base: US respondents aged 18+
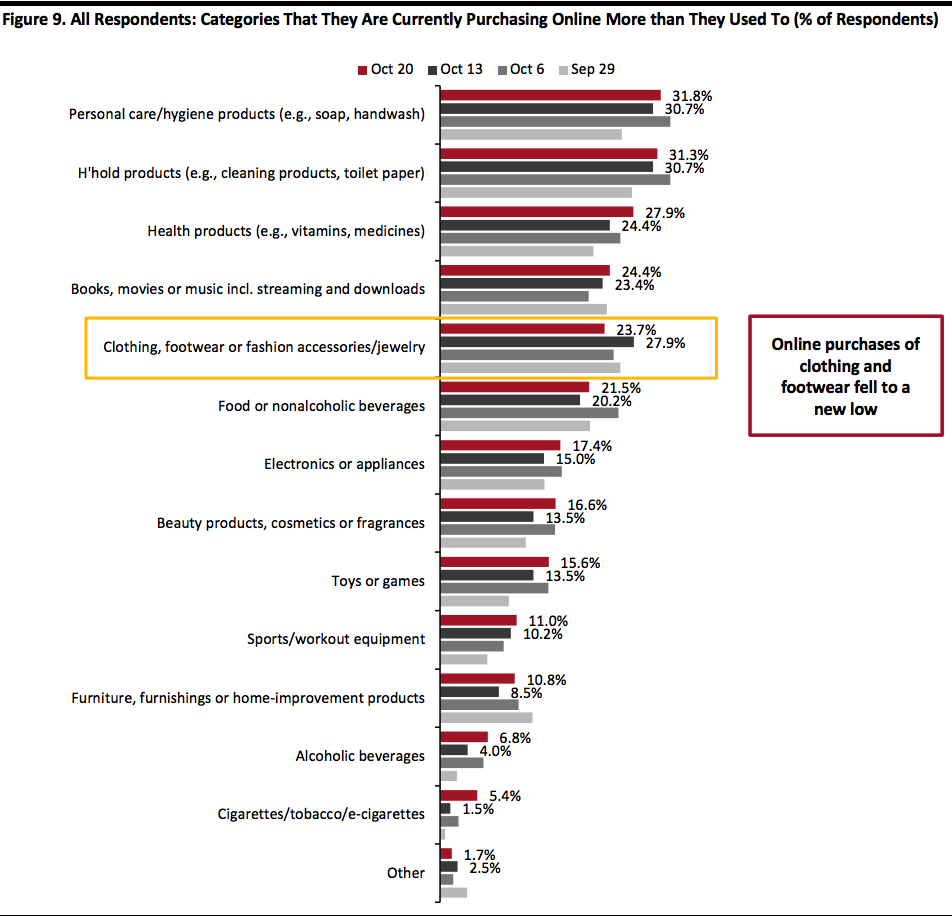
Source: Coresight Research[/caption] What Consumers Are Currently Buying More Of Online Looking at specific categories, 10 of the 13 categories we provided as options saw week-over-week increases in consumers buying more online than pre-crisis, although all of the changes were within the margin of error. Household products and personal care remained the most-purchased categories online. Some 27.9% are buying more health products online than they used to, the highest level we have seen since April. Online purchases of food returned to the level we saw four weeks ago, at 21.5%, compared to one-fifth last week. The proportion of respondents that are currently buying more clothing and footwear online decreased to its lowest level since July, aligned with the decline of consumers buying apparel online in the past two weeks, discussed earlier in the report. Some 23.7% are buying more in this category online, versus 27.9% last week. Compared to the peak of 31.4% on July 22, the proportion slid by almost eight percentage points. Online purchases of other discretionary categories, including home, electronics and beauty, all increased slightly. [caption id="attachment_118129" align="aligncenter" width="700"]
 Respondents could select multiple options
Base: US respondents aged 18+
Source: Coresight Research[/caption]
What We Think
This week, we saw the following from our recurring weekly questions:- Apparel: Clothing and footwear remained the most-cut category, with 28.6% of consumers currently buying less than pre-crisis. We saw the popularity of online apparel shopping wane this week: Some 28.4% had bought apparel online, down almost six percentage points from 33.9% last week. This is also the lowest level we have seen since June 17. In addition, the proportion of respondents that are currently buying more clothing, footwear or accessories online decreased to a new low since July to 23.7%. However, we did not see a shift to in-store shopping either; in-store apparel shopping in the past two weeks came in at 21.8%, versus 23.2% last week.
- Electronics: We saw improvement in electronics purchases this week: For the first time, the proportion of respondents that are buying more in electronics than pre-crisis exceeded those that are buying less, although only by very little. Compared to the level we saw six months ago, the proportion buying less in electronics has fallen 13 percentage points, and the proportion buying more has increased by almost six percentage points. The recent uptick could be driven by consumers shopping for electronics during promotional events such as Prime Day.
- Online Grocery: After fluctuating in the past couple of weeks, the proportion of respondents that had bought grocery online remained fairly stable this week, at around three in 10. Also, some 21.5% are currently buying more food online than before the pandemic, compared to one-fifth last week. For more data on the trajectory of grocery e-commerce, keep an eye out for our latest monthly US CPG Sales Tracker report.
- E-Commerce: The proportion of consumers that are currently buying more online than they used stood at seven in 10, versus 68.3% last week, despite an eight-percentage-point jump in the proportion that are buying more of certain products. We expect the level to remain elevated as we enter the holiday season, and we expect holiday-quarter sales to rise by around 31% year over year. See our Holiday 2020: US Shopper Survey for more data on consumers’ holiday shopping expectations, and the US E-Commerce: Post-Crisis Outlook report for more e-commerce data and analysis.