
albert Chan
What’s the Story?
This report presents the results of Coresight Research’s latest weekly survey of US consumers, including on the impacts of the coronavirus outbreak, undertaken on December 15. We explore the trends we are seeing from week to week, following prior surveys on December 8, December 1, November 24, November 17, November 10, November 3, October 27, October 20, October 13, October 6, September 29, September 22, September 15, September 9, September 2, August 26, August 19, August 12, August 5, July 29, July 22, July 15, July 8, July 1, June 24, June 17, June 10, June 3, May 27, May 20, May 13, May 6, April 29, April 22, April 15, April 8, April 1, March 25 and March 17–18.
What Shoppers Are Doing and Where They Are Going
More Consumers Had Bought Apparel Online and In-Store in the Past Two Weeks
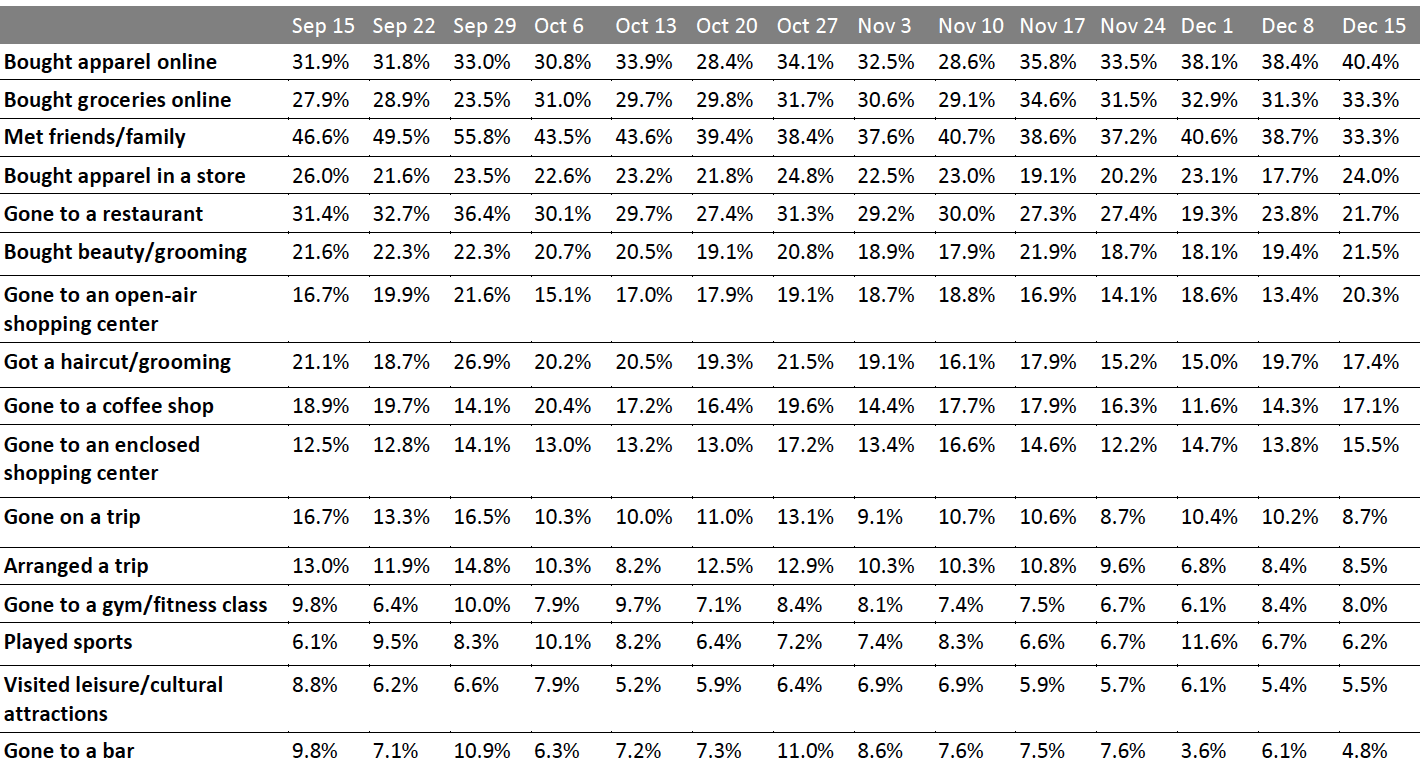
Each week, we ask consumers what they have done in the past two weeks. This week, the proportion of respondents slightly increased for seven of the 16 options we provided for recent activities. Some of the week-over-week changes were within the margin of error; however, the directional trends, including over a number of weeks, can prove informative.
With Christmas Day imminent, we saw that consumers had done more shopping activities, both online and in-store, compared to last week:
- Online apparel shopping continued its momentum this week: Some 40.4% of respondents reported that they had bought clothing, footwear or accessories online, versus 38.4% last week. This is the highest level we have seen since we started asking this question in June; this week, online apparel shopping became the top activity consumers had done in the past two weeks. By age, we saw participation in this activity peak at 42.9% among the youngest consumer group and decline by age thereafter (see Figure 2). The elevated level of online apparel purchases in the prior weeks is aligned with our holiday survey results, which showed clothing and footwear to be the number-one category for holiday gifting.
- In-store apparel shopping also rebounded after falling last week to the lowest level since September. Some 24.0% had bought apparel in-store, up six percentage points from 17.7% last week. By age, consumers aged 45–60 were more willing to buy apparel in-store, compared to other age groups.
- Visits to both open-air and enclosed shopping centers increased week over week. One-fifth had gone to an open-air shopping center, up seven percentage points from 13.4% last week and the highest proportion we have seen since October. The proportion of respondents that had gone to an enclosed shopping center went up slightly to 15.5%, from 13.8% last week. However, these percentages are still considered low, as avoidance of such locations remained high, which we discuss later in the report.
- We have seen slight fluctuations in the proportions of consumers that had dined in a restaurant and had bought groceries online. This week, slightly fewer consumers had gone to a restaurant (21.7%), while more had bought groceries online (33.3%), compared to last week.
Figure 1. All Respondents: What They Have Done in the Past Two Weeks (% of Respondents) [caption id="attachment_121015" align="aligncenter" width="700"]
 Respondents could select multiple options
Base: US respondents aged 18+
Source: Coresight Research[/caption]
Figure 2. All Respondents: Proportions That Had Bought Clothing, Footwear or Accessories Online and in a Store (% of Respondents)
[caption id="attachment_121017" align="aligncenter" width="700"]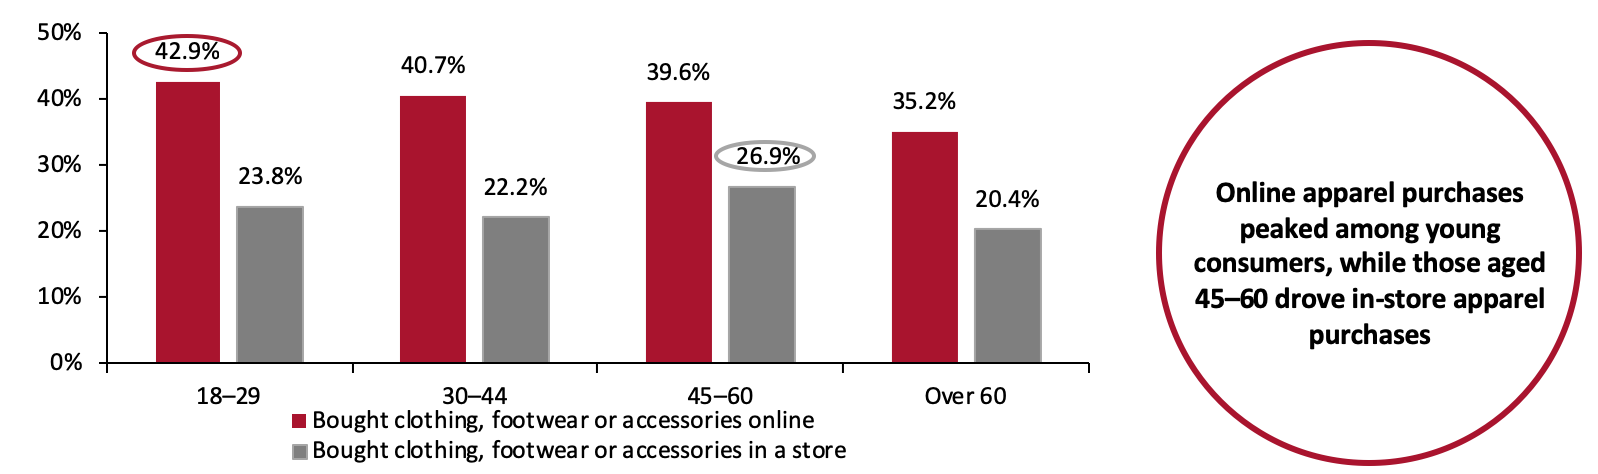 Base: US respondents aged 18+
Source: Coresight Research[/caption]
Slightly More Consumers Expect To Go on a Trip than Actual Behavior Indicates
Each week, we also ask consumers what they expect to do in the next two weeks, with a set of options comparable to those for the last two weeks. In Figure 3, we compare these short-term expectations with recent actual behavior.
We saw slightly lower proportions of consumers expecting to do 10 of the 16 options that we provided for activities in the next two weeks than actual behavior in the past two weeks.
For the next two weeks, expectations to go on a trip exceeded recent actual behavior:
- Some 12.3% said they plan to go on a trip, including to visit family and go on vacation, as Christmas Day and the New Year holiday take place in the next two weeks. This is nearly four percentage points higher than the proportion of consumers that indicated they went on a trip in the last two weeks (8.7%).
- Online grocery shopping continued to be the top spending-related activity that consumers expect to do in the next two weeks, although with a slightly lower proportion than recent actual behavior.
- The proportion of respondents that expect to buy clothing or footwear online came in at 24.2%, slightly lower than the 26.1% last week. Expectations to purchase apparel in-store also fell back slightly week over week: Some 16.9% of respondents plan to buy apparel in a store in the next two weeks, versus 18.4% that reported the same last week. Based on past survey results, we expect to see higher proportions in actual behavior than expected levels next week for both metrics.
Figure 3. All Respondents: What They Have Done in the Past Two Weeks and Expect To Do in the Next Two Weeks (% of Respondents)
[caption id="attachment_121018" align="aligncenter" width="700"]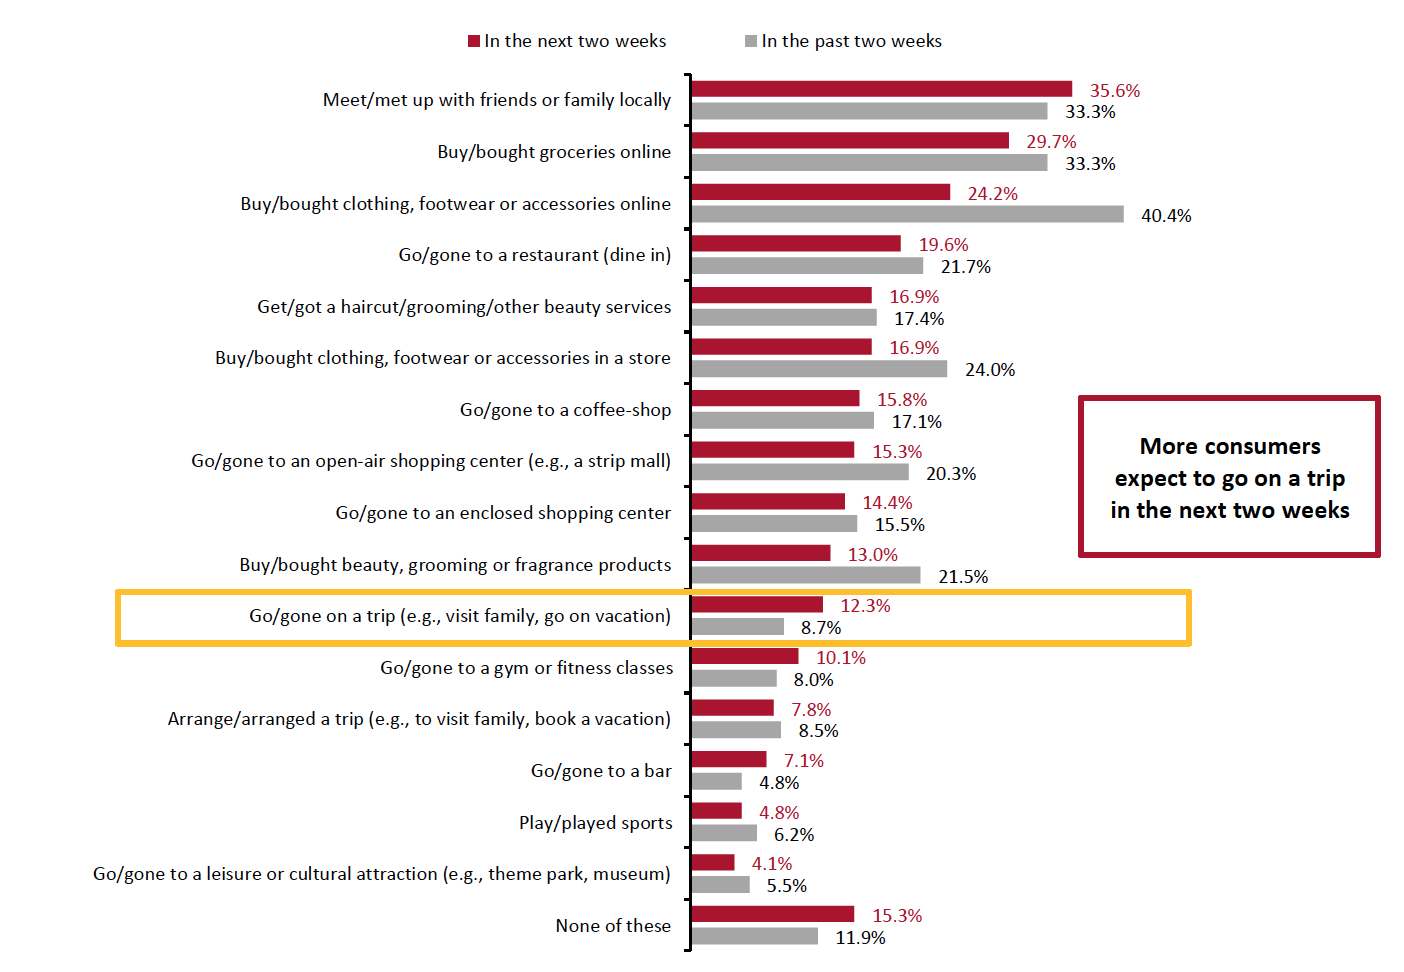 Respondents could select multiple options
Base: US respondents aged 18+
Source: Coresight Research[/caption]
Eight in 10 Are Currently Avoiding Public Places
This week, the avoidance rate of any type of public area stood at 80.8%, versus 83.8% last week. Although the avoidance rate remained high, we have seen a slight downward trend in December. This week, we saw week-over-week decreases in avoidance for four of the 13 options provided, although all changes were within the margin of error.
Avoidance of retail locations remained high, and avoidance of food-service locations jumped again this week:
- The proportion of respondents that are currently avoiding shopping centers/malls was broadly level with last week, at 58.4%. We have seen a consistent proportion of roughly 58% in avoidance of shopping centers/malls in the past few weeks.
- Avoidance of shops in general stood at 45.7%, versus 43.8% last week; this is the highest level we have seen since October.
- Food-service locations saw a week-over-week bounceback of avoidance, from 56.8% last week to 59.6% this week—roughly the same proportion as two weeks ago. Food-service locations again became the most-avoided public places this week.
Figure 4. All Respondents: Public Places That Respondents Are Currently Avoiding (% of Respondents)
[caption id="attachment_121019" align="aligncenter" width="700"]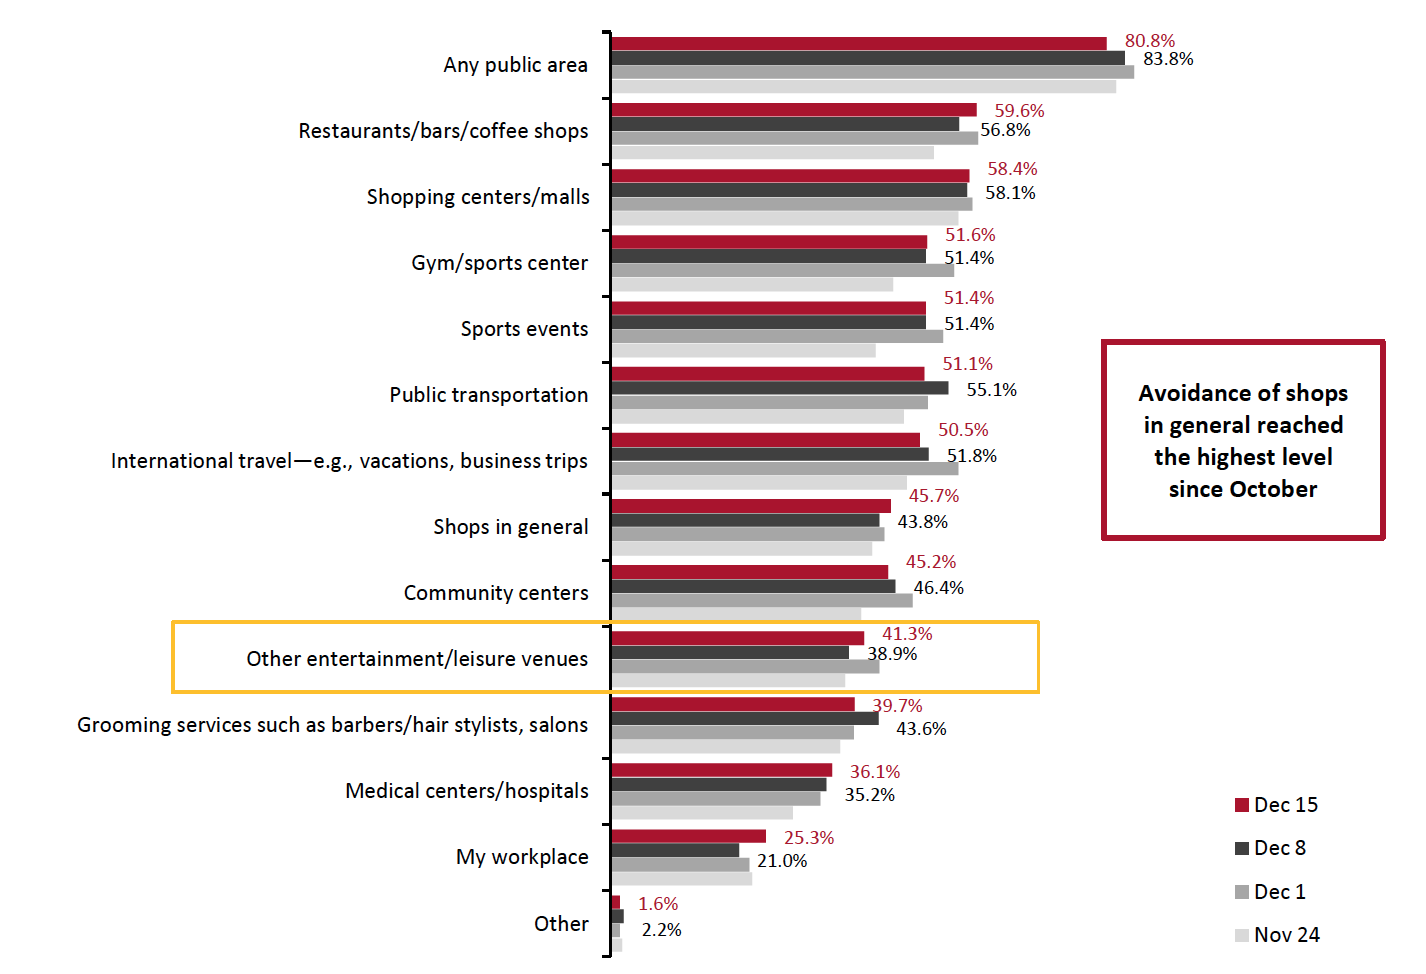 Respondents could select multiple options
Base: US respondents aged 18+
Source: Coresight Research[/caption]
Reviewing Trend Data in Current Purchasing Behavior
What Consumers Are Currently Buying More Of and Less Of
We have seen a stable proportion of consumers currently buying more of any type of product in recent weeks, at 65%. The proportion of respondents that are currently buying less of any product than pre-crisis came in at 49.8%, compared to 53.4% last week.
- Buying more in any category and buying less in any category were not mutually exclusive options, so respondents could answer yes to both.
Buying more: Essentials—including food, health, household and personal care products—continued to be the most-purchased categories, with the proportion of consumers buying more in all, except household products, declining week over week. Some 44.1% are buying more household products than pre-crisis, up from four in 10 last week. On the other hand, personal care and health products both saw a decrease of seven percentage points week over week.
Demand for some discretionary products including clothing and footwear, home and electronics was broadly level with last week. The proportion of consumers buying more beauty products than pre-crisis fell this week to the level we saw two weeks ago.
Buying less: The proportions that are buying less in beauty, home and electronics remained relatively stable week over week, while clothing and footwear saw slight decreases in consumers buying less than pre-crisis.
Ratio of less to more: The ratios of the proportion of respondents buying less to the proportion buying more in three of the four discretionary categories tracked in Figure 6 (not beauty) decreased week over week.
- The ratio for clothing and footwear stood at 2.2, down from 2.4 last week.
- The ratio for electronics slid to 1.1, from 1.2 last week.
- The ratio for the home category went down to 1.8, from 2.1 last week.
- The ratio for beauty returned to the level we saw two weeks ago at 1.9, versus 1.6 last week.
Figure 5. All Respondents: What They Are Currently Buying More/Less Of Due to the Coronavirus Outbreak (% of Respondents)
[caption id="attachment_121020" align="aligncenter" width="700"]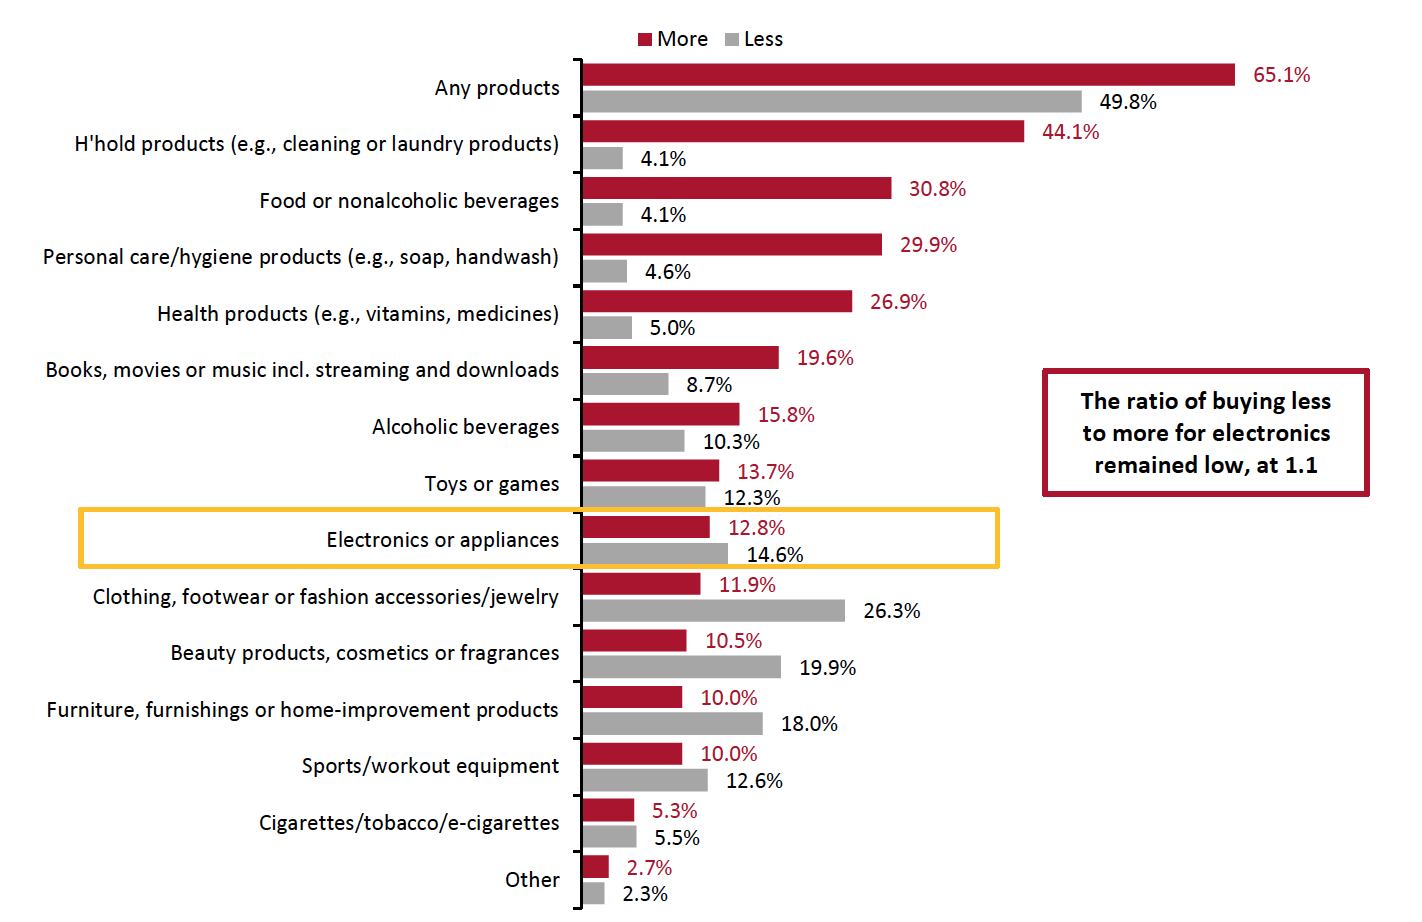 Respondents could select multiple options
Base: US respondents aged 18+
Source: Coresight Research[/caption]
Figure 6. All Respondents: Buying More/Less of Selected Categories (% of Respondents)
[caption id="attachment_121021" align="aligncenter" width="700"]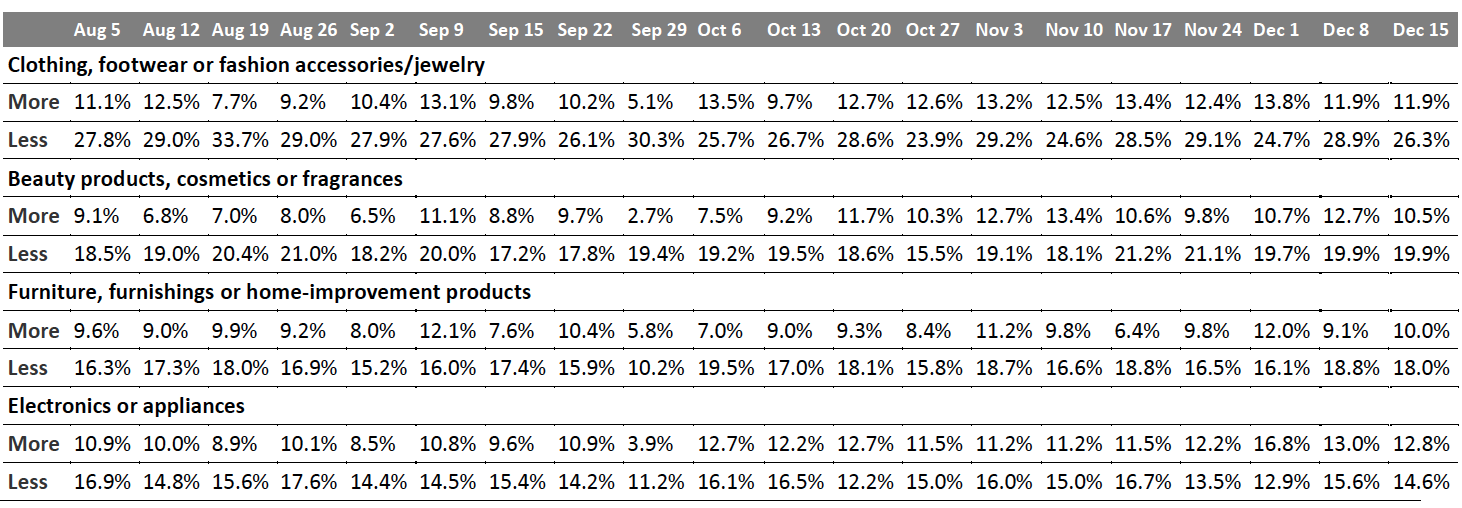 Base: US respondents aged 18+
Source: Coresight Research[/caption]
Over Seven in 10 Are Switching Spending Online
The proportion of consumers buying more online than they used to came in at 72.4% this week, down almost five percentage points from the record high of 77.1% last week. Although the proportion declined this week, we have seen a consistent e-commerce level of over 70% since November, reflecting the solid demand for online shopping this holiday season.
Figure 7. All Respondents: Whether They Are Currently Buying More Online than They Used To (% of Respondents)
[caption id="attachment_121022" align="aligncenter" width="700"]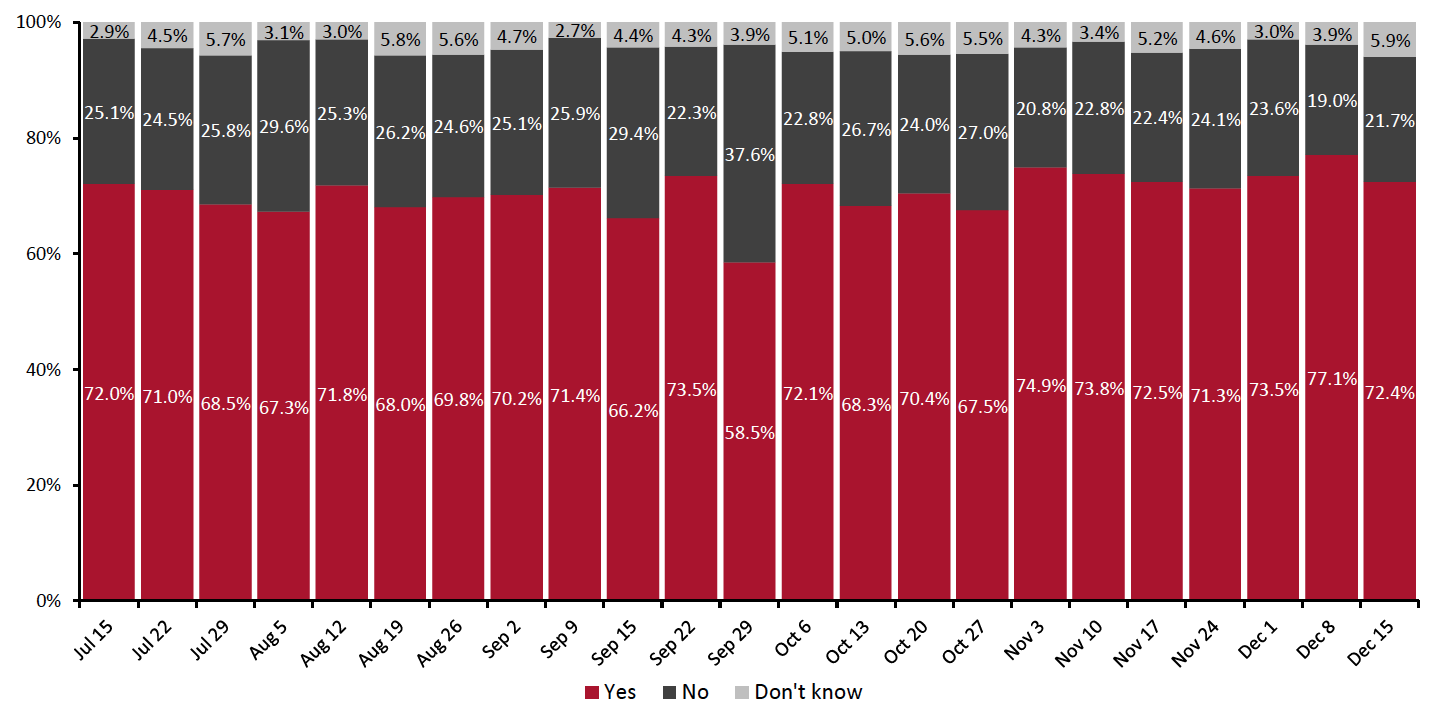 Base: US respondents aged 18+
Source: Coresight Research[/caption]
What Consumers Are Currently Buying More Of Online
Looking at specific categories, four of the 13 options we provided saw week-over-week decreases in consumers buying more online than pre-crisis, although most of the changes were within the margin of error.
Household and personal care products were the most-purchased products online: Some 34.5% are buying more personal care products online; and one-third are buying more household products online than they used to. The proportion of consumers buying more food online than they used to fell again this week to 24.2%, from 26.6% last week and the record high of 28.8% two weeks ago.
Among discretionary categories, toys or games saw the largest week-over-week decline of five percentage points, to 16.4% this week. The proportion of consumers buying more clothing and footwear than pre-crisis went up slightly to three in 10, in line with the increasing level of consumers who had bought apparel online in the past two weeks, which we discussed earlier. Online purchases of electronics fell back a little after an upward trend in the past few weeks.
Figure 8. All Respondents: Categories That They Are Currently Purchasing Online More than They Used To (% of Respondents)
[caption id="attachment_121023" align="aligncenter" width="700"]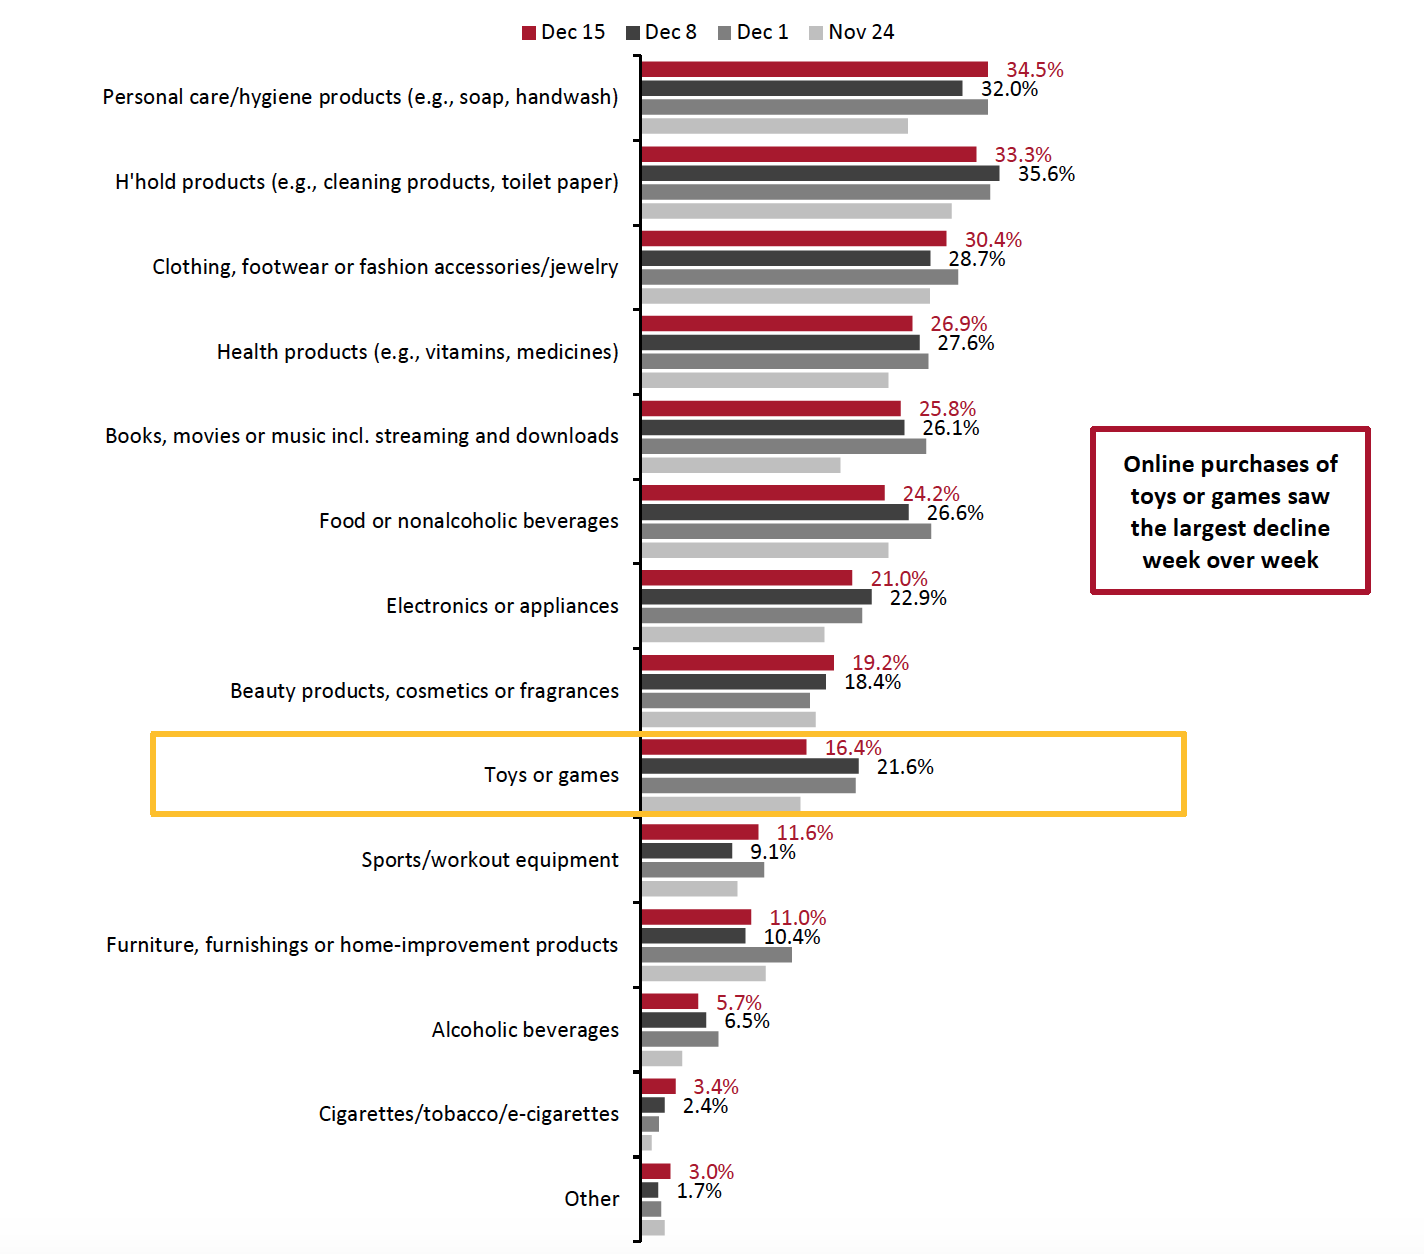 Respondents could select multiple options
Base: US respondents aged 18+
Source: Coresight Research[/caption]
Almost Half Expect To Retain Changed Behaviors in the Long Term
We asked respondents whether they think they will keep some of the behaviors they have adopted during the coronavirus crisis in the long term. Some 48.2% of respondents expect to retain some changed behaviors this week, the lowest level since we started asking this question in late March, suggesting that consumers are more willing to return to their regular activities than previously expected.
Figure 9. All Respondents: Expectation To Behave Differently/Retain Changed Way of Living in the Long Term (% of Respondents)
[caption id="attachment_121024" align="aligncenter" width="700"]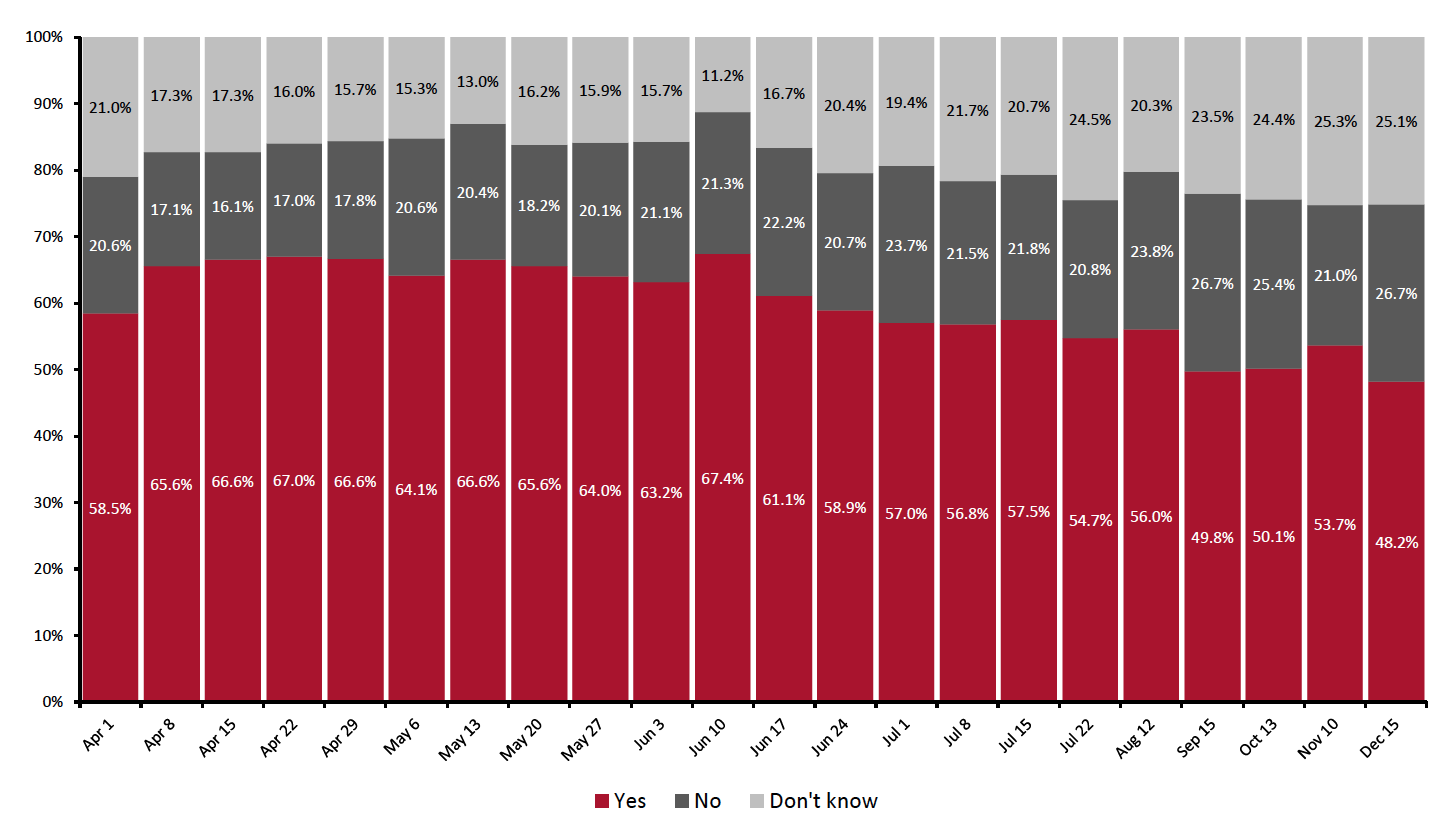 Question not asked on July 29, August 5, August 19, August 26, September 2, September 9, September 15, September 22, September 29, October 6, October 20, October 27, November 3, November 17, November 24, December 1 or December 8
Base: US respondents aged 18+
Source: Coresight Research[/caption]
We saw declines in the proportions of all respondents selecting seven of the 11 behavior options we provided, compared to a month earlier, although most changes were within the margin of error.
Having more food/supplies witnessed the largest month-over-month decrease, of eight percentage points, to 16.9%—the lowest level we have seen. Having more hygienic practices, which has always been the top behavior that consumers expect to retain in the long term, declined from 29.3% to one-quarter this week, and its ranking also fell to second place (see Figure 10).
The proportion of respondents expecting to use contactless payment options in stores more often than they did previously stood at one-fifth, compared to 22.8% last month.
Figure 10. All Respondents: What Changed Behaviors They Expect To Retain (% of Respondents)
[caption id="attachment_121025" align="aligncenter" width="700"]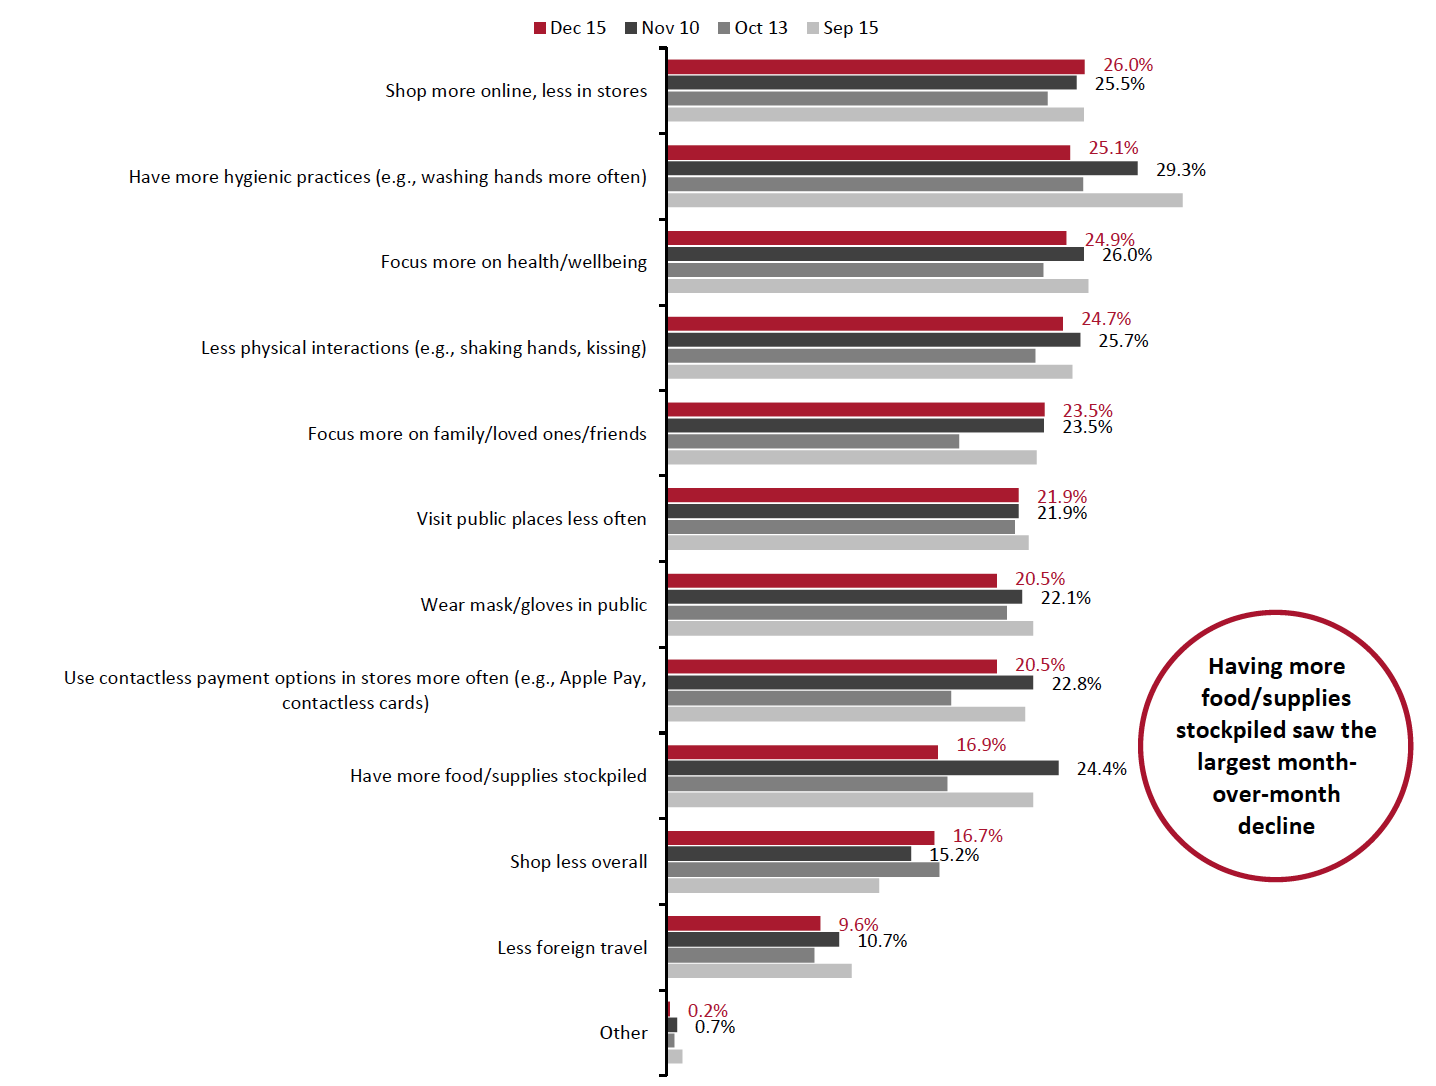 Respondents could select multiple options
Base: US respondents aged 18+
Source: Coresight Research[/caption]
In the chart below, we show trended data in three of the metrics charted above, and the medium-term trends suggest increasing intentions to return to more normal ways of living and shopping, with all three metrics appearing to be past their peak:
- Some 26.0% of respondents expect to shop more online, less in stores in the long term, leveled with that in last month. This behavior has trended downward since peaking at almost 30% of respondents in early June, although with some fluctuations. “Shop more online, less in stores” had the highest proportion of consumers saying they expect to retain such behavior this week, compared to other options. It also has the smallest difference between its peak and this week’s level, making it the most likely behavior to be retained in the long term.
- The proportion that expect to visit public places less often remained unchanged month over month. Some 21.9% plan to retain this behavior—representing a decline of 12 percentage points from the peak of 34.3% on June 17.
- The proportion of consumers expecting to retain the behavior of shopping less overall returned to the level we saw two months ago, at around 17%. The medium-term trend still looks to be downward, which is encouraging for the retail industry.
Figure 11. All Respondents: Selected Behaviors They Expect To Retain (% of Respondents)
[caption id="attachment_121026" align="aligncenter" width="700"]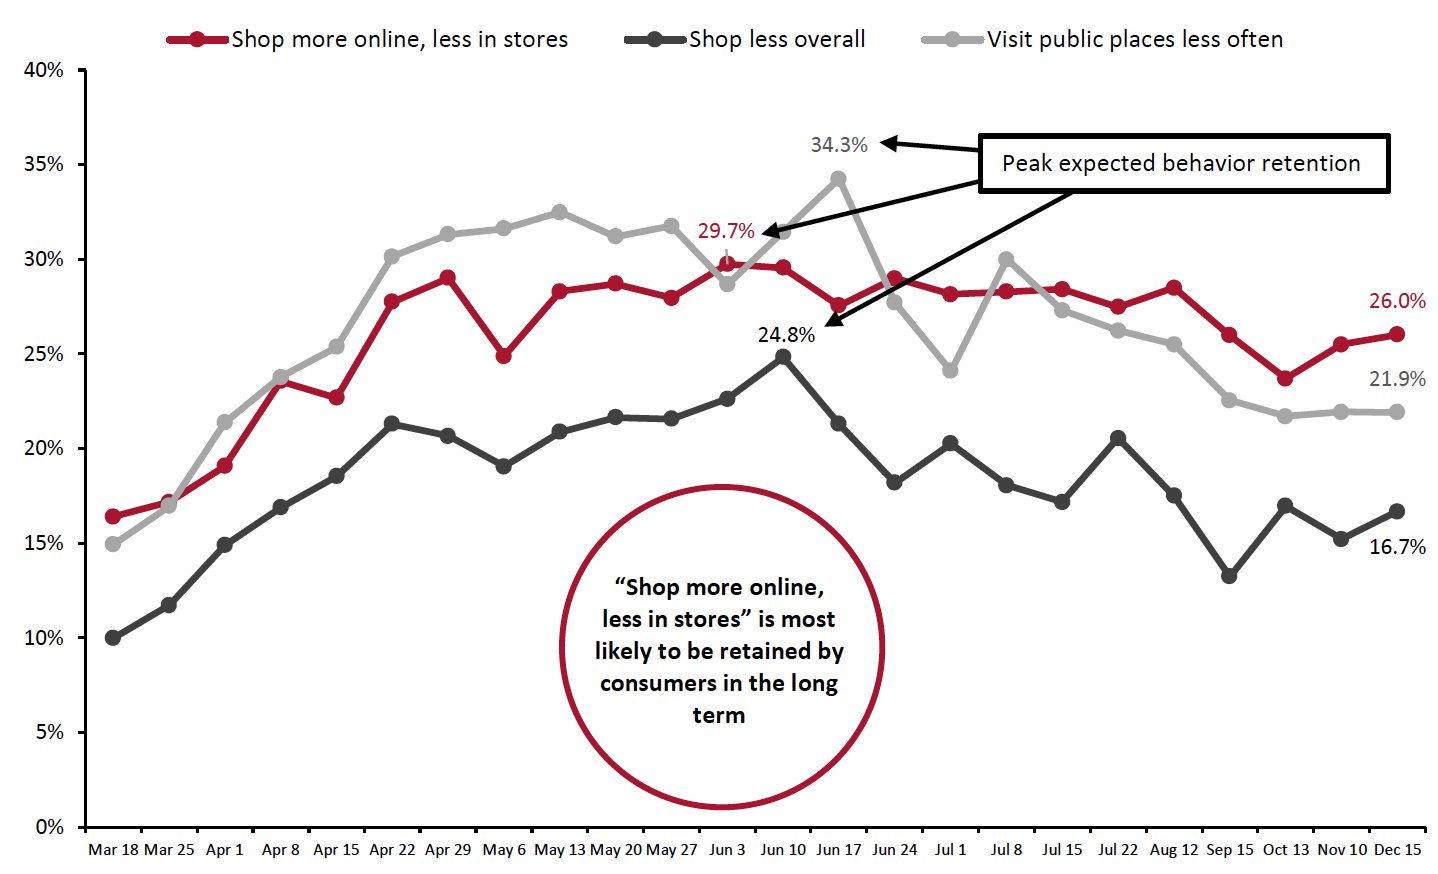 Question not asked on July 29, August 5, August 19, August 26, September 2, September 9, September 15, September 22, September 29, October 6, October 20, October 27, November 3, November 17, November 24, December 1 or December 8
Base: US respondents aged 18+
Source: Coresight Research[/caption]
What We Think
This week, we saw the following from our recurring weekly questions:
- Apparel: We saw apparel purchases improve again this week, as we head into the holiday homestretch. The ratio of buying less to more than pre-crisis for apparel fell week over week. Apparel purchases were still made largely online, although both channels saw week-over-week increases: Four in 10 respondents reported that they had bought apparel online in the past two weeks—the highest level since we started asking this question in June; and in-store apparel purchases increased by six percentage points to 24.0% this week.
- Online Grocery: Showing great resilience, it looks like this trend is here to stay. This week, the proportion of shoppers that had bought groceries online stood at one-third, versus 31.3% last week. Looking at the metrics since October, we see a consistent trend of roughly 30% having bought groceries online in the latest two-week period. This supports our expectation of 60+% year-over-year growth in online food sales during the holiday period. Our latest monthly US CPG Sales Tracker recorded an upward trend in year-over-year growth rates of online food sales.
- E-Commerce: Over the past few weeks, we have seen a consistent proportion of over 70% of consumers buying more online than they used to. This week, the proportion of consumers buying more online than they used to declined to 72.4% from the record high of 77.1% last week. Since November, we have seen a consistent proportion of 70% buying more online, possibly supported by the holiday season shopping. We expect total online sales to climb by around one-third in the holiday season. In the long term, “shop more online, less in stores” is also the top behavior that consumers expect to retain post crisis (26% of respondents). Read Our Predictions for a Digital December report for analysis of recent traffic trends and online sales during holiday 2020. Read our US E-Commerce: Post-Crisis Outlook report for more e-commerce data and analysis.
Methodology
We surveyed respondents online on December 15 (438 respondents), December 8 (463 respondents), December 1 (441 respondents), November 24 (460 respondents), November 17 (425 respondents), November 10 (447 respondents), November 3 (418 respondents), October 27 (419 respondents), October 20 (409 respondents), October 13 (401 respondents), October 6 (416 respondents), September 29 (412 respondents), September 22 (422 respondents), September 15 (408 respondents), September 9 (406 respondents), September 2 (402 respondents), August 26 (414 respondents), August 19 (416 respondents), August 12 (400 respondents), August 5 (449 respondents), July 29 (403 respondents), July 22 (404 respondents), July 15 (454 respondents), July 8 (410 respondents), July 1 (444 respondents), June 24 (411 respondents), June 17 (432 respondents), June 10 (423 respondents), June 3 (464 respondents), May 27 (422 respondents), May 20 (439 respondents), May 13 (431 respondents), May 6 (446 respondents), April 29 (479 respondents), April 22 (418 respondents), April 15 (410 respondents), April 8 (450 respondents), April 1 (477 respondents), March 25 (495 respondents) and March 17–18 (1,152 respondents). The most recent results have a margin of error of +/- 5%, with a 95% confidence interval. Not all charted week-over-week differences may be statistically significant.