
DIpil Das
What’s the Story?
This report presents the results of Coresight Research’s latest weekly survey of US consumers, including on the impacts of the coronavirus outbreak, undertaken on September 15, 2020. We explore the trends we are seeing from week to week, following prior surveys on September 9, September 2, August 26, August 19, August 12, August 5, July 29, July 22, July 15, July 8, July 1, June 24, June 17, June 10, June 3, May 27, May 20, May 13, May 6, April 29, April 22, April 15, April 8, April 1, March 25 and March 17–18.What Shoppers Are Doing and Where They Are Going
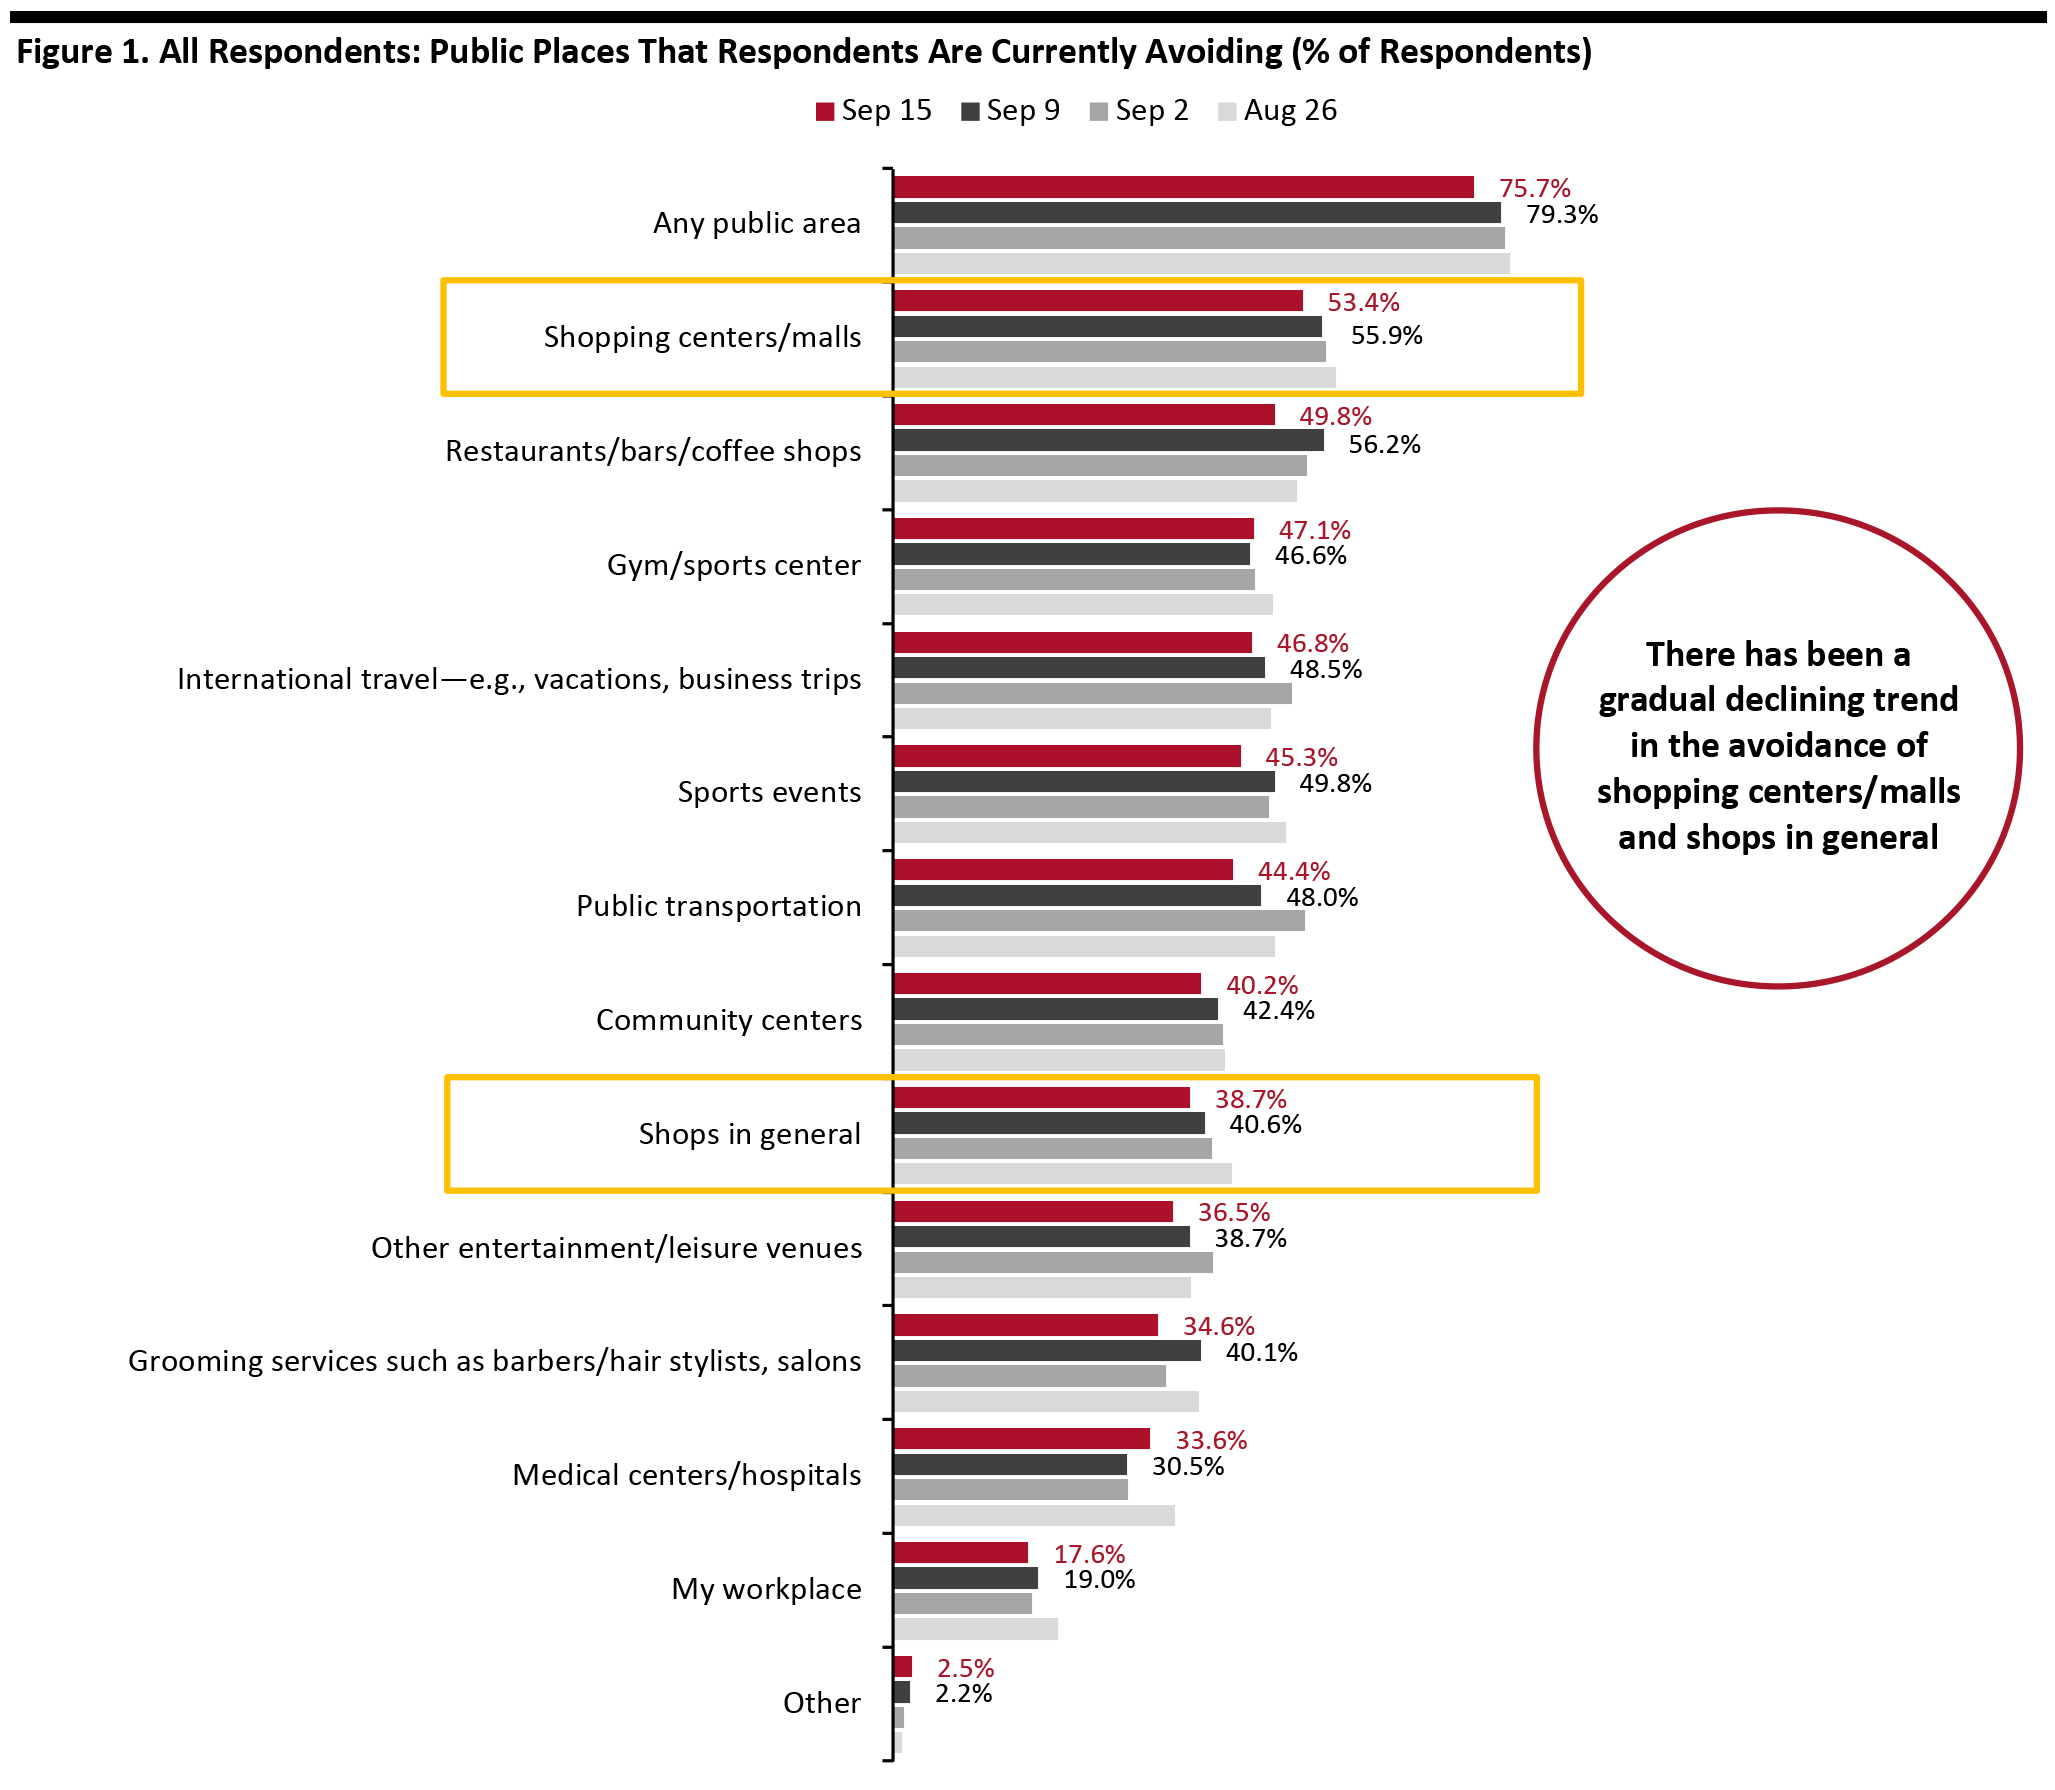
Three-Quarters Are Currently Avoiding Public Places This week, the proportion of respondents saying that they are avoiding any type of public area dropped to the lowest level we have seen since July: 75.7% are currently avoiding any public place, versus around 80% in the past few weeks. Encouragingly, we saw the decreases in avoidance for 10 of the 12 options provided, although most of the changes were within the margin of error.- The proportion of respondents that are currently avoiding shopping centers/malls fell for the fifth consecutive week, to the lowest level we have seen since July. Some 53.4% are currently avoiding such places, versus 55.9% last week, although that week-over-week change was within the margin of error. Compared to the peak of two-thirds on July 22, the avoidance rate has dropped by 13 percentage points.
- Avoidance of shops in general also went down below 40% for the first time since July; some 38.7% are currently avoiding such places. The avoidance rate has fallen 15 percentage points from the highest level of 53.5% on July 22. The gradual declines in avoidance of both shopping centers/malls and shops in general suggest a gradual return to in-store shopping.
- Food-service locations saw the largest decline in avoidance this week, with the rate reaching the lowest level since July. Half are currently avoiding restaurants, bars and coffee shops, down six percentage points from 56.2% last week.
 Respondents could select multiple options
 Base: US Internet users aged 18+
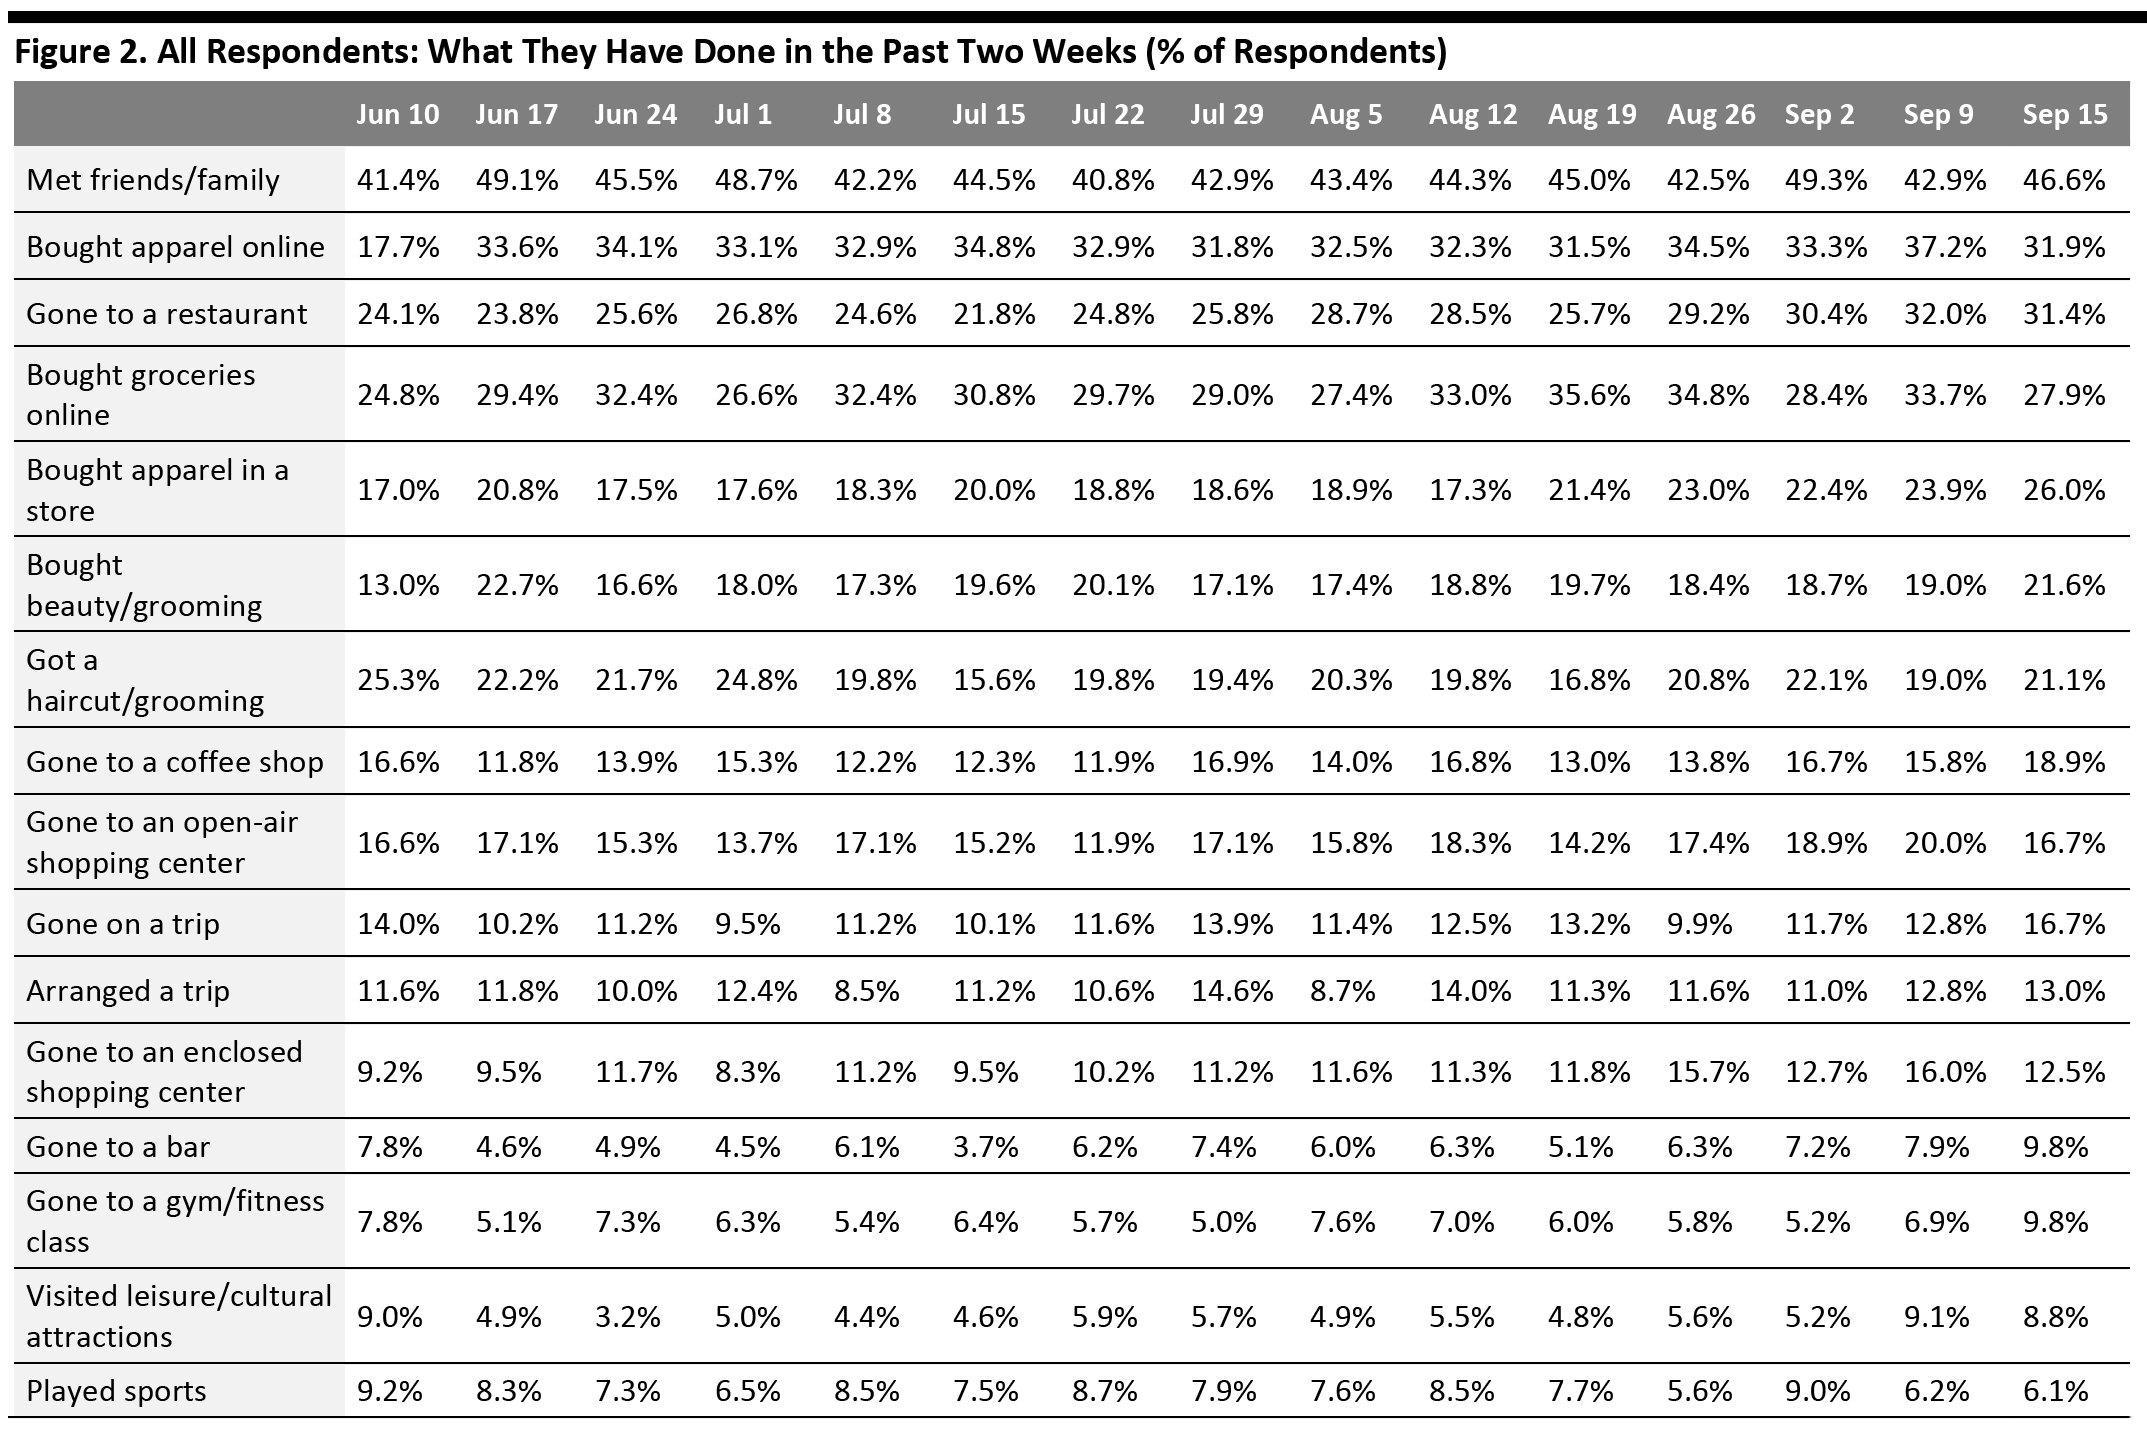
Source: Coresight Research [/caption] In-Store Apparel Shopping Reaches a New High This Week Each week, we ask consumers what they have done in the past two weeks. This week, the proportion of respondents increased for half of the 16 options we provided for recent activity options—although all changes were within the margin of error.
- Our survey suggests incremental channel shifts in clothing and footwear, with some spending returning to physical stores. Some 31.9% of respondents had bought apparel online in the past two weeks, decreasing by five percentage points from the highest level of 37.2% last week. By contrast, the proportion of respondents that had bought apparel in-store again reached a new high this week—some 26.0% had bought clothing or footwear in a store in the past two weeks. This proportion has increased by nine percentage points from when we first started asking this question. In addition, although online apparel shopping remained the top spending activity this week, the difference between the proportions that had done so online and in-store fell to the lowest level since June 17.
- We have seen a fluctuation in online grocery shopping activity in the past few weeks. This week, the proportion of respondents that bought groceries online dropped by almost six percentage points to 27.9%, from about one-third last week. The decline is aligned with the low level of consumers that are buying more food online than before the pandemic, which we discuss later in this report.
- The proportions of respondents that had visited open-air and enclosed shopping centers tapered off a little after reaching the highest levels last week. Some 16.7% had visited an open-air shopping center and 12.5% had visited an enclosed one.
 Respondents could select multiple options
 Base: US Internet users aged 18+
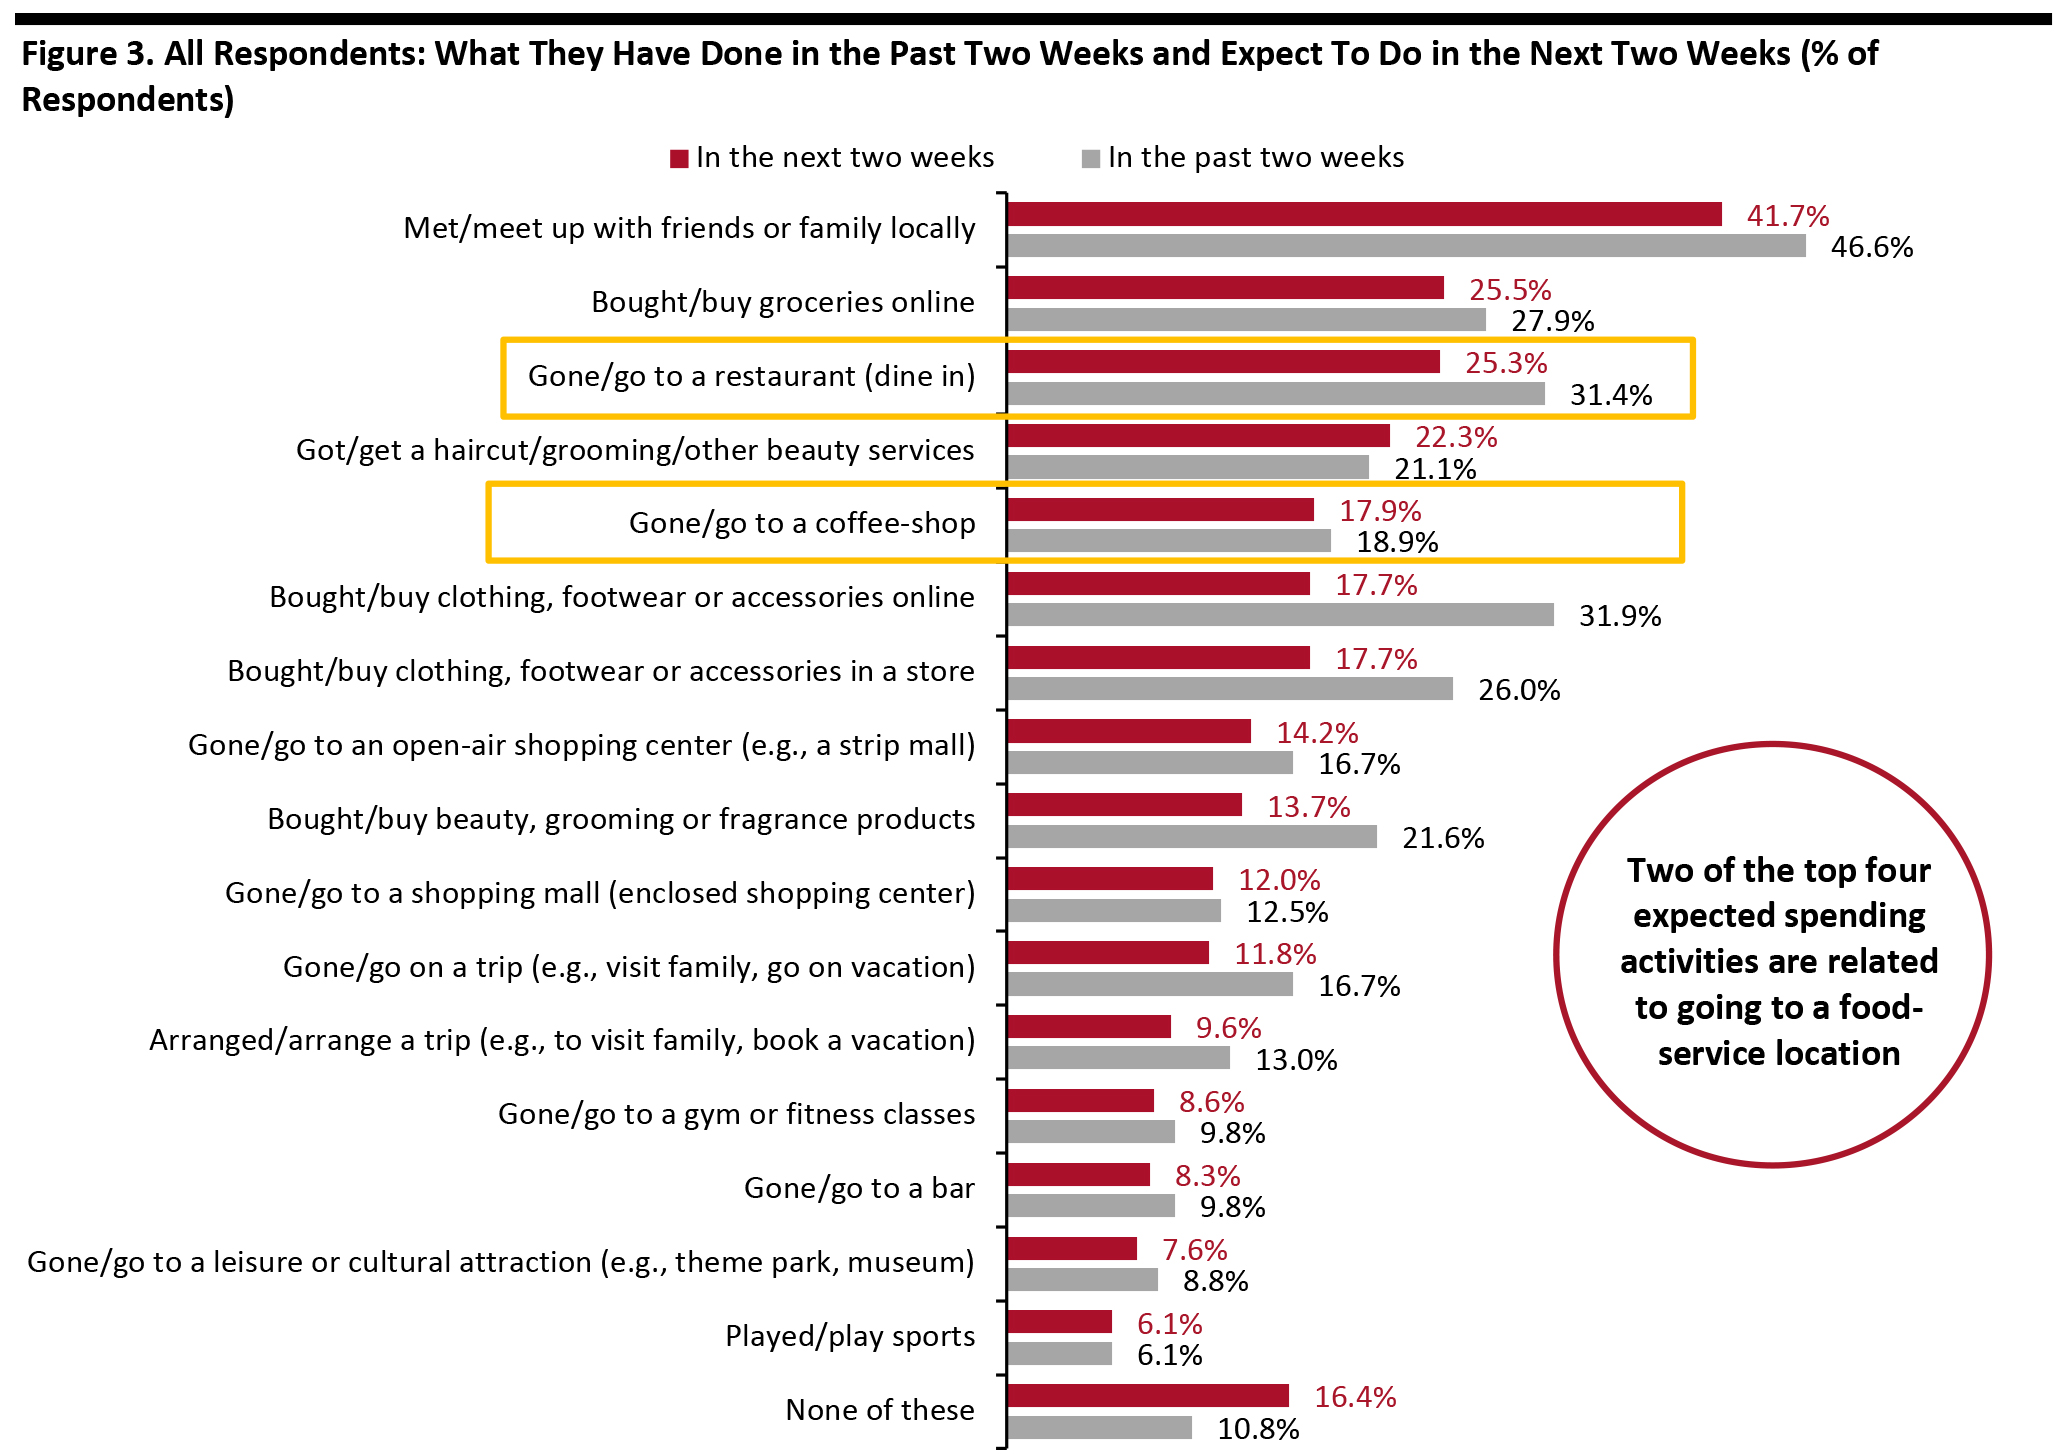
Source: Coresight Research [/caption] Online Grocery Shopping Remains the Top Spending-Related Activity for the Next Two Weeks Each week, we ask consumers what they expect to do in the next two weeks, with a comparable set of options to those for the last two weeks. In the chart below, we compare these short-term expectations with recent actual behavior. We saw slightly lower proportions of consumers expecting to do most of the 16 options we provided for activities in the next two weeks than actual behavior in the past two weeks.
- Online grocery shopping continues to be the top expected spending-related activity for the next two weeks, with one-quarter of consumers planning to buy groceries online, versus 27.9% of actual behavior of such activity in the last two weeks.
- The proportion of respondents that expect to buy clothing or footwear online stood at 17.7%, the same as those that plan to do so in a store. Only 13.7% of consumers expect to purchase beauty products. Based on past survey results, we expect to see higher proportions in actual behaviors of these shopping activities, particularly for both online and in-store apparel purchases, as the actual behavior of those activities typically exceed expected behavior.
- Two of the top four expected spending activities for the next two weeks are related to going to a food-service location. One-quarter of respondents said they plan to dine in a restaurant, very close to the proportion that expect to shop for groceries online. Some 17.9% of respondents reported that they expect to go to a coffee shop in the next two weeks.
 Respondents could select multiple options
 Base: US Internet users aged 18+
Source: Coresight Research [/caption]
Reviewing Trend Data in Current Purchasing Behavior
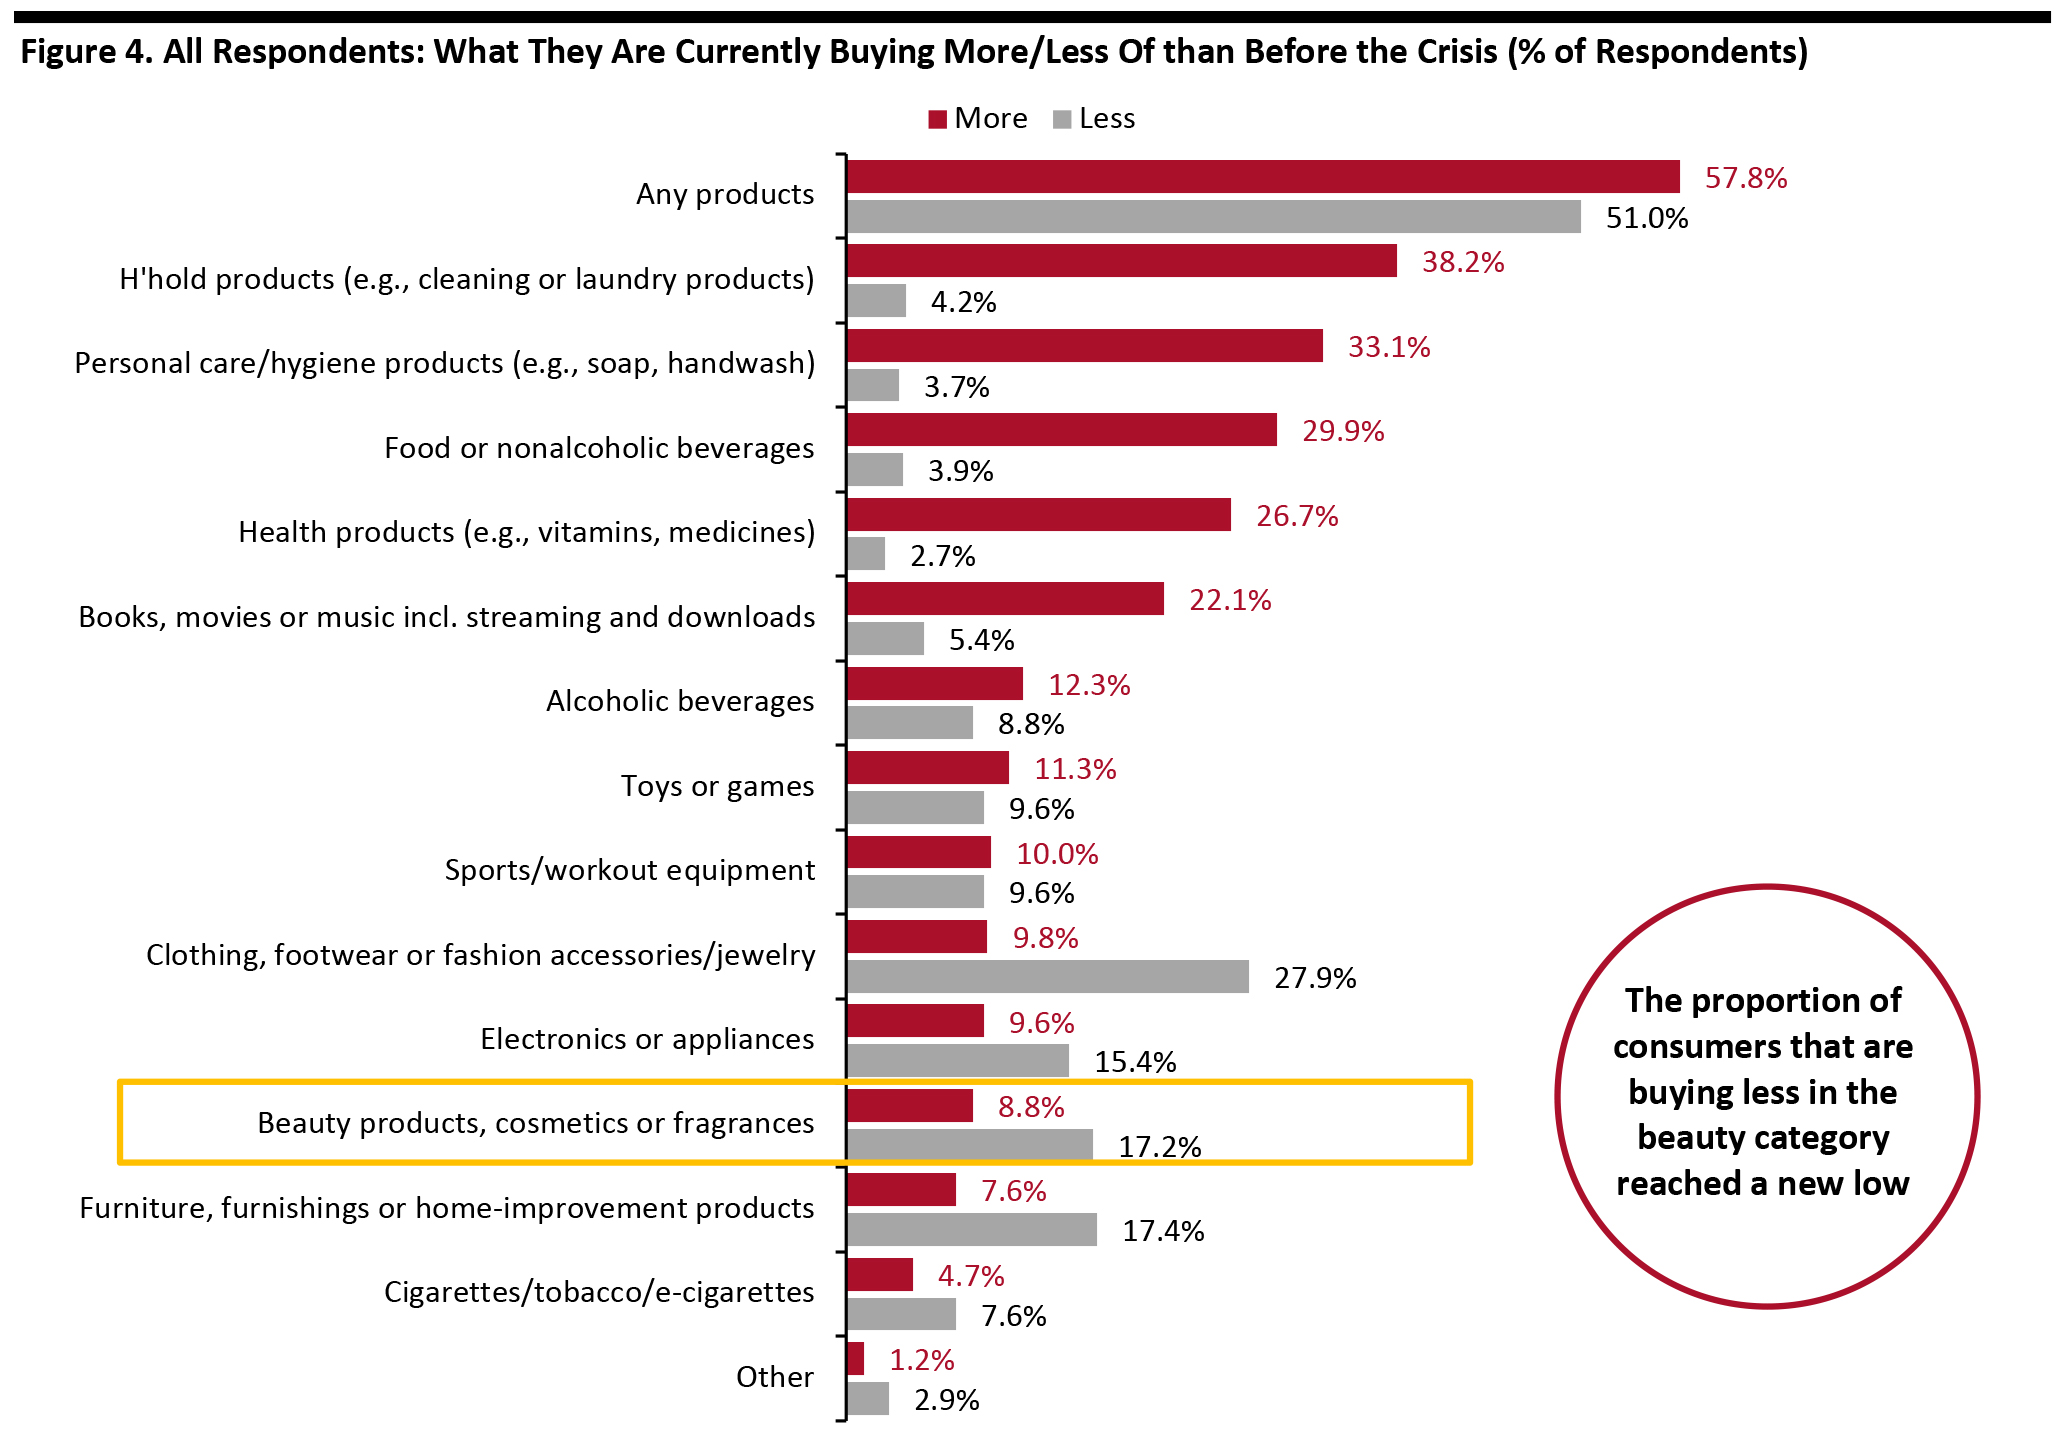
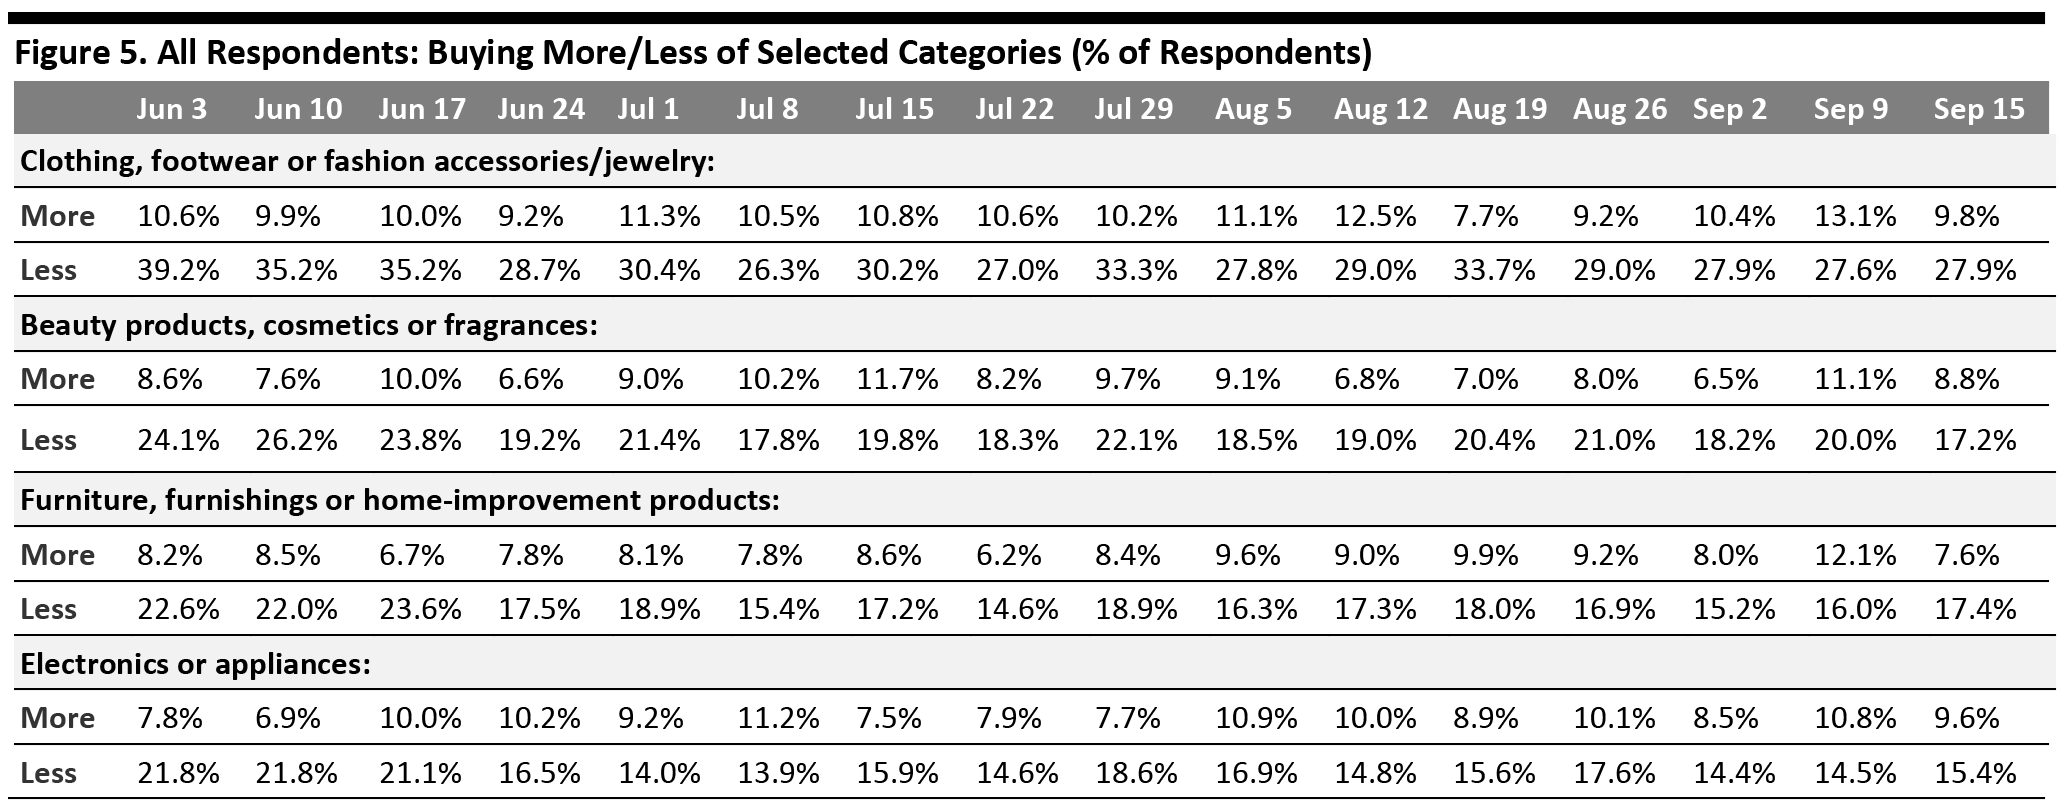
What Consumers Are Currently Buying More Of and Less Of Once again, we saw fluctuation in the proportion of respondents that are currently buying more of any category than before the crisis. This week, the proportion dropped by almost 15 percentage points to 57.8%, from 72.4% last week. The proportion of respondents that are currently buying less than pre-crisis also fell slightly to the level we saw two weeks ago: Some 51.0% are buying less of any category than pre-crisis, versus 53.5% last week.- Buying more of certain categories and buying less of certain categories were not mutually exclusive options, so respondents could answer yes to both.
- The ratio for clothing and footwear jumped to 2.9, from 2.1 last week.
- The ratio for beauty stood at 1.9 this week, versus 1.8 last week. However, it still fell below two—the level we saw in August.
- The ratio for home came at 2.3, compared to 1.3 last week.
- The ratio for electronics raised to 1.6, from 1.3 last week.
 Respondents could select multiple options
 Base: US Internet users aged 18+
Source: Coresight Research [/caption] [caption id="attachment_116416" align="aligncenter" width="725"]
 Base: US Internet users aged 18+
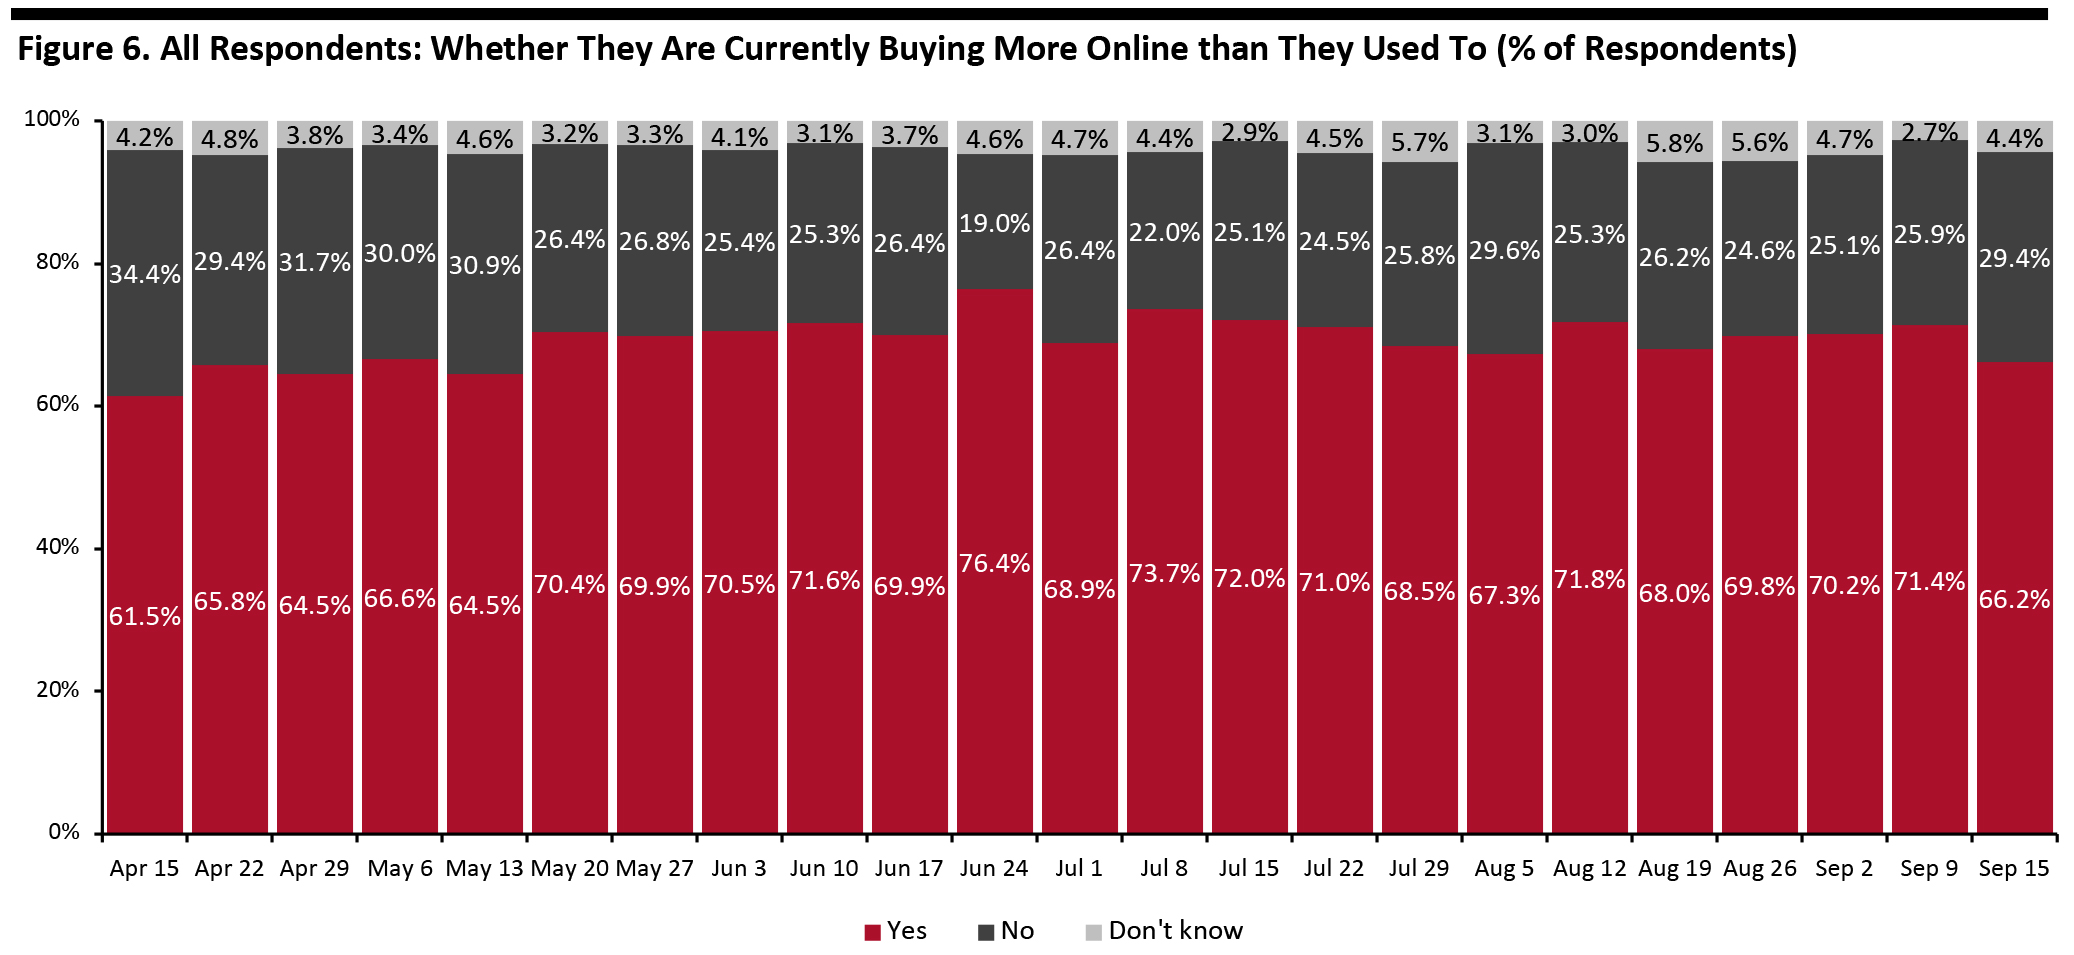
 Source: Coresight Research [/caption] Two-Thirds Are Switching Spending Online This week, we saw the proportion of consumers buying more online than they used to slide by five percentage points. Some 66.2% are currently buying more online, versus 71.4% last week. This could be largely due to fewer consumers buying more of any category overall than before the crisis, discussed previously. [caption id="attachment_116417" align="aligncenter" width="725"]
 Base: US Internet users aged 18+
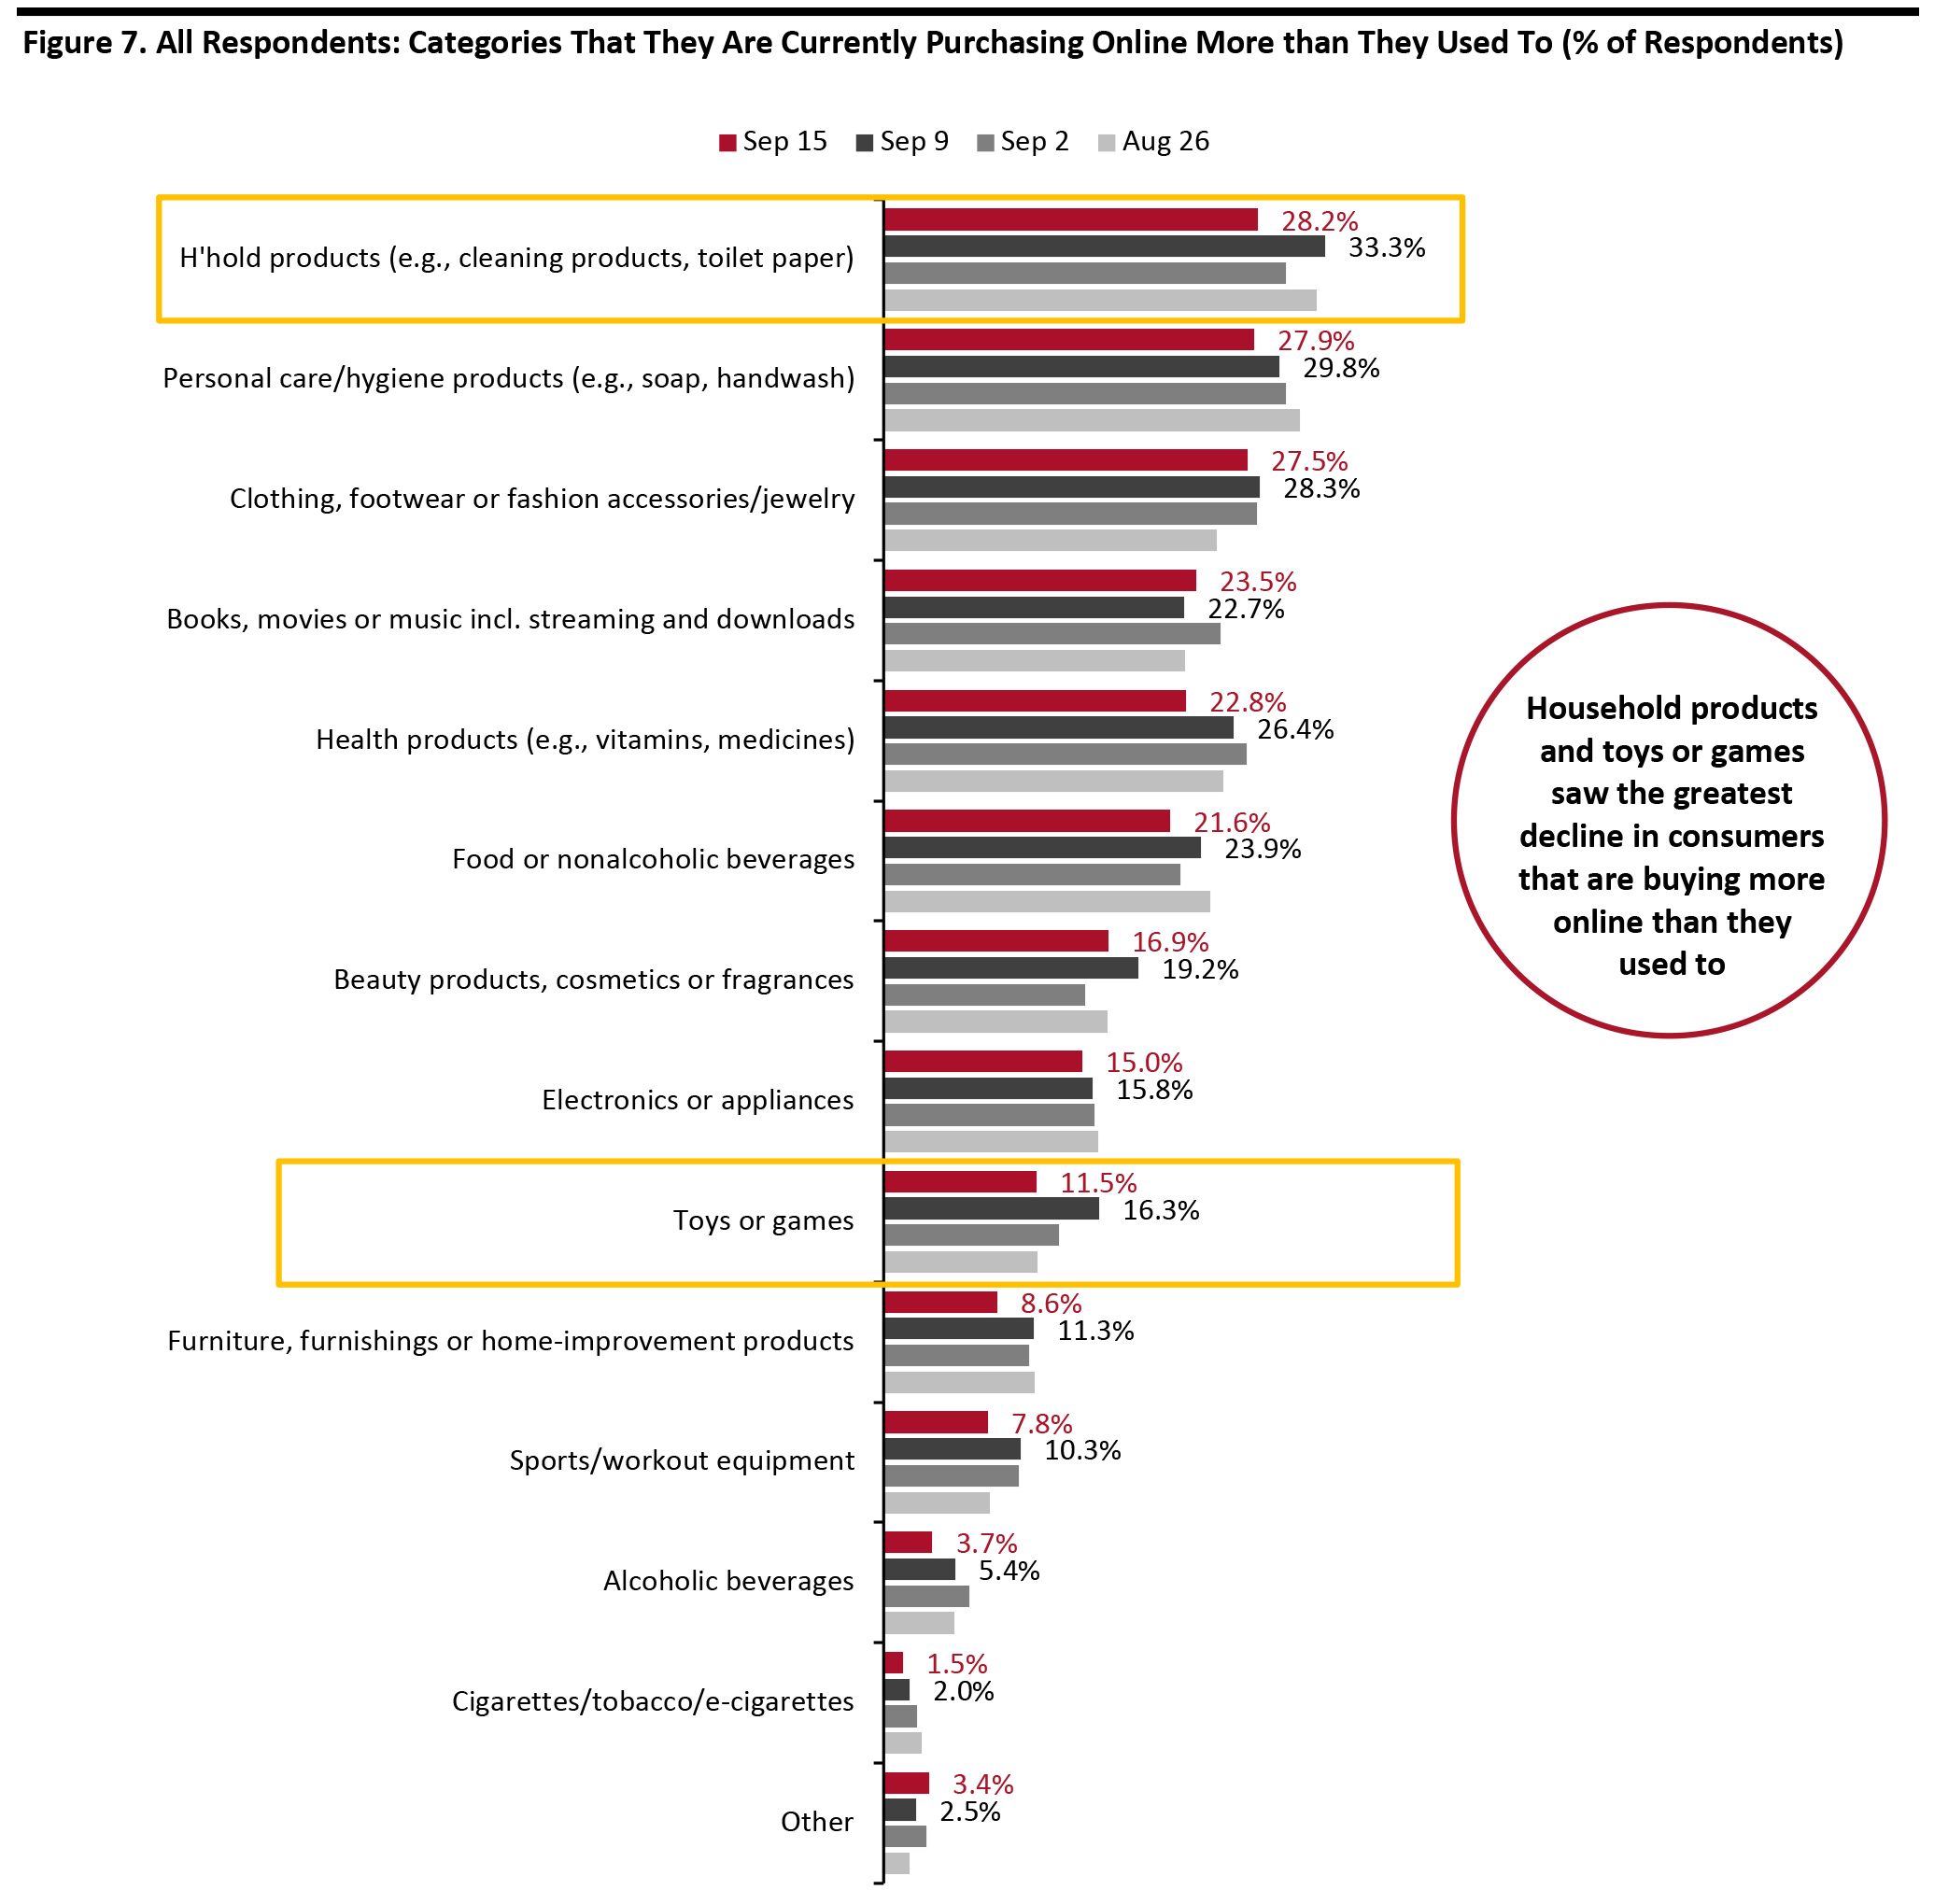
 Source: Coresight Research [/caption] What Consumers Are Currently Buying More Of Online Looking at specific categories, the decline in online shopping was driven by fewer consumers buying more household products and toys or games online than pre-crisis. Online purchases of both categories dropped by around five percentage points week over week. Online purchases of food dropped slightly, to the lowest level we have seen in months—some 21.6% are buying more food online, versus 23.9% last week. This is consistent with our previous finding that fewer consumers had bought groceries online week over week. Clothing and footwear were once again the third-most purchased category online this week. The proportion of respondents that are currently buying more apparel online remained broadly level at around 28%. Online purchases of other discretionary categories, including beauty and home, both went down slightly. Only 8.6% are buying more home products online—the lowest level we have seen since July. [caption id="attachment_116418" align="aligncenter" width="725"]
 Respondents could select multiple options
 Base: US Internet users aged 18+
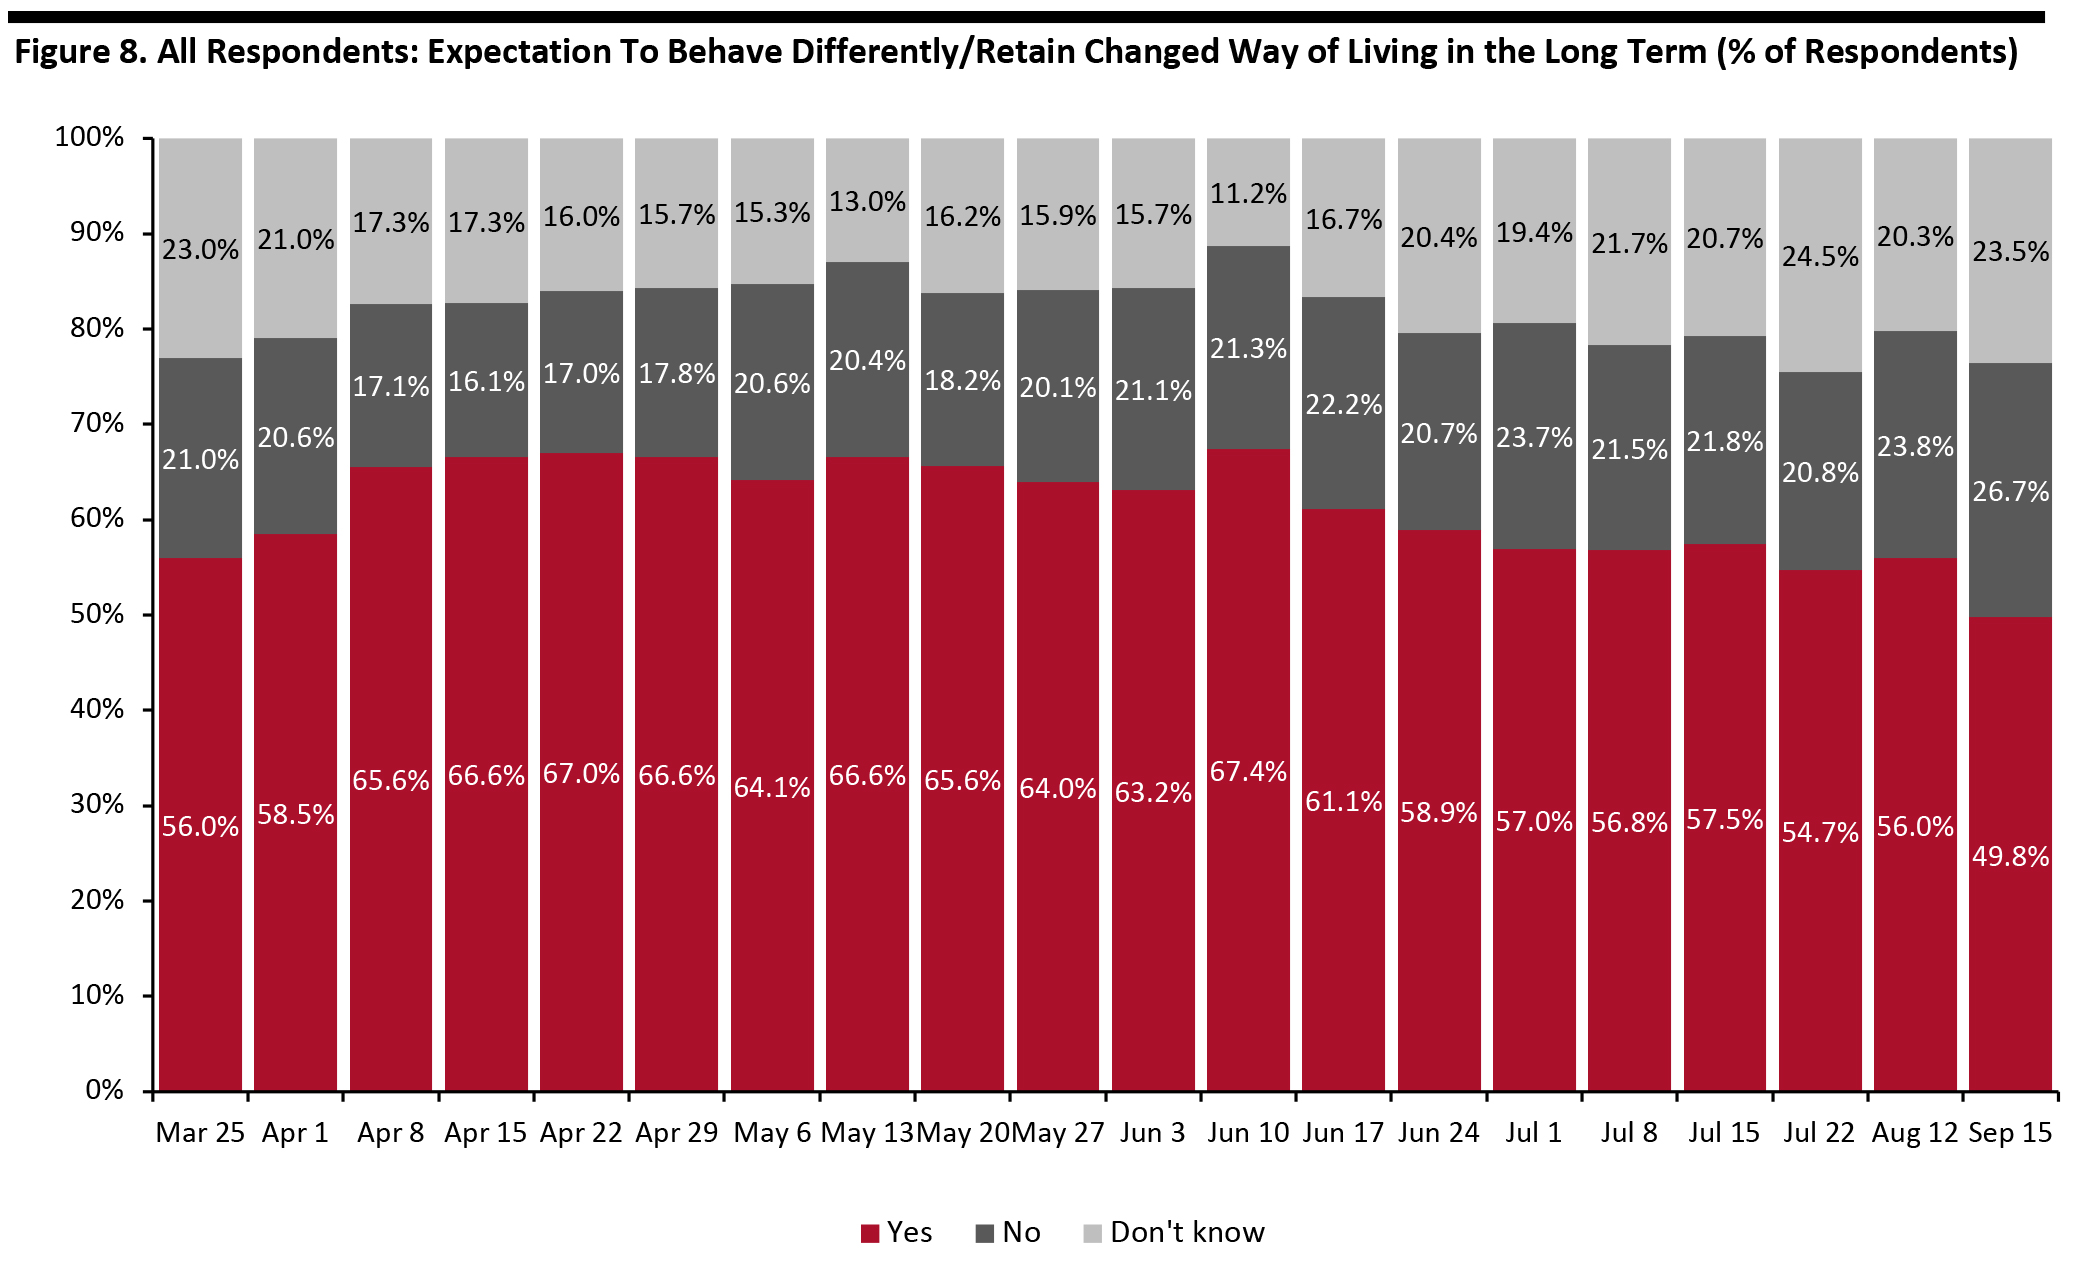
Source: Coresight Research [/caption] Half Expect To Retain Changed Behaviors over the Long Term We asked respondents whether they think they will keep some of the behaviors they have adopted during the coronavirus crisis in the long term. The proportion of respondents expecting to retain some changed behaviors declined by six percentage points to 49.8% this week, versus 56.0% a month ago and the peak of two-thirds in June 10. This is the lowest level we have seen since we started asking the question at the end of the March, suggesting that consumers are more willing to return to their regular activities than they previously expected. [caption id="attachment_116419" align="aligncenter" width="725"]
 Question not asked on July 29, August 5, August 19, August 26, September 2 or September 9
 Base: US Internet users aged 18+
Source: Coresight Research [/caption] We saw declines in the proportions of respondents selecting nine of the 11 behavior options we provided, compared to a month earlier, although all changes were within the margin of error. Having more hygienic practices remain the top behaviors to retain in the long term, although the proportion has slid by nine percentage points from three months ago. The proportion of consumers expecting to have less physical interaction in the long term saw the largest month-over-month drop—one-quarter plan to retain such behaviors, compared to three in 10 a month ago. This is the lowest proportion we have seen since April. The proportion of respondents expecting to use contactless payment options in stores more often than they did previously remained fairly stable: Some 22.3% plan to use the option in the long term. [caption id="attachment_116420" align="aligncenter" width="725"]
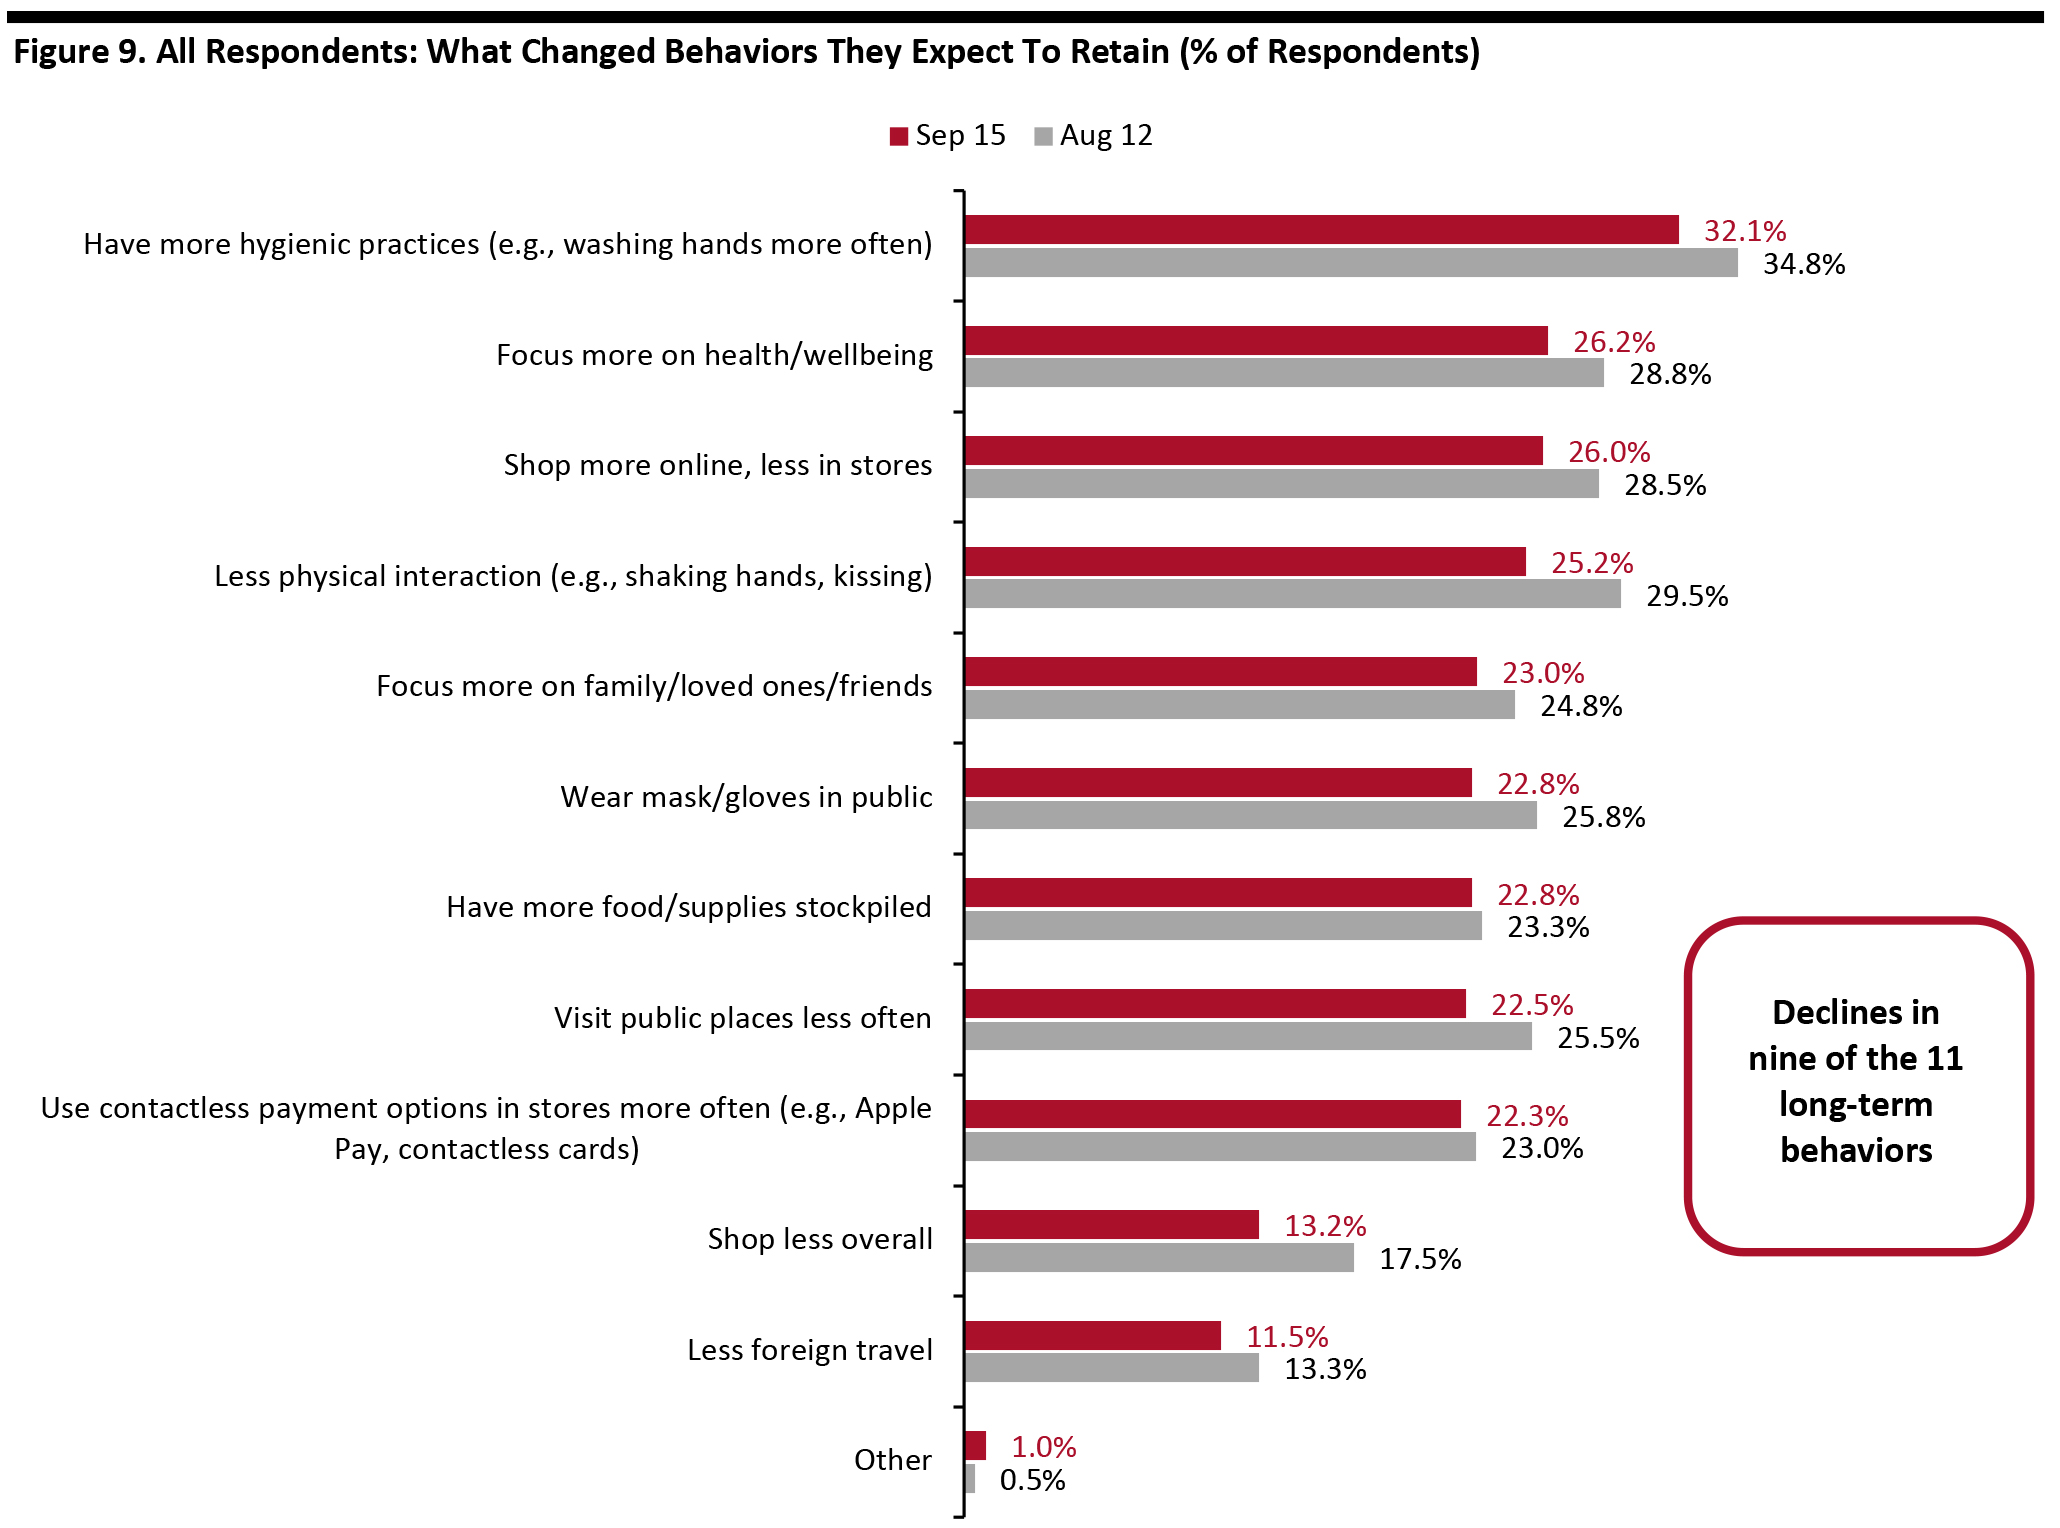 Respondents could select multiple options
 Base: US Internet users aged 18+
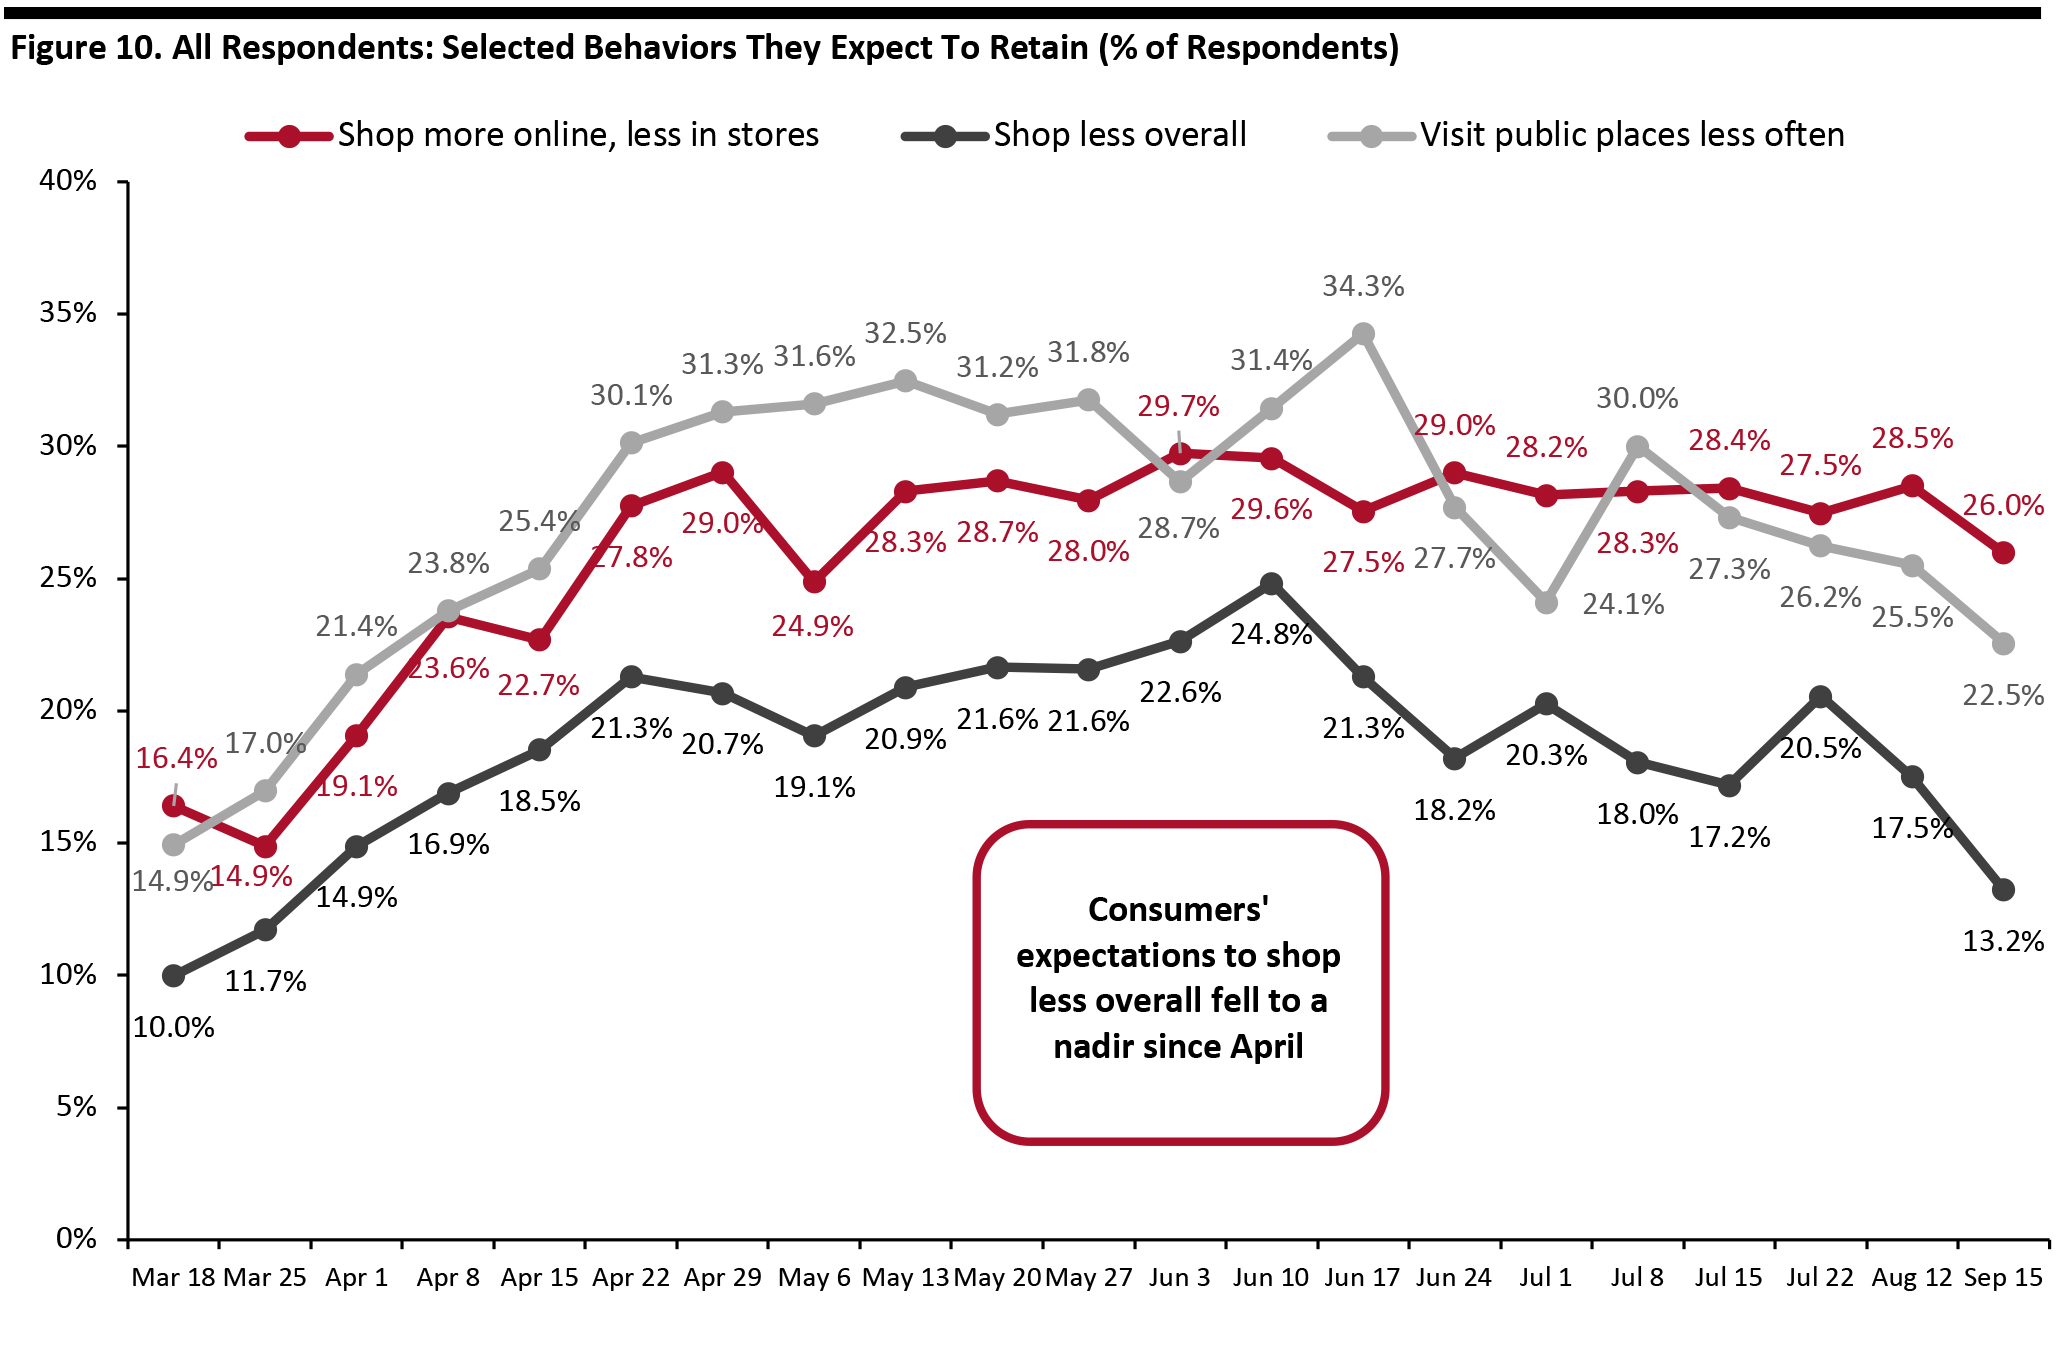
Source: Coresight Research [/caption] In the chart below, we show trended data in three of the metrics charted above. All three metrics dropped slightly compared to a month ago. The proportion that expect to shop less overall fell to a new low since April. Only 13.2% of respondents plan to retain such behavior in the long term, versus the peak of one-fifth on June 10. Some 22.5% expect to visit public places less often, down by 12 percentage points from the peak of 34.3% in the week of June 17. Shopping more online saw the smallest decline among these three behaviors and have not seen much fluctuation since mid-May. The proportion of consumers expecting to shop more online in the long term stood at 26.0% this week. [caption id="attachment_116421" align="aligncenter" width="725"]
 Question not asked on July 29, August 5, August 19, August 26, September 2 or September 9
 Base: US Internet users aged 18+
Source: Coresight Research [/caption]
What We Think
This week, we saw the following:- Apparel: Apparel remains the most impacted category, with a stable proportion of about 28% buying less. However, we are seeing channel shifts and a creep back to brick-and-mortar formats: Some 26.0% had bought clothing or footwear in a store in the past two weeks—the highest level we have seen. By contrast, the proportion that had done so online decreased by five percentage points week over week to 31.9%. As a result, the difference between consumers that had bought apparel online and in-store went down to six percentage points, compared to roughly 13 percentage points three months ago.
- Online Grocery: We have seen a fluctuation in online grocery shopping activity in the past few weeks. This week, the proportion of respondents that had bought groceries online in the past two weeks dropped by almost six percentage points to 27.9%, from about one-third last week. The decline is also aligned with the low level of consumers that are buying more food online than before the pandemic—at around 21.6%. For more data on consumers’ online grocery shopping habits, see our survey report from August 19, and keep an eye out for our forthcoming monthly US CPG Sales Tracker report, which features exclusive data on online CPG sales growth.
- E-Commerce: This week, we saw the proportion of consumers that are currently buying more online than they used to fall by five percentage points to a new low of 49.8%, from 56.0% last week. This decline could be largely due to fewer consumers buying more of any category overall than before the crisis. Half of consumers are still buying more online than pre-crisis, and some 26.0% of respondents expect to retain their behavior of shopping more online, less in store in the long term—and unlike some other metrics on retained behaviors post crisis, the expectation to shop more online has remained largely stable over several months. We expect e-commerce to remain at an elevated level as we move toward the holiday season. See our US E-Commerce: Post-Crisis Outlook report, publishing later this week, for more data and analysis, and see our forthcoming US holiday survey report for data on consumers’ expected holiday shopping behavior and spending.