
albert Chan
What’s the Story?
This report presents the results of Coresight Research’s latest weekly survey of US consumers, including on the impacts of the coronavirus outbreak, undertaken on November 10, 2020. We explore the trends we are seeing from week to week, following prior surveys on November 3, October 27, October 20, October 13, October 6, September 29, September 22, September 15, September 9, September 2, August 26, August 19, August 12, August 5, July 29, July 22, July 15, July 8, July 1, June 24, June 17, June 10, June 3, May 27, May 20, May 13, May 6, April 29, April 22, April 15, April 8, April 1, March 25 and March 17–18.
Holiday Season Shopping Update
As we are now in the holiday season, we again asked consumers about their expected shopping behaviors for the holiday season 2020 this week, and we trend the findings with those from mid-August, mid-September and mid-October. We asked respondents:
- About their expected overall holiday season spending this year —including gifts and expenses related to traveling and dining out—compared to 2019.
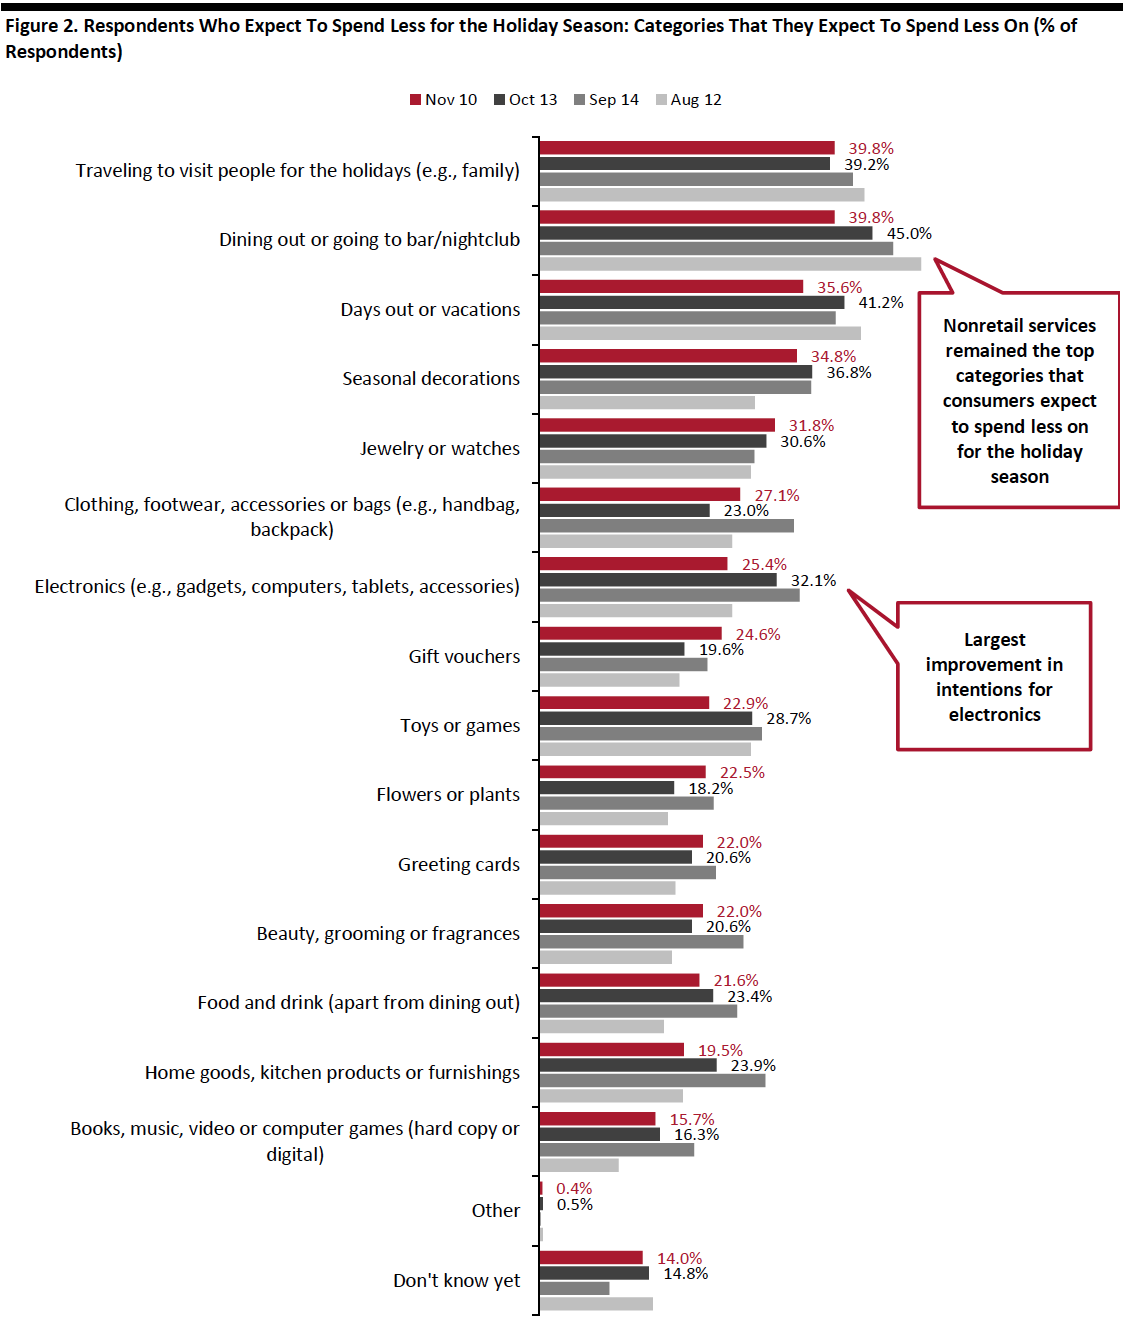
- For those who expect to spend less this holiday season, what categories they plan to spend less on—from 15 options (as well as “other” and “don’t know”).
- Whether they agreed with any or all of 10 attitudinal and behavioral statements related to holiday-season shopping.
Over Half of Respondents Expect To Spend Less
Our latest survey results once again confirmed that US consumers plan to scale back on total holiday spending for this holiday season: In total, some 52.8% expect their total holiday spending to be less than last year, with 31.8% planning to spend a lot less and 21.0% expecting to spend slightly less.
Overall expectations were fairly consistent from the results in previous months. We asked respondents to think about their holiday spending overall—including retail purchases such as gifts, as well as spending driven by parties, social gatherings and getaways—and we break out where they expect to cut back in the next section.
[caption id="attachment_119309" align="aligncenter" width="700"]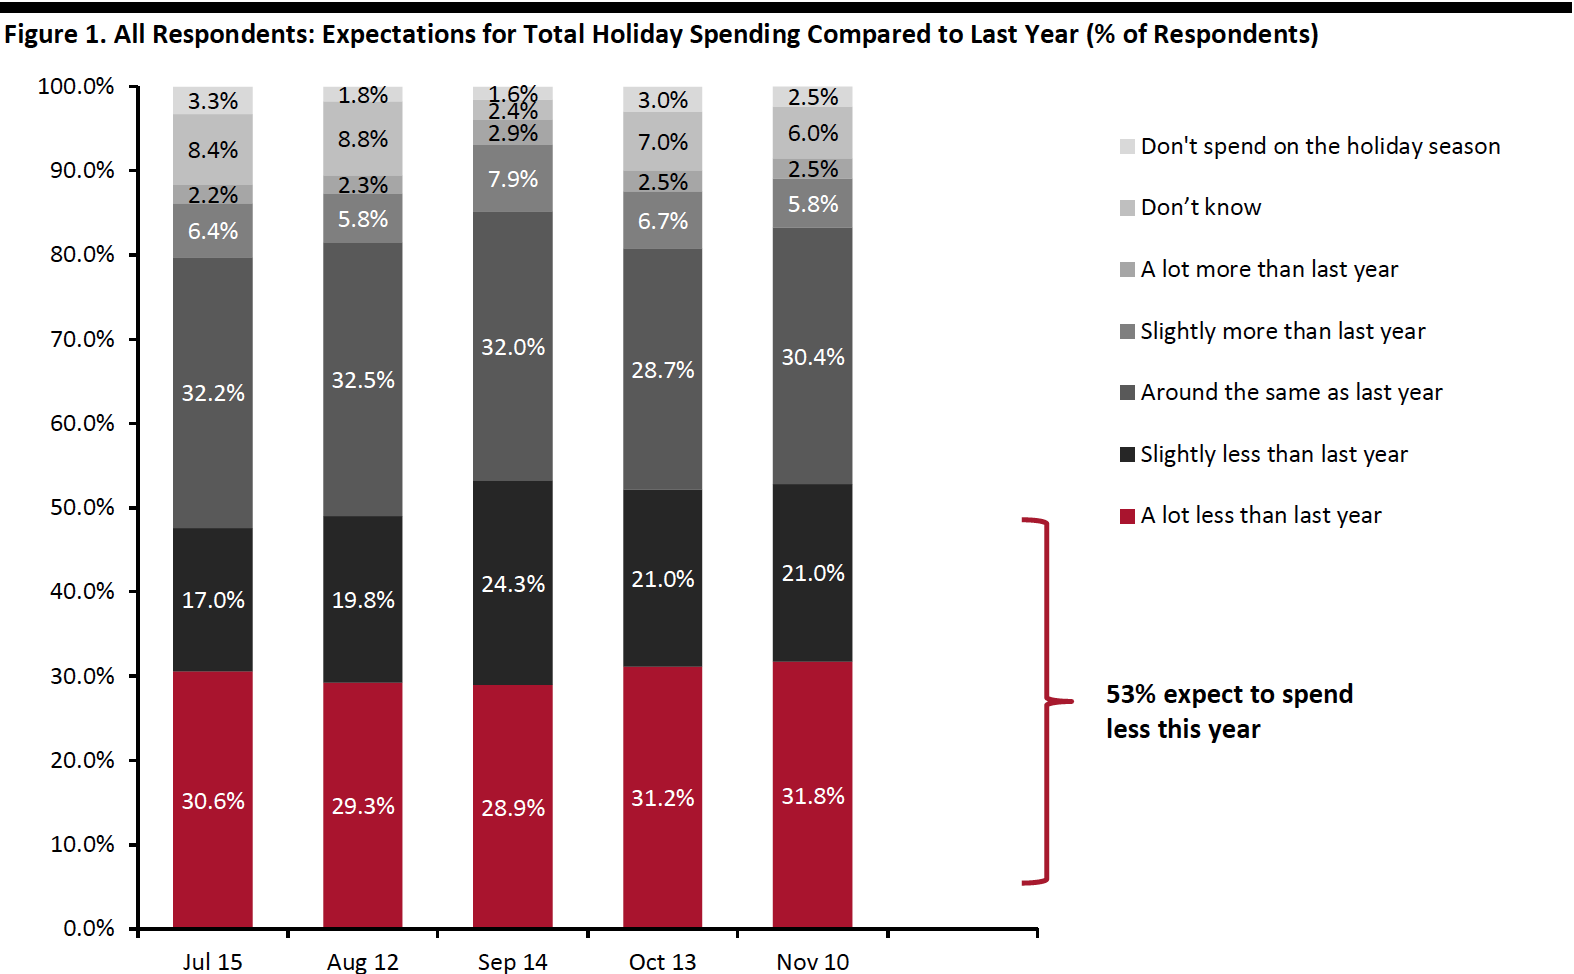 Base: US respondents aged 18+ (447 in November, 401 in October, 1,134 in September, 401 in August, 454 in July)
Source: Coresight Research[/caption]
For those who expect to spend less for the holiday season:
- Nonretail services are expected to be hit the hardest, although fewer consumers said they plan to spend less on dining out and on days out, compared to a month ago. Some 39.8% expect to cut their spending on traveling to visit other people compared to last year, and the same proportion plan to spend less on dining out or going to bars/nightclubs.
- Almost half of the 12 product categories saw slight month-over-month declines, although some are within the margin of error. Seasonal decorations remained the top product category that consumers plan to spend less on for holiday 2020. Electronics recorded the largest sequential decline in expectations to spend less—some 25.4% expect to spend less in this category, down almost seven percentage points from last month. Home/kitchen products also fell in terms of ranking, with one-fifth planning to spend less than last year. Clothing, footwear or accessories, however, saw slightly higher expectations to spend less versus last month.
- By age group, we saw the lowest proportions of those buying less in clothing, footwear or accessories, beauty, home and electronics among the youngest adult age group (see Figure 3).
 Respondents could select multiple options
Base: US respondents aged 18+ who expect to spend less on the 2020 holiday season than they did last year (236 in November, 209 in October, 603 in September, 196 in August, 216 in July)
Source: Coresight Research[/caption] [caption id="attachment_119311" align="aligncenter" width="700"]
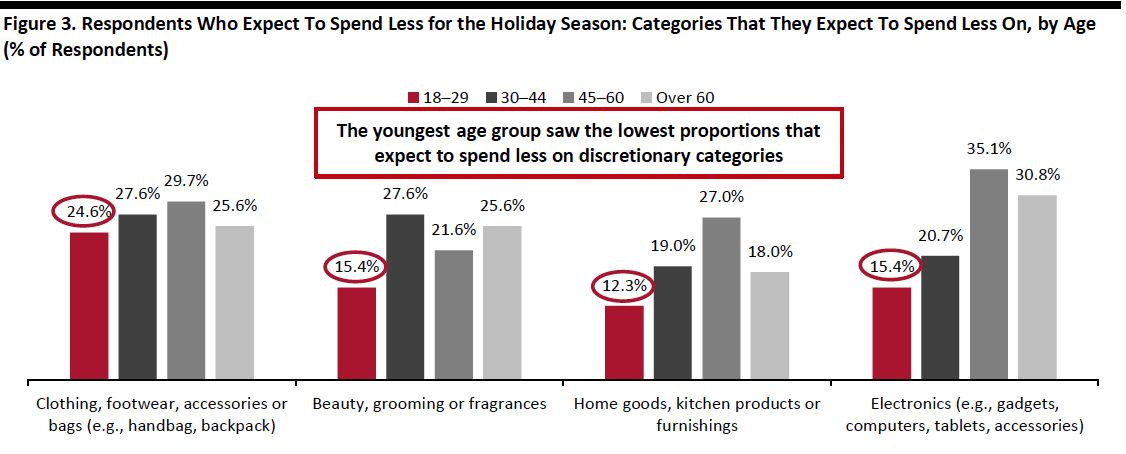 Respondents could select multiple options
Base: 236 US respondents aged 18+ who expect to spend less on the 2020 holiday season than they did last year
Source: Coresight Research[/caption]
One-Third of Holiday Shoppers Expect To Shop, or Have Already Shopped, Early
The new 10.10 Shopping Festival and Amazon’s Prime Day kicked off an early holiday season in an unpredictable shopping year. With many retailers beginning to launch their promotional events for the season, we saw one-third of holiday shoppers report that they are expecting to start, or have already started, their holiday shopping earlier than usual, up six percentage points from a month ago. This compared to only 12.4% that expect to start their holiday shopping later, which results in a 20-percentage-point difference. The early and longer holiday season could not only help brands and retailers to boost sales in a challenging retail environment but also ease the pressure on e-commerce fulfillment.
Some 28.7% of holiday shoppers expect to do their shopping on Cyber Monday, ahead of those planning to shop on Black Friday (22.3%).
[caption id="attachment_119312" align="aligncenter" width="700"]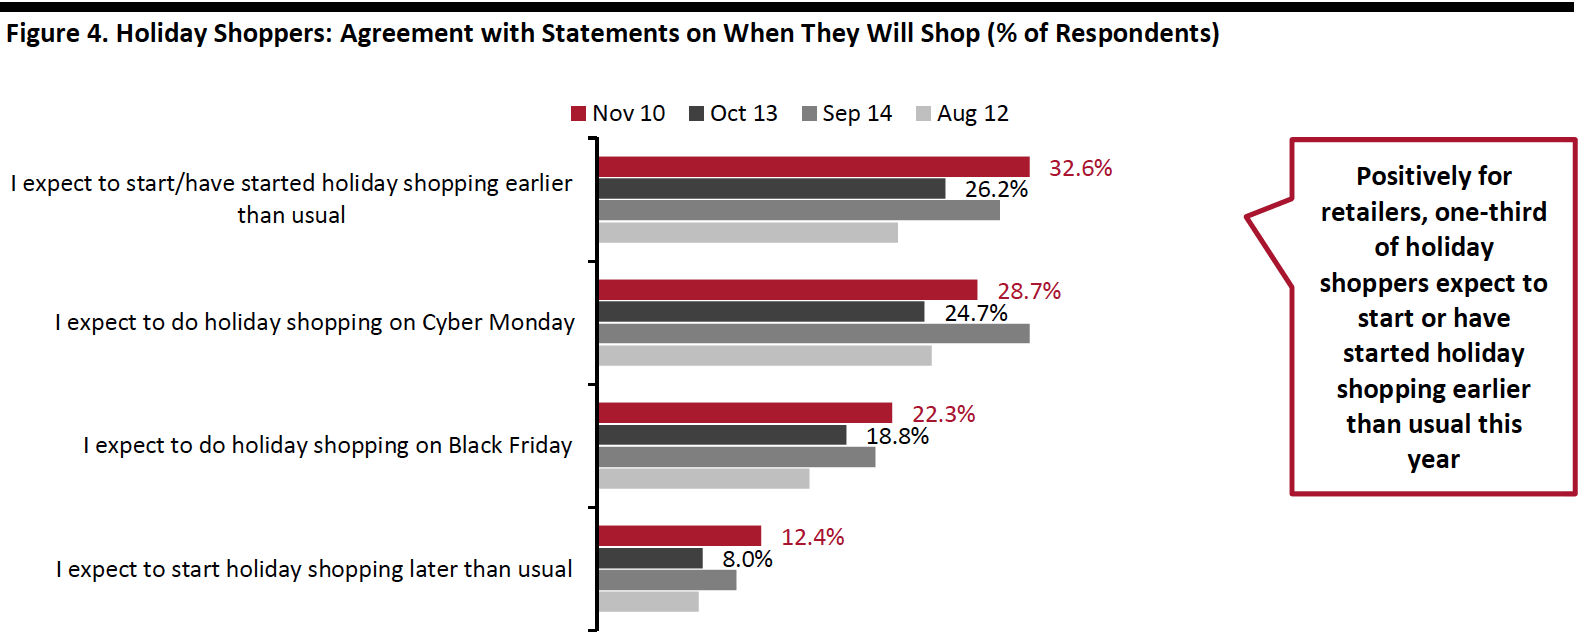 Base: US respondents aged 18+ who expect to spend on the holidays (436 in November, 389 in October, 1,116 in September, 393 in August, 439 in July)
Source: Coresight Research[/caption]
Three in 10 Plan To Shift Their Holiday Shopping from Stores to Online
Almost one-third of holiday shoppers expect to shop from fewer stores to reduce their trips to brick-and-mortar locations. The consolidation of shopping trips could benefit retailers that offer a variety of product categories and brands, such as mass merchandisers and warehouse clubs.
Some 29.4% of holiday shoppers plan to switch some or all of their holiday spending from stores to e-commerce, an improvement from one-quarter a month ago. In a separate survey question, we saw a high proportion of respondents (73.8%) state that they are currently buying more online than they used to (see later in this report). The gap may reflect the already high e-commerce shopping rates during the holiday season.
We saw an almost identical proportion of consumers expecting to use curbside and in-store pickup services: Some 22.5% of holiday shoppers expect to use curbside pickup for some of their online purchases, and 22.3% plan to use in-store pickup.
[caption id="attachment_119313" align="aligncenter" width="700"]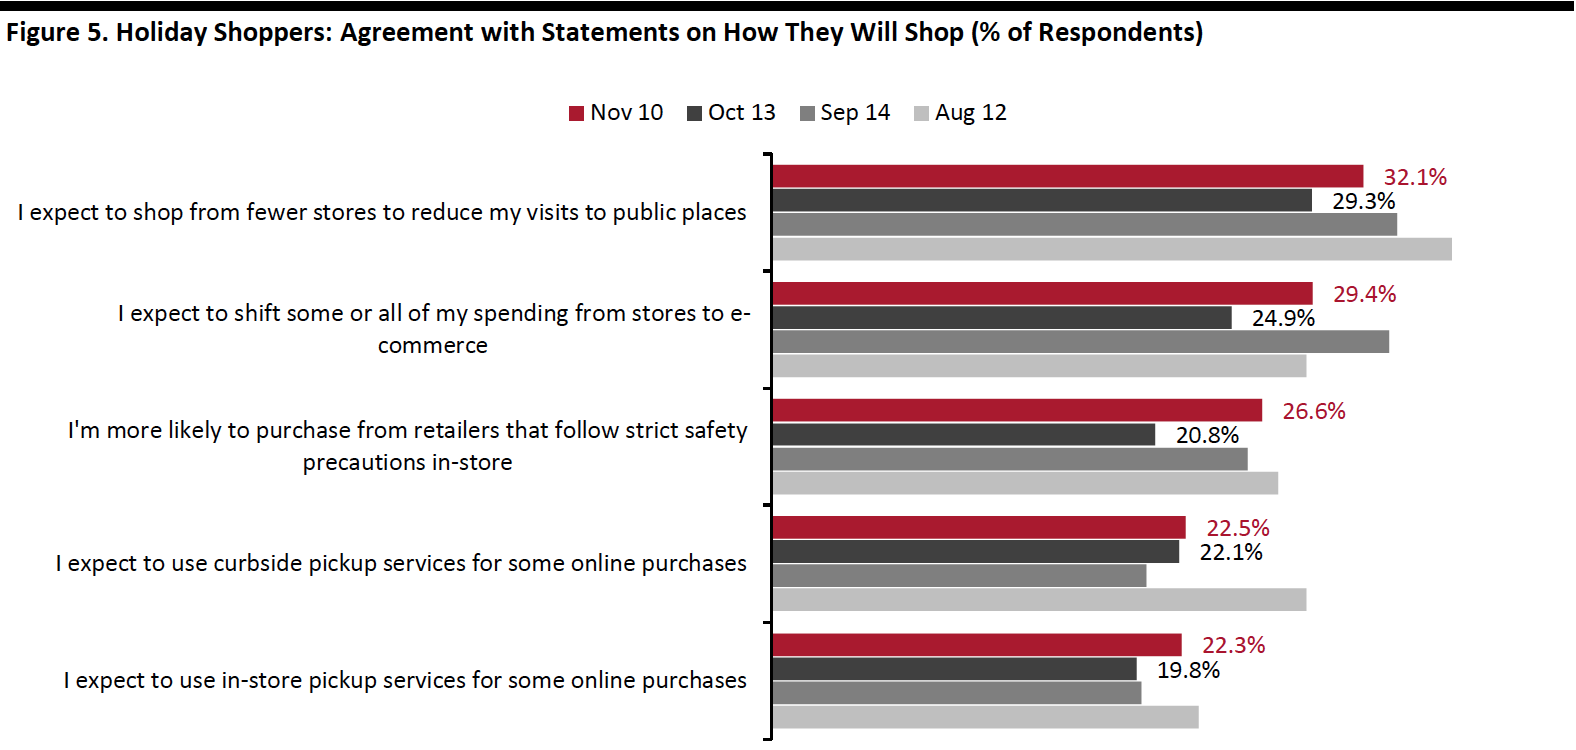 Base: US respondents aged 18+ who expect to spend on the holidays (436 in November, 389 in October, 1,116 in September, 393 in August, 439 in July)
Source: Coresight Research[/caption]
What Shoppers Are Doing and Where They Are Going
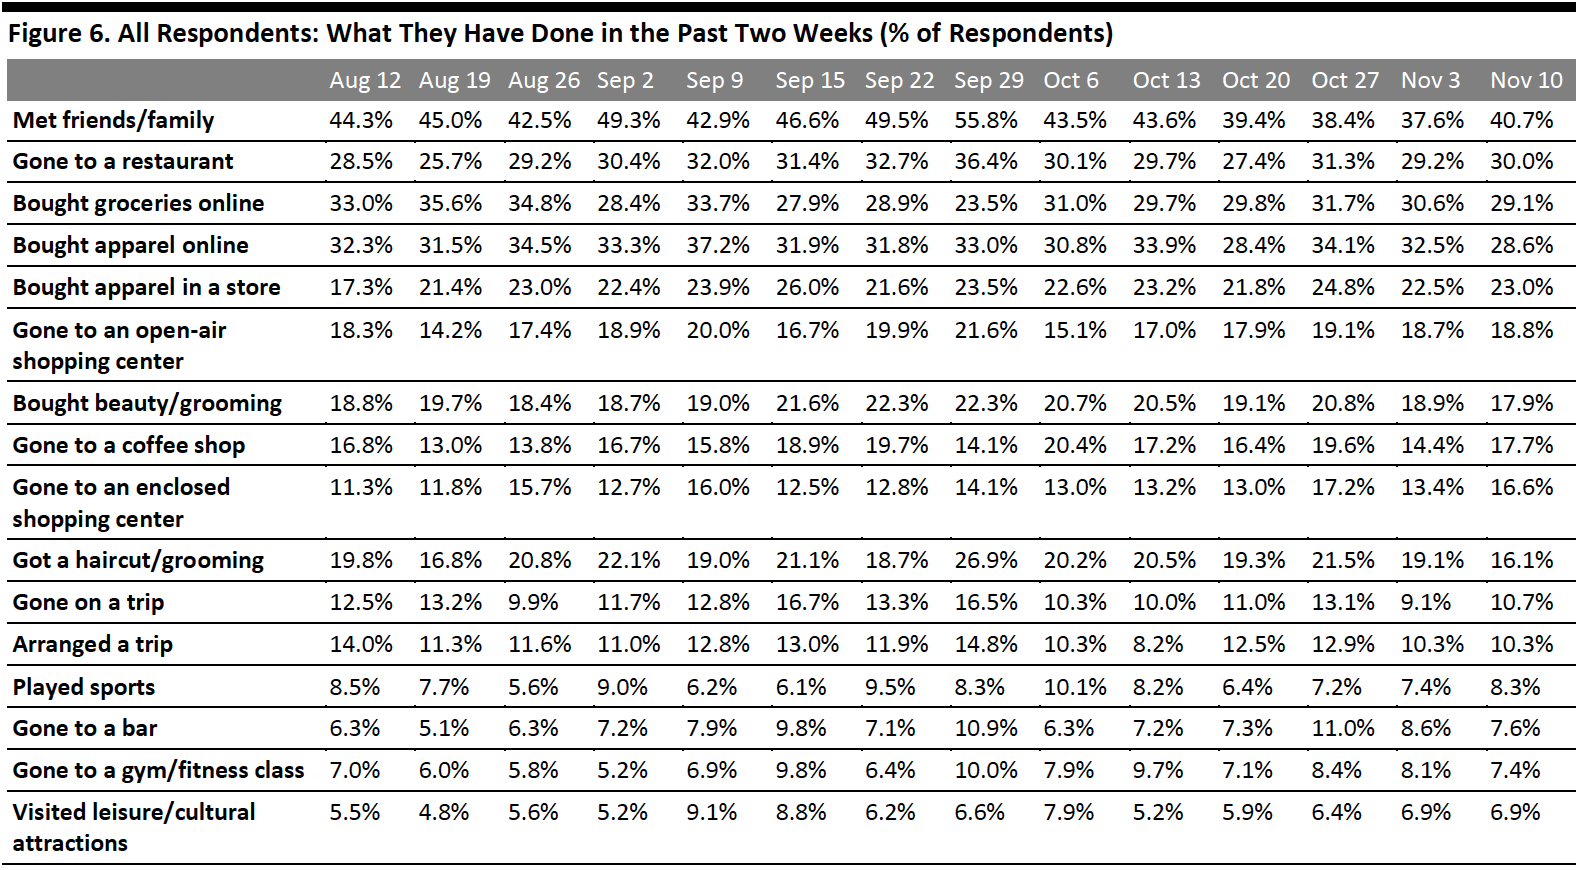
Fewer Consumers Had Bought Apparel Online in the Past Two Weeks
Each week, we ask consumers what they have done in the past two weeks. This week, the proportions of respondents slightly decreased for five of the 16 options we provided for recent activities. All of the week-over-week changes were within the margin of error; however, the directional trends, including over a number of weeks, can prove informative.
- The proportion of respondents that had bought clothing, footwear or accessories online in the past two weeks came at 28.6%, slightly down from around one-third last week. Online apparel shopping also fell from the top spending activity to third place, in terms of ranking. Looking at age distribution, the decline was driven by consumers aged over 45. As overall online shopping remained high, at around three-quarters (discussed later in the report), these older consumers might have shifted some of their spending to other product categories in the past two weeks. If we look at the trend over two weeks, we saw both online and in-store apparel shopping drop—despite moving further into the holiday shopping season, which should bolster purchases.
- We have seen the proportion of respondents that had visited an open-air shopping center stay at a stable proportion of around 19% for three consecutive weeks. The proportion of consumers that had visited an enclosed center bounced back to the level we saw two weeks ago after dropping last week—some 16.6% had visited such a location. These metrics remained low as shopping centers/malls continued to be the most-avoided public places, which we discuss later in this report.
 Respondents could select multiple options
Base: US respondents aged 18+
Source: Coresight Research[/caption]
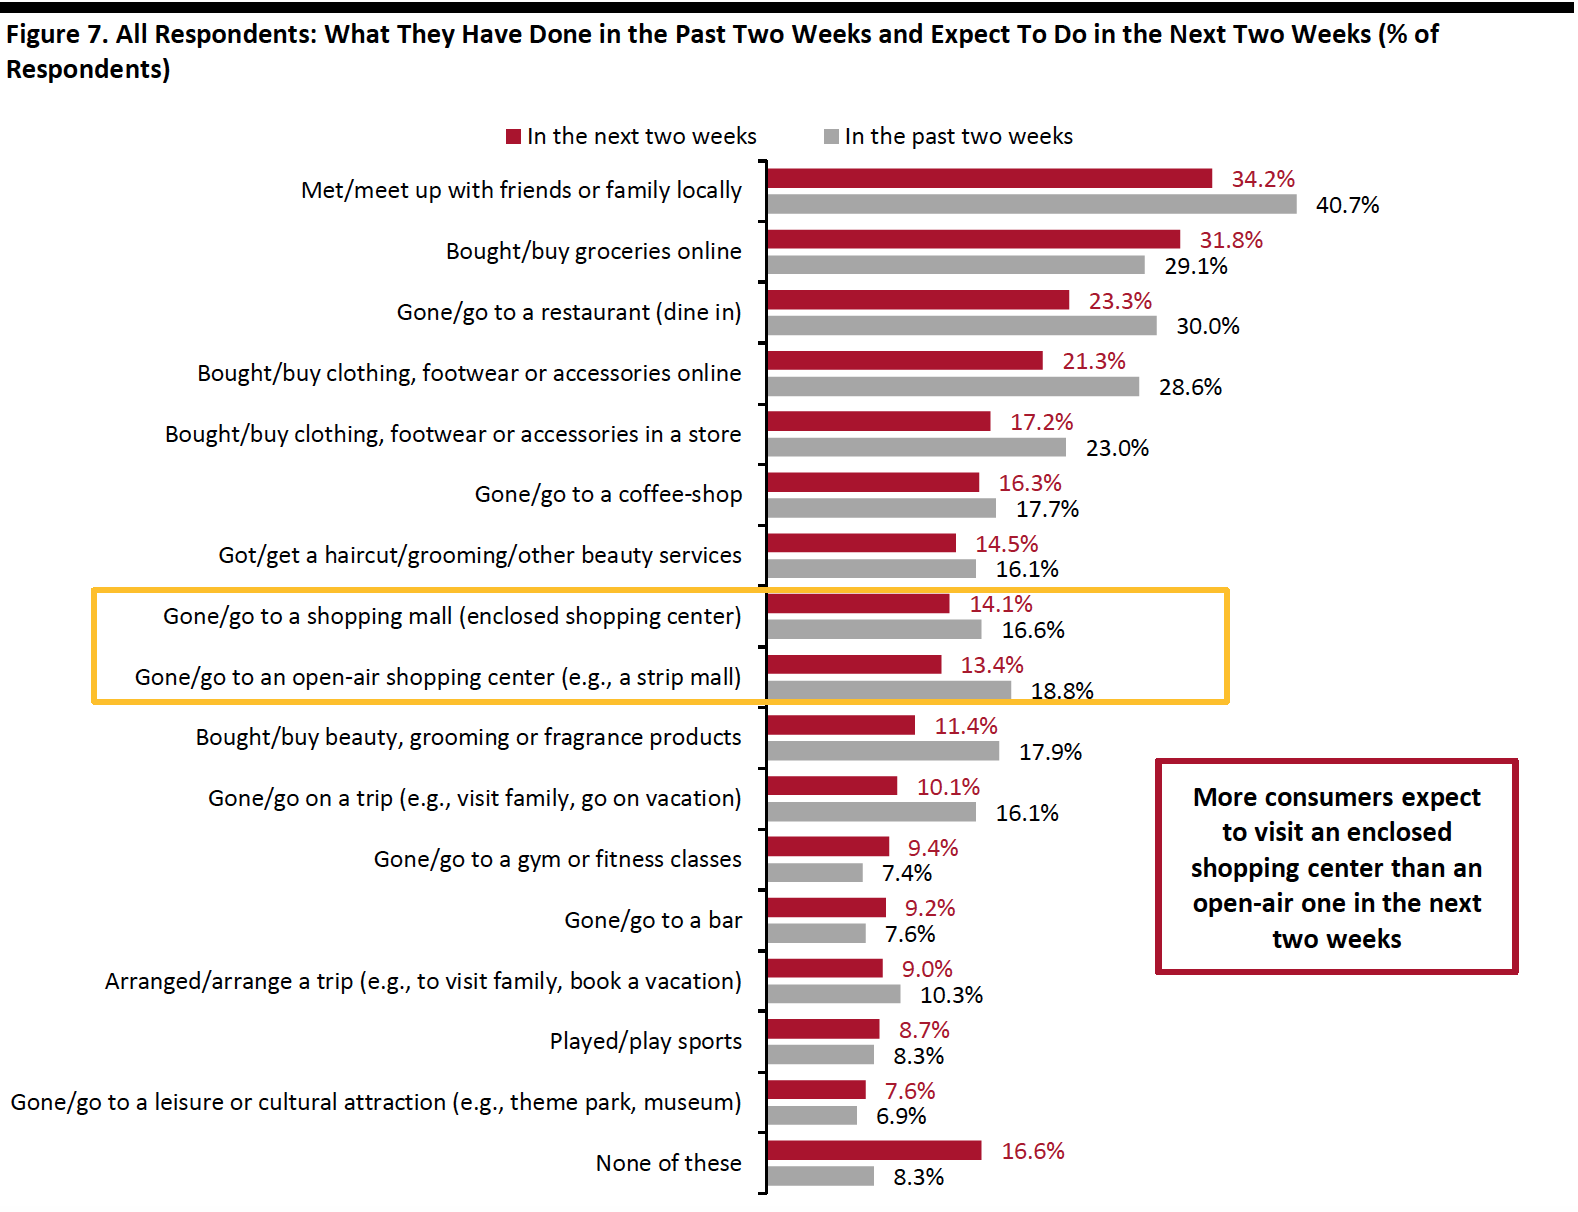
More Consumers Plan To Visit an Enclosed Shopping Center than an Open-Air Center
Each week, we also ask consumers what they expect to do in the next two weeks, with a set of options comparable to those for the last two weeks. In Figure 7, we compare these short-term expectations with recent actual behavior.
We saw slightly lower proportions of consumers expecting to do 11 of the 16 options we provided for activities in the next two weeks than actual behavior in the past two weeks.
- Online grocery shopping again took the first spot of expected spending-related activity for consumers to do in the next two weeks, with slightly more consumers planning to do so (31.8%) compared to the 29.1% of actual behavior in the past two weeks.
- For the first time, the proportion of consumers planning to visit an enclosed shopping center exceeded the proportion expecting to go to an open-air shopping center, which could be due to the colder weather now.
- The proportion of respondents that expect to buy clothing or footwear online came in at 21.3%, and some 17.2% plan to buy this category in a store—representing a slight shift from online to in-store compared to last week’s findings. Based on past survey results, we expect to see higher proportions in actual behavior of apparel shopping next week.
 Respondents could select multiple options
Base: US respondents aged 18+
Source: Coresight Research[/caption]
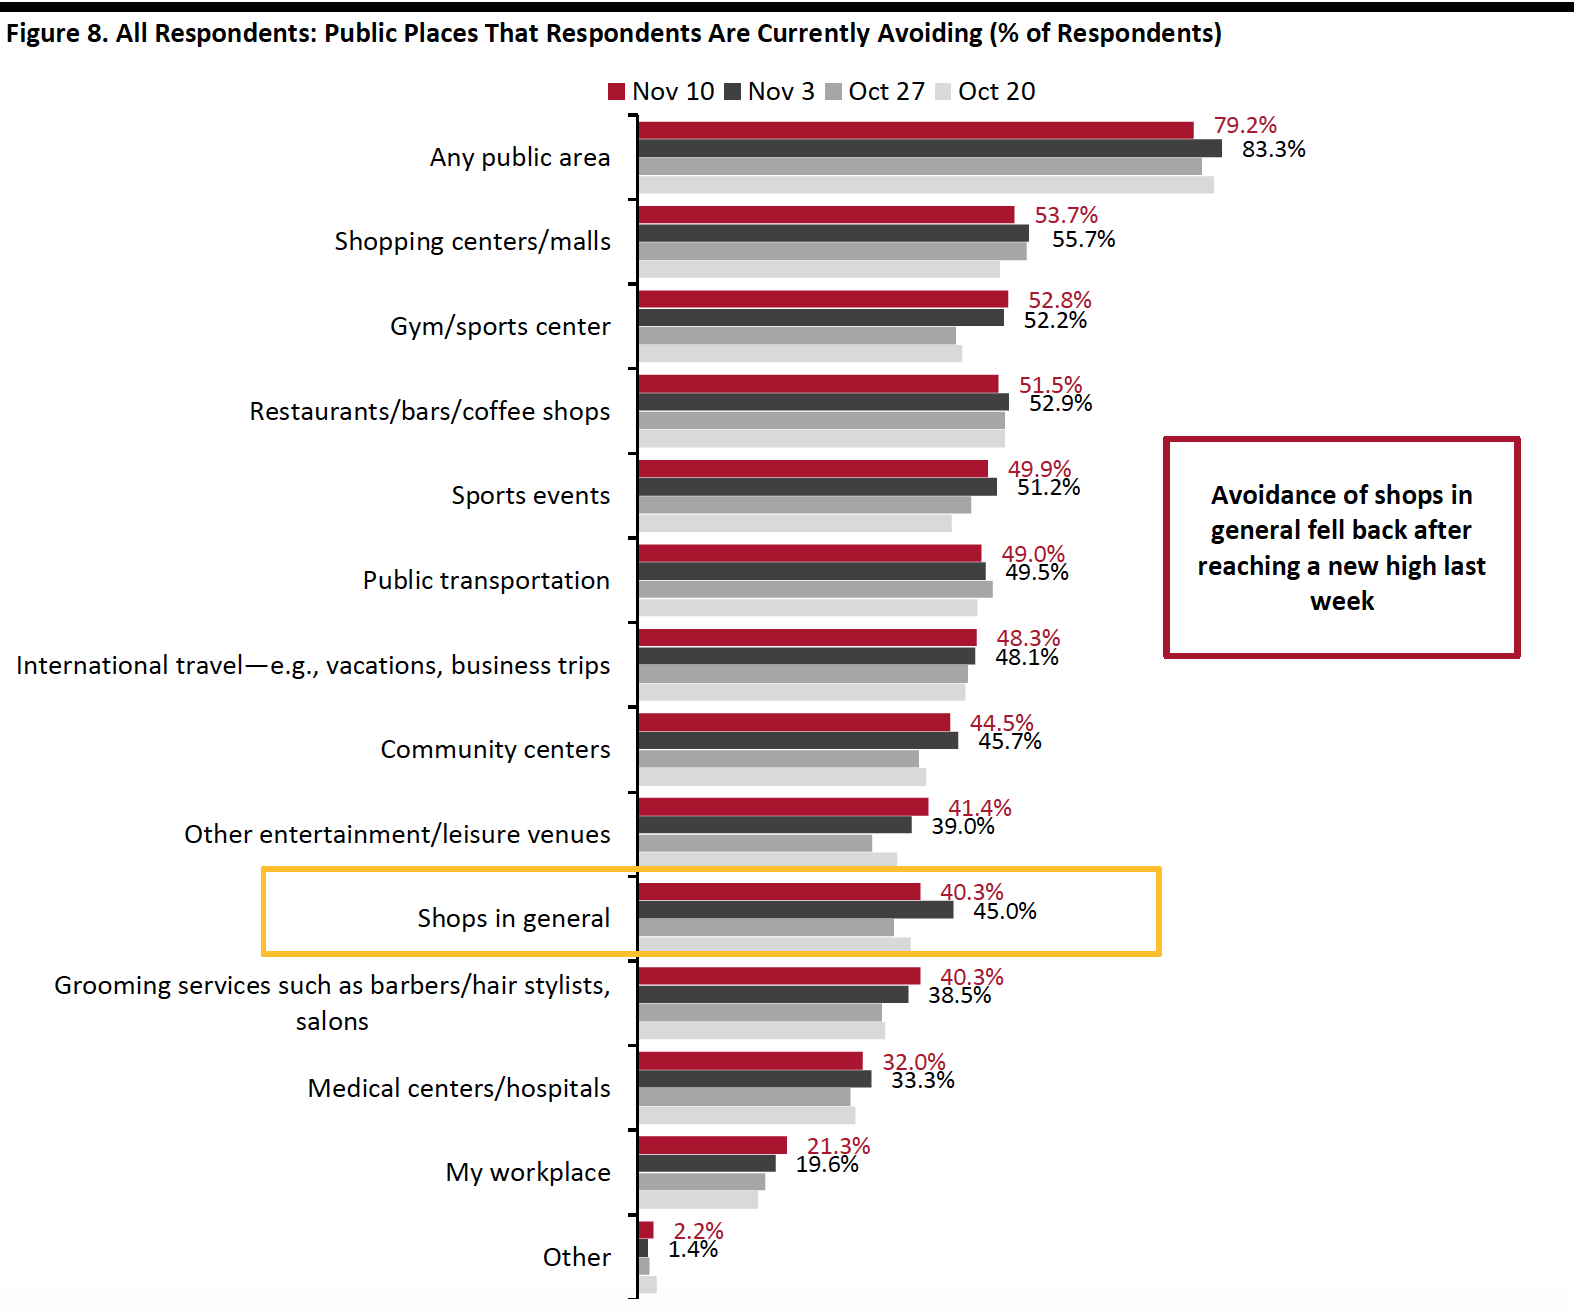
Almost Eight in 10 Are Currently Avoiding Public Places
This week, the avoidance rate of any type of public area dropped slightly after staying above 80% for the past three weeks. Some 79.2% said that they are currently avoiding any public area, versus 83.3% last week. As Covid-19 cases show no signs of slowing, the avoidance rate could remain high in the upcoming weeks.
We saw decreases in the avoidance rate for six of the 13 options provided, although most changes were within the margin of error.
- The proportion of respondents that are currently avoiding shopping centers/malls stood at 53.7% this week, versus 55.7% last week— but malls remain the most-avoided public place.
- Avoidance of shops in general went down this week following a jump last week: Some 40.3% are currently avoiding such places, down almost five percentage points from 45.0% last week.
 Respondents could select multiple options
Base: US respondents aged 18+
Source: Coresight Research[/caption]
Reviewing Trend Data in Current Purchasing Behavior
What Consumers Are Currently Buying More Of and Less Of
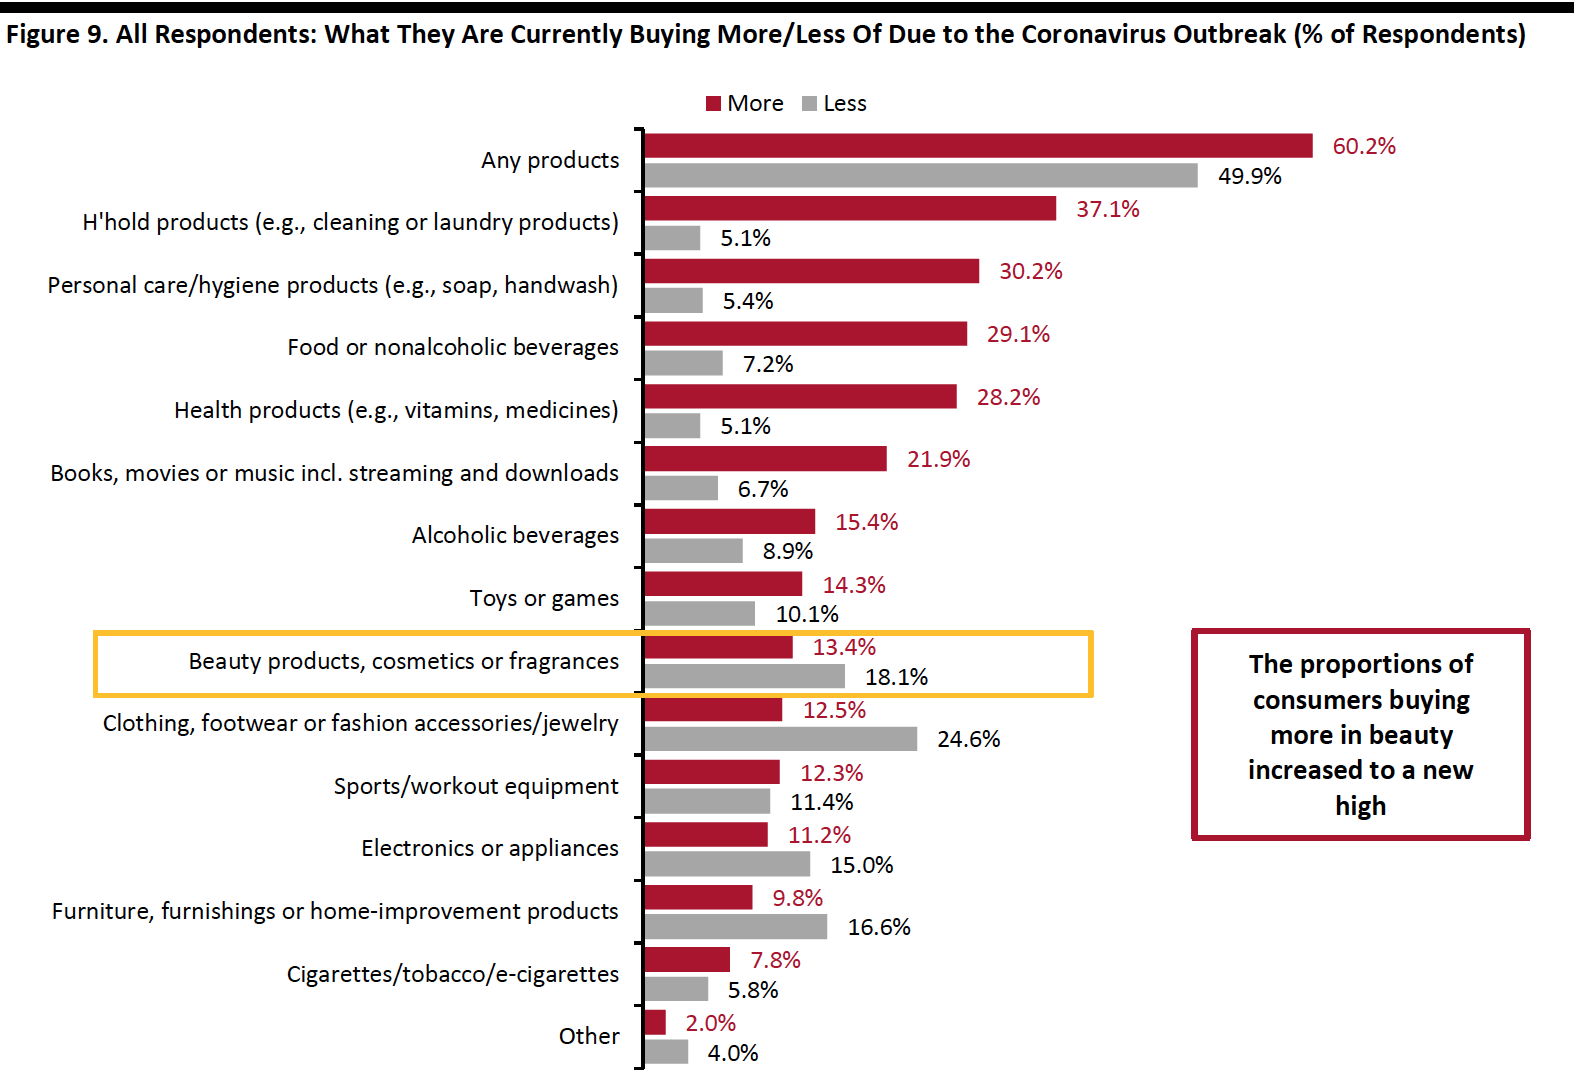
We have seen fluctuation in the proportion of respondents that are currently buying more of any products due to the coronavirus crisis in recent weeks. This week, some 60.2% are currently buying more, down 11 percentage points from 70.8% last week and roughly the same level as two weeks ago. The proportion of respondents that are currently buying less than pre-crisis also returned to the level from two weeks ago, at 49.9%.
- Buying more of certain categories and buying less of certain categories were not mutually exclusive options, so respondents could answer yes to both.
Buying more: Essentials—including household products, personal care and food—saw the largest upswings week over week and remained the most-purchased categories. The proportions of consumers buying more in personal care and food both declined by almost nine percentage points from last week. Beauty is the only discretionary category that saw slightly more consumers buying more than pre-crisis at 13.4%—the highest level we have seen since we started asking this question.
Buying less: Purchases in discretionary categories—including clothing and footwear, beauty and home—all saw week-over-week improvements this week, despite remaining the most-cut categories. One-quarter are currently buying less apparel, down almost five percentage points from 29.2% last week.
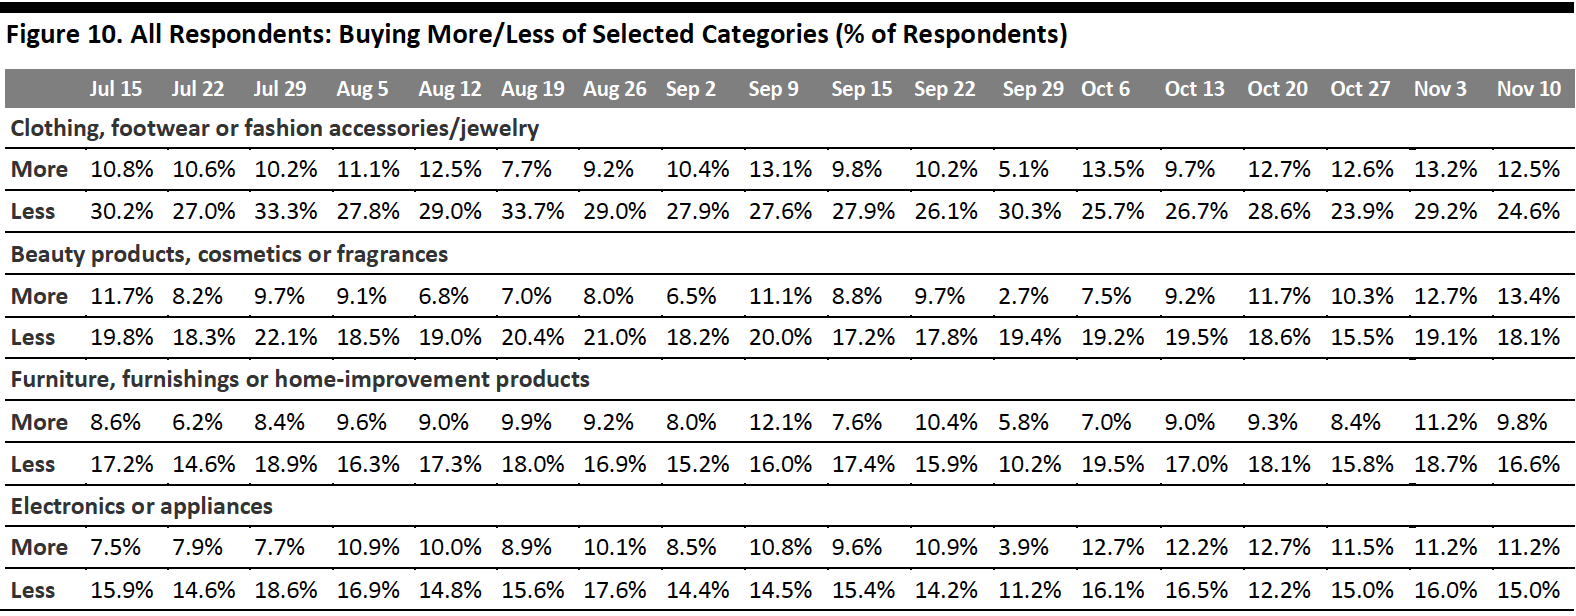
Ratio of less to more: The ratios of the proportions of respondents buying less to the proportions buying more in apparel, beauty and electronics all slid, while home leveled off.
- The ratio for beauty reached an all-time low this week at 1.4, from 1.5 last week. We have witnessed a downward trend of this ratio since October.
- The ratio for clothing and footwear came in at 2.0, down from 2.2 last week.
- The ratio for electronics stood at 1.3, compared to 1.4 last week.
- The ratio for home stayed consistent at 1.7 week over week.
 Respondents could select multiple options
Base: US respondents aged 18+
Source: Coresight Research[/caption] [caption id="attachment_119318" align="aligncenter" width="700"]
 Base: US respondents aged 18+
Source: Coresight Research[/caption]
Almost Three-Quarters Are Switching Spending Online
The proportion of consumers buying more online than they used to stood at 73.8%, versus 74.9% last week. The level was high although the proportion of consumers buying more in any category overall than before the crisis dropped significantly, discussed previously.
[caption id="attachment_119319" align="aligncenter" width="700"]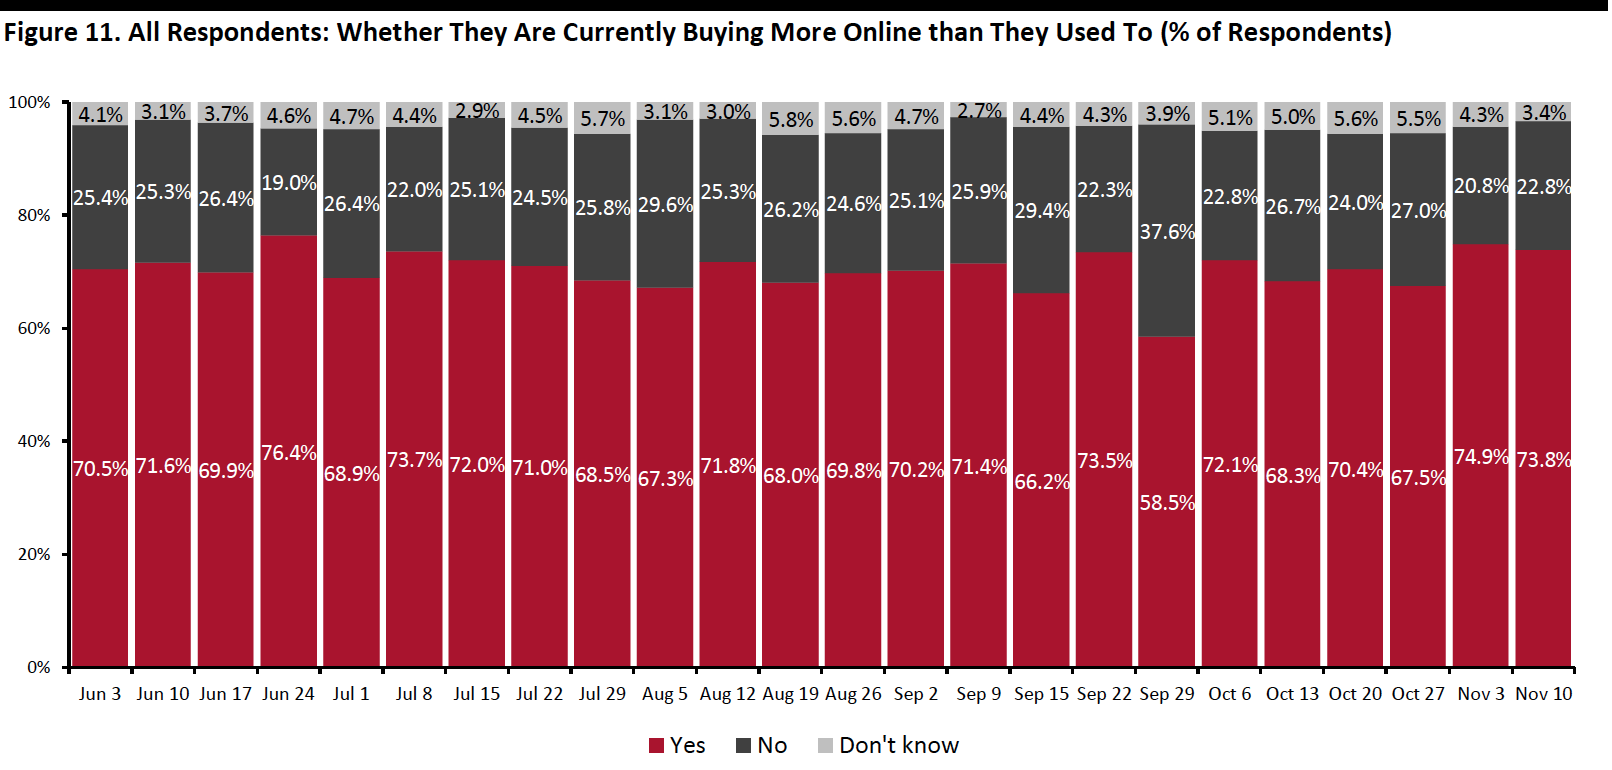 Base: US respondents aged 18+
Source: Coresight Research[/caption]
What Consumers Are Currently Buying More Of Online
Looking at specific categories, almost half of the 13 options we provided saw week-over-week increases in consumers buying more online than pre-crisis, although most of the changes were within the margin of error.
Household products remained the most-purchased category online and saw the largest uptick this week: Some 39.1% are buying more in this category online than pre-crisis, up by seven percentage points to a new high. The proportion of consumers buying more food also went up from 22.2% last week to 28.6% this week, the highest level we have seen since April. However, we saw online grocery shopping in the past two weeks slide slightly, week over week, in a separate question.
Some discretionary categories including clothing, footwear or accessories, beauty, and home fell back a little this week, after peaking last week. We have seen an upward trend in online electronics shopping in the past month. Some 21.5% are buying more electronics online than they used to this week, compared to 15.0% in the week of October 13, a 6.5-percentage-point increase. Toys/games, a popular category for the holiday season, has also seen a near-consistent increasing trend in the past couple of weeks.
[caption id="attachment_119320" align="aligncenter" width="700"]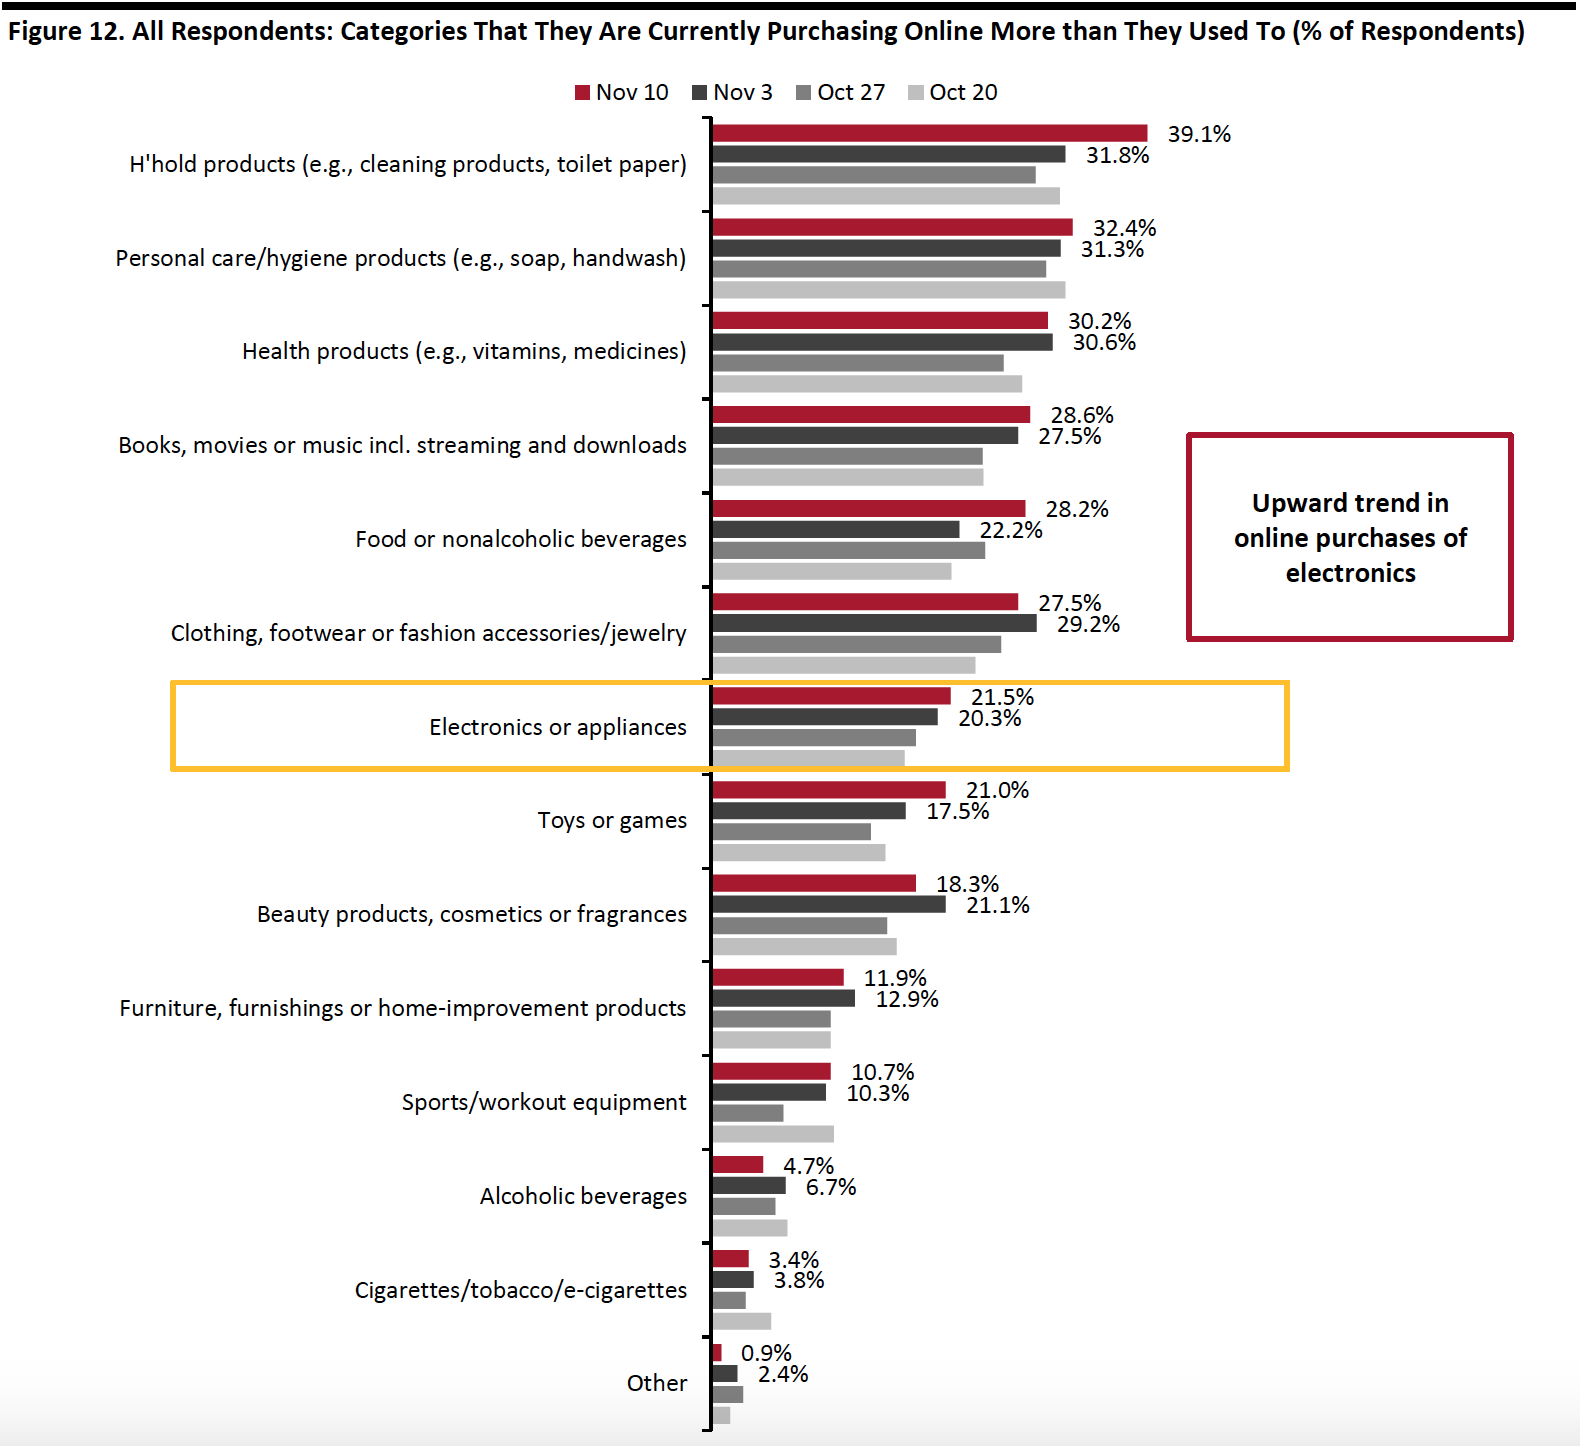 Respondents could select multiple options
Base: US respondents aged 18+
Source: Coresight Research[/caption]
Over Half Expect To Retain Changed Behaviors over the Long Term
We asked respondents whether they think they will keep some of the behaviors they have adopted during the coronavirus crisis in the long term. Some 53.7% of respondents expect to retain some changed behaviors this week, versus half from a month ago, when we last asked this question.
[caption id="attachment_119321" align="aligncenter" width="700"]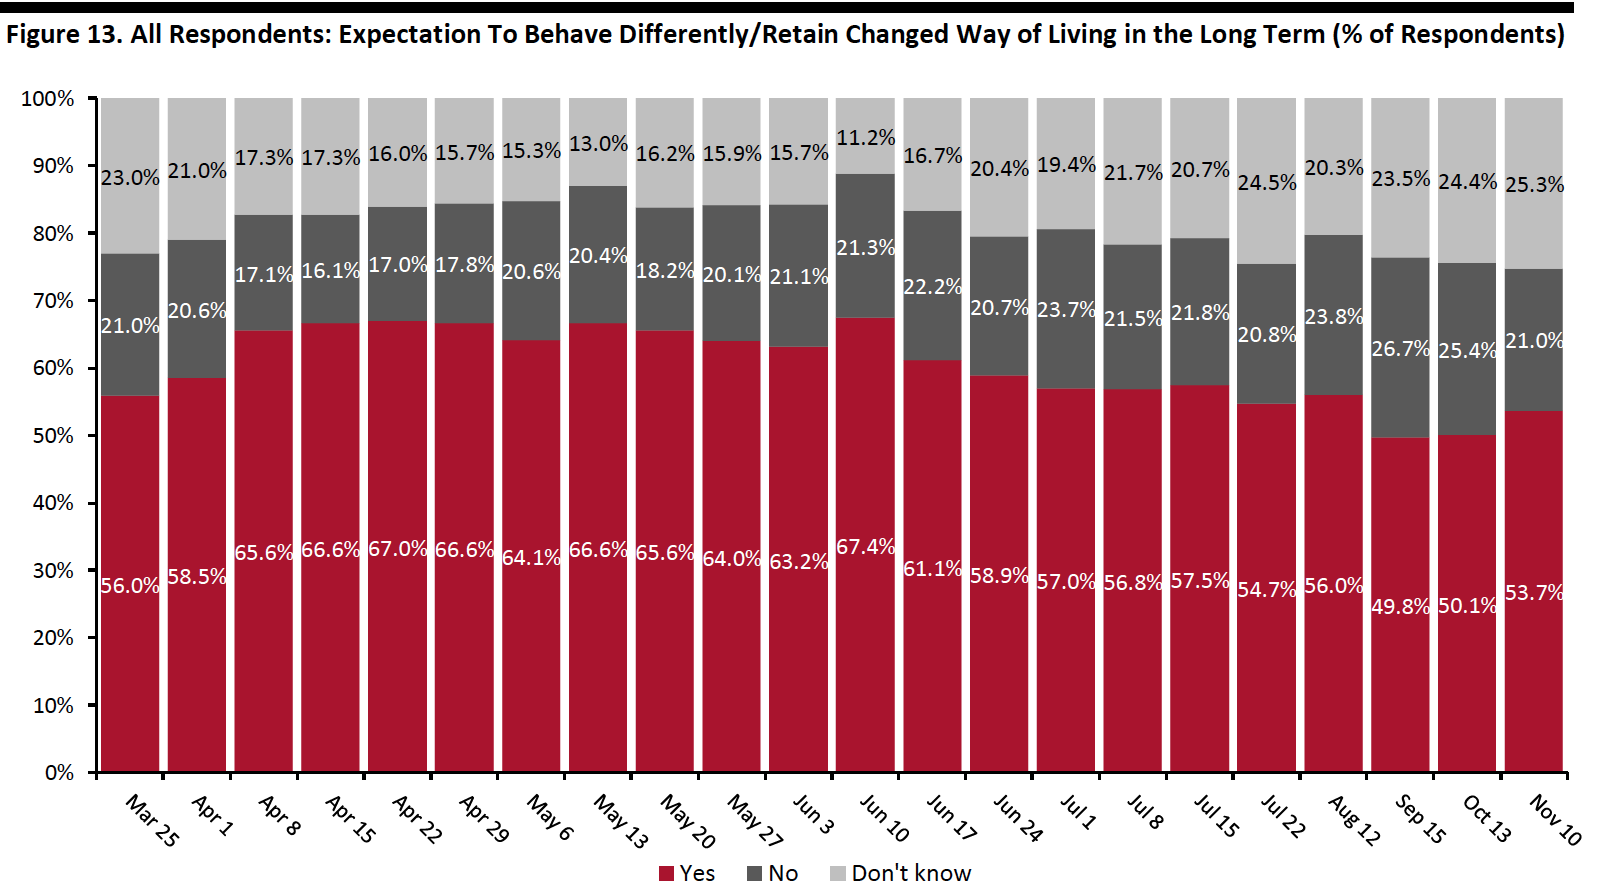 Question not asked on July 29, August 5, August 19, August 26, September 2, September 9, September 15, September 22, September 29, October 6, October 20, October 27, or November 3
Base: US respondents aged 18+
Source: Coresight Research[/caption]
We saw increases in the proportions of all respondents selecting nine of the 11 behavior options we provided, compared to a month earlier, although most changes were within the margin of error.
Having more hygienic practices remained the top behavior to retain in the long term, and the proportion bounced back from last month to 29.3%. Having more food/supplies stockpiled saw the largest uptick of seven percentage points from a month ago.
Many of the options returned to the level we saw two months ago in mid-September: Some 25.7% expect to have less physical interaction in the long term, and some 22.8% plan to use contactless payment in stores more often.
[caption id="attachment_119322" align="aligncenter" width="700"]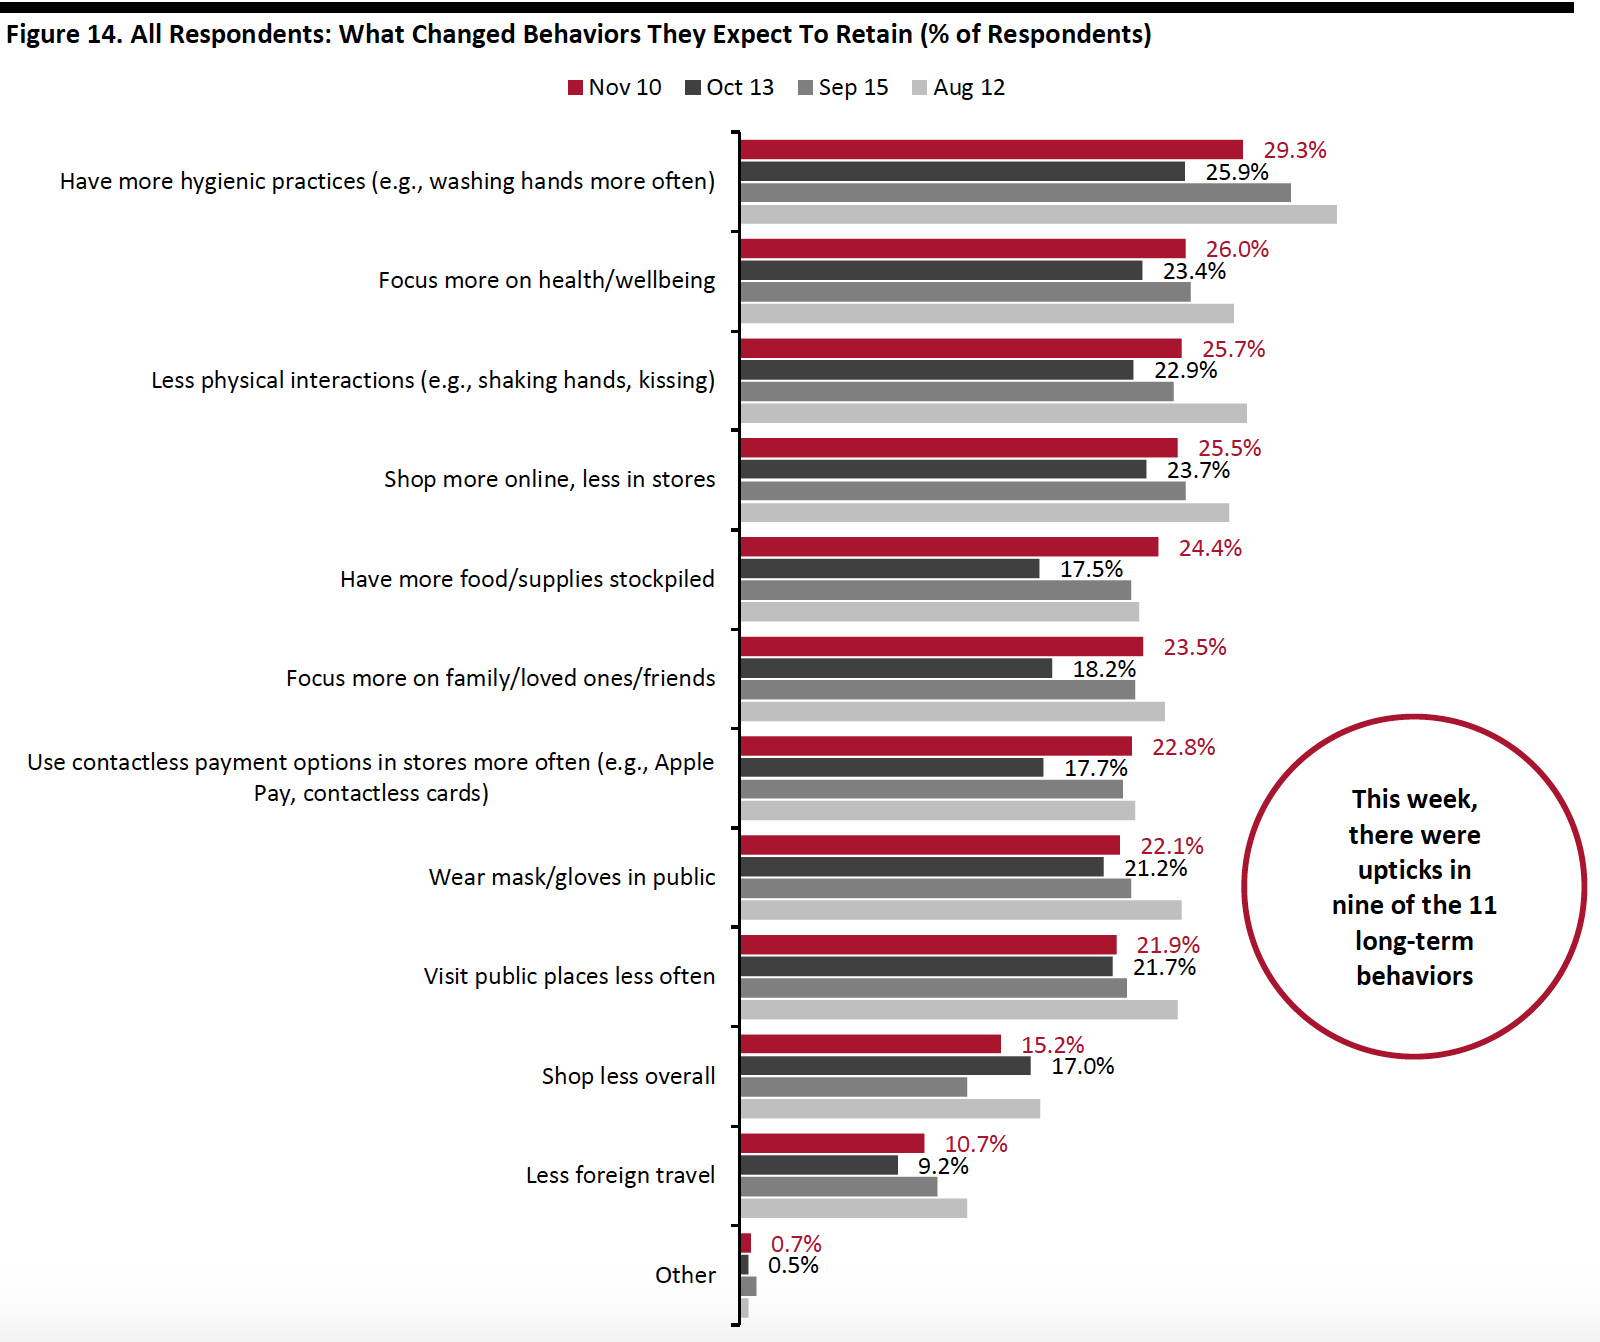 Respondents could select multiple options
Base: US respondents aged 18+
Source: Coresight Research[/caption]
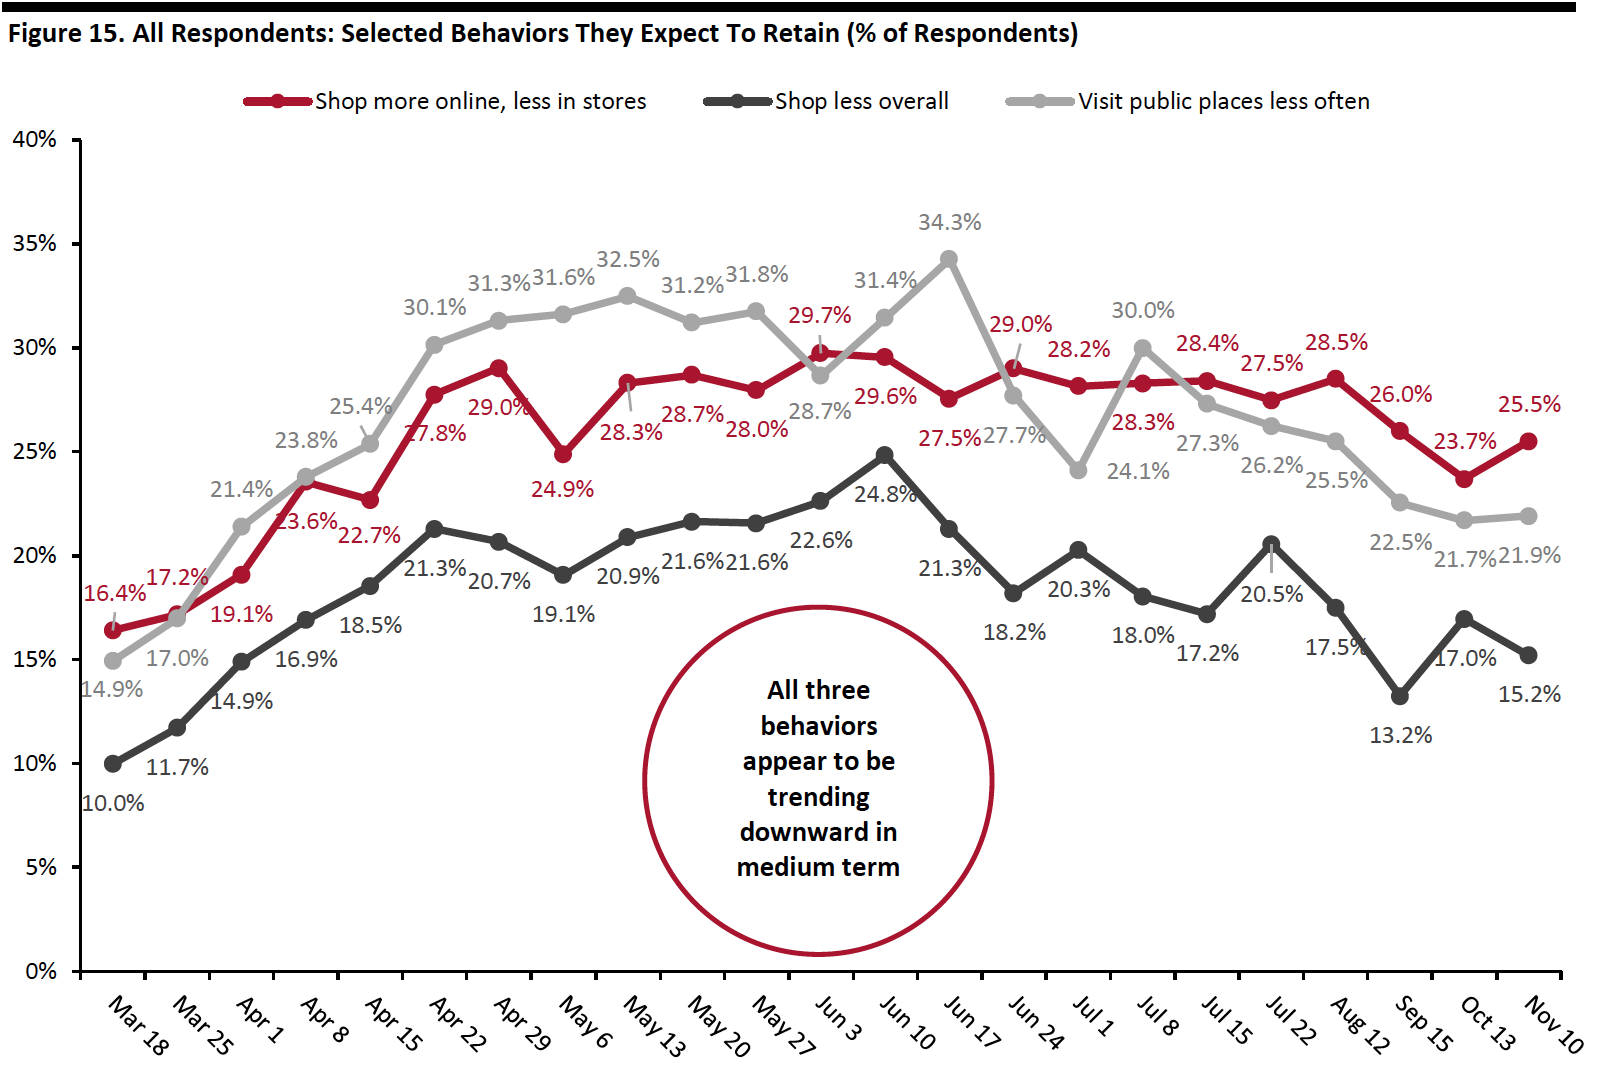
In the chart below, we show trended data in three of the metrics charted above, and the medium-term trends reflect increasing intentions to return to more normal ways of living and shopping, with all three metrics appearing to be well past their peak:
- Roughly one-quarter of respondents expect to shop more online, less in stores in the long term, versus 23.7% a month ago. This behavior has trended downward since peaking at almost 30% of respondents in early June. Compared to other behaviors, shop more online is most likely to be retained by consumers in long term, as it has the smallest difference between its peak and this week’s level.
- The proportion that expect to visit public places less often has leveled off at around 22%, month over month. This behavior has fallen by 12 percentage points from the peak of 34.3% on June 17.
- Some 15.2% plan to shop less overall in the long term, compared to 17.0% last month. Although the figure has been fluctuating slightly, the medium-term trend still looks to be downward, which is encouraging for the retail industry.
 Question not asked on July 29, August 5, August 19, August 26, September 2, September 9, September 15, September 22, September 29, October 6, October 20, October 27, or November 3
Base: US respondents aged 18+
Source: Coresight Research[/caption]
What We Think
As we are now in the holiday season, we saw the highest proportion of consumers saying they expect to start, or have started, holiday shopping earlier than usual, at one-third, compared to prior months’ expectations. The 20-percentage-point difference between holiday shoppers who expect to shop or have started holiday shopping early and those who expect to shop later during the season can be beneficial for brands and retailers to ease pressure on e-commerce fulfillment and further boost sales.
We have seen a consistent proportion of over half of respondents expecting to spend less for the holiday season this year. Nonretail services are expected to take the hardest hit, while we saw improvements in some discretionary categories: One-quarter expect to spend less on electronics, down almost seven percentage points from last month. Home/kitchen products also fell in ranking, with one-fifth planning to spend less than last year.
With almost three in 10 consumers expecting to switch some or all of their holiday spending from stores to e-commerce, brands and retailers can look for innovative ways to engage and interact with consumers online to increase the e-commerce conversion rates. This could include using livestreaming and digital tools such as augmented and virtual reality (AR and VR). We expect holiday-quarter online sales to rise by around one-third year over year.
This week, we saw the following from our recurring weekly questions:
- Apparel: Despite signs that consumers are shopping early for holidays, this week, the proportion that had recently bought apparel online fell, while in-store apparel shopping broadly leveled off. When we look at the figures over two weeks, from October 27 to November 10, the trend is clearer and more consistent. The ratio of buying less to buying more apparel than pre-crisis went up from 1.9 to 2.0, and both the proportions that had bought apparel online and in-store dropped from October 27 to November 10. Apparel remains the number-one category to buy as gifts for the holidays this year, which should correlate to a sequential improvement in metrics for this category as we move further into the season.
- Online Grocery: Online grocery shopping has shown great resilience: We have not seen a major post-lockdown slowdown in shopper numbers—our survey consistently finds roughly 30% of shoppers buying groceries online in the latest two-week period. This week, the proportion of consumers currently buying more food online than pre-crisis jumped to a new high of 28.2%. These positive metrics support our expectation of 60+% year over year growth in online food sales during the holiday period, which will propel full-year 2020 growth to around 75%. See our monthly US CPG Sales Tracker for more data on the trajectory of grocery e-commerce sales in the past months.
- E-Commerce: Around three-quarters of consumers are currently buying more online than they used to. In the long term, roughly one-quarter of respondents expect to retain the habit of shopping more online, less in stores. While this metric has declined slightly since peaking at almost 30% in early June, this downward trend is less substantial than the decline in several other crisis-driven behaviors and supports the expectation that the pandemic has given a permanent boost to structural channel shifts. In the nearer term, we saw three in 10 consumers expect to switch some or all of their holiday spending from stores to e-commerce. See our Holiday 2020: US Shopper Survey for more data on consumers’ holiday shopping expectations, and the US E-Commerce: Post-Crisis Outlook report for more e-commerce data and analysis.
Methodology
We surveyed respondents online on November 10 (447 respondents), November 3 (418 respondents), October 27 (419 respondents), October 20 (409 respondents), October 13 (401 respondents), October 6 (416 respondents), September 29 (412 respondents), September 22 (422 respondents), September 15 (408 respondents), September 9 (406 respondents), September 2 (402 respondents), August 26 (414 respondents), August 19 (416 respondents), August 12 (400 respondents), August 5 (449 respondents), July 29 (403 respondents), July 22 (404 respondents), July 15 (454 respondents), July 8 (410 respondents), July 1 (444 respondents), June 24 (411 respondents), June 17 (432 respondents), June 10 (423 respondents), June 3 (464 respondents), May 27 (422 respondents), May 20 (439 respondents), May 13 (431 respondents), May 6 (446 respondents), April 29 (479 respondents), April 22 (418 respondents), April 15 (410 respondents), April 8 (450 respondents), April 1 (477 respondents), March 25 (495 respondents) and March 17–18 (1,152 respondents). The most recent results have a margin of error of +/- 5%, with a 95% confidence interval. Not all charted week-over-week differences may be statistically significant.