albert Chan
What’s the Story?
This report presents the results of Coresight Research’s latest weekly survey of US consumers, including on the impacts of the coronavirus outbreak, undertaken on August 26, 2020. We explore the trends we are seeing from week to week, following prior surveys on August 19, August 12, August 5, July 29, July 22, July 15, July 8, July 1, June 24, June 17, June 10, June 3, May 27, May 20, May 13, May 6, April 29, April 22, April 15, April 8, April 1, March 25 and March 17–18.
Consumers’ Attitudes to Environmental Sustainability
This week, we asked consumers about their attitudes toward environmental sustainability in retail, including any coronavirus impacts. We asked respondents:
- Whether the coronavirus crisis has made environmental sustainability more or less of a factor to them when shopping—and, if so, why.
- Which types of environmental sustainability they consider to be the most important for retailers. We provided 13 options and asked respondents to select up to three or “no preference.”
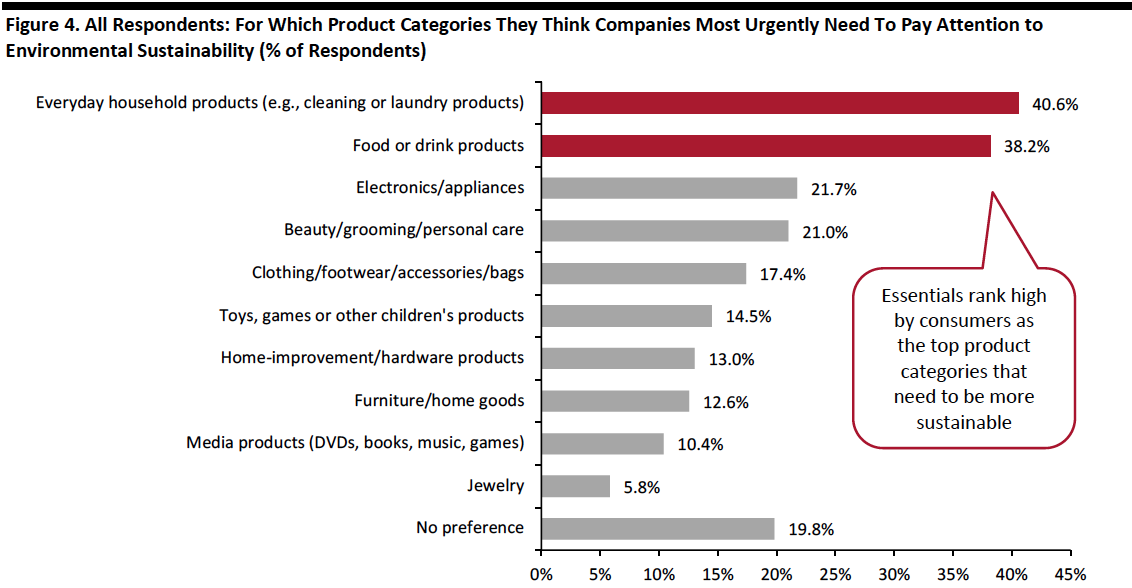
- For which product categories they think companies most urgently need to pay attention to environmental sustainability. We provided 10 options and asked respondents to select up to three or “no preference.”
Three in 10 Said the Crisis Has Made Sustainability More of a Factor When Shopping
A substantial proportion of US consumers have become more focused on sustainability in their shopping journey due to Covid-19: Some 29.0% of respondents said the pandemic has made environmental sustainability more of a factor when shopping. This compares to 15.7% that stated that the crisis made sustainability less of a factor.
By age, the proportion that views sustainability as a more important factor when shopping peaked at one-third in the 18–29 age group. However, consumers that said sustainability has become less of a factor when shopping also peaked, at one-fifth, in this age group; this could be because young consumers tend to have lower incomes and may be more vulnerable to job cuts.
Despite a meaningful proportion of consumers valuing sustainability more because of the crisis, the highest response in terms of the impact of Covid-19 on sustainability in purchasing decisions was nevertheless “no change.”
[caption id="attachment_115559" align="aligncenter" width="700"]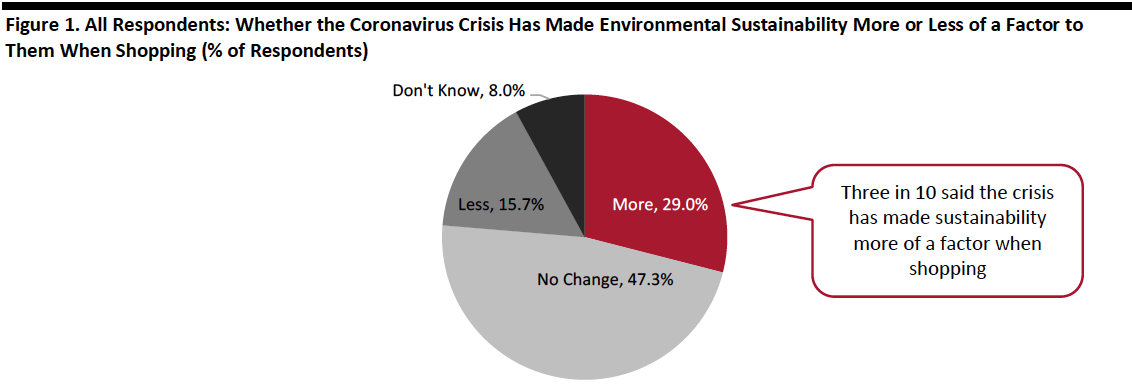 Base: US Internet users aged 18+
Source: Coresight Research[/caption]
Among those who said the crisis has made sustainability more of a factor, over half said the reason is that they have reflected on what is most important. Some 45.0% also said that their change in attitude on sustainability is because lockdown showed the immediate impact of changed behavior on the planet. For example, with fewer cars on the road, flights canceled and factories closed, air quality has improved.
Among those who said the crisis has made sustainability less of a factor, the main reason is that other things have taken priority amid the pandemic. Some 36.9% said they are too worried about the crisis to pay attention to sustainability, and one-third said that avoiding the virus has taken priority. Some 27.7% also stated that saving money has become priority, as eco-friendly products are generally more costly than traditional ones.
[caption id="attachment_115560" align="aligncenter" width="700"]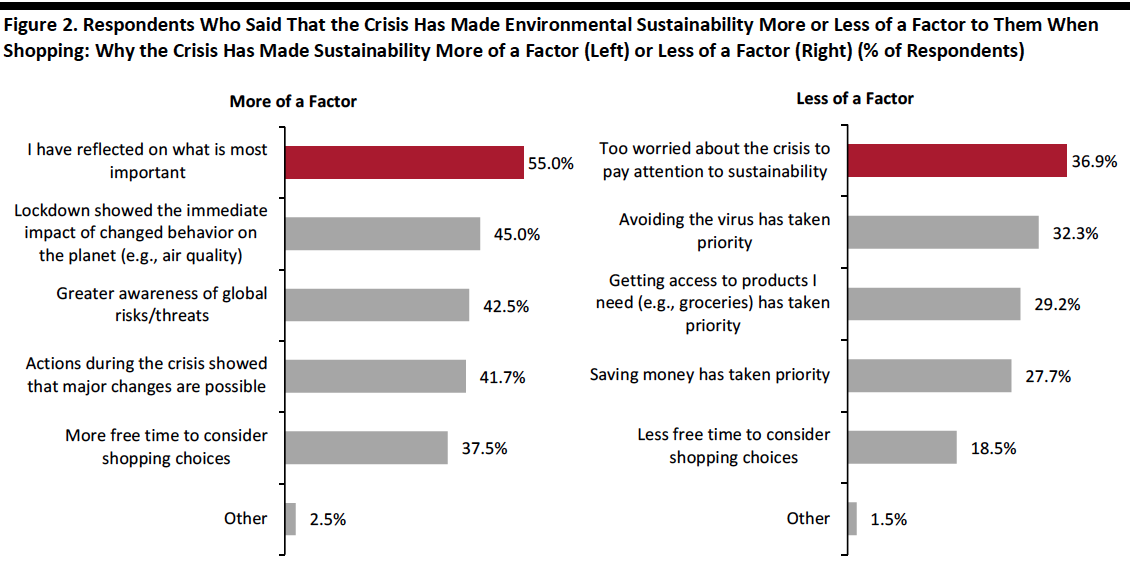 Respondents could select multiple options
Base: US Internet users aged 18+ who said the crisis has made environmental sustainability more of a factor (left) or less of a factor (right)
Source: Coresight Research[/caption]
Reducing Plastics Is Considered the Most Important Practice for Retailers
Away from the Covid-19 impact, we asked consumers what they consider to be the most important sustainability issues for retailers. Reducing plastics took the lead. This could include single-use plastic bags, bottles, straws and packaging.
Packaging is a huge concern for consumers in terms of sustainability. Making packaging biodegradable, recyclable or reusable was ranked the second-most important sustainability action for retailers, followed by reducing packaging. Consumers also expect retailers to use recycled materials not just in packaging but also in new products.
In general, consumers seem more concerned with the issue of product and packaging disposal for the end-products they can see than the supply chain impacts that they don’t see—such as use of chemicals, use of water and carbon emissions.
- We asked respondents to pick up to three options or “no preference,” potentially depressing the total percentages.
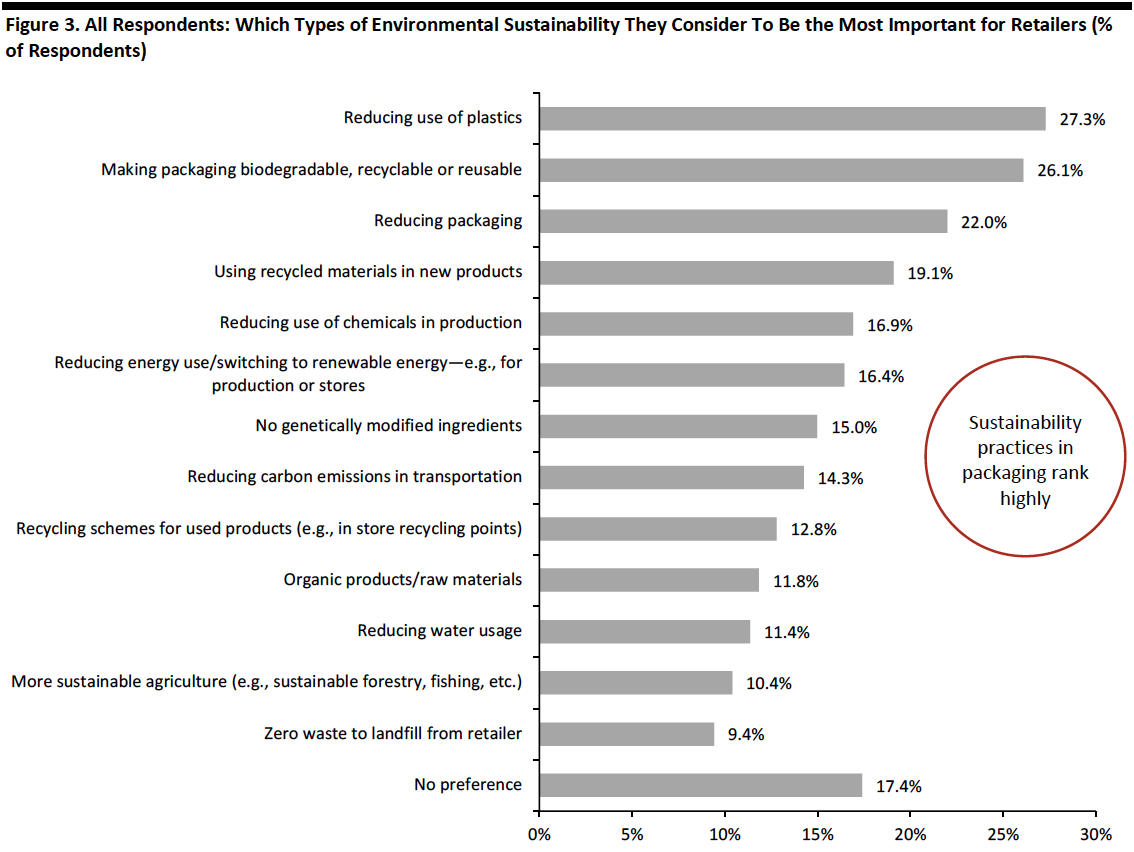 Respondents could select up to three options or “no preference”
Base: US Internet users aged 18+
Source: Coresight Research[/caption]
Essential Products Rank as the Top Categories That Need To Be More Sustainable
Many of the conversations around sustainability in retail have focused on apparel. However, consumers deem several other categories to be in greater need of sustainability efforts. Everyday essentials are the top product categories for which consumers think companies most urgently need to pay attention to environmental sustainability. Four in 10 respondents viewed household products as the number-one category that needs to be more sustainable, followed by food or drink products (38.2%).
Electronics or appliances is the top discretionary category that requires companies’ attention on sustainability, with 21.7% of respondents reporting this—around half the proportion that selected household products. This is followed by beauty or personal care products (21.0%) and clothing, footwear or accessories (17.4%).
- We asked respondents to pick up to three options or “no preference.”
 Respondents could select up to three options or “no preference”
Base: US Internet users aged 18+
Source: Coresight Research[/caption]
Together, the findings shown in Figure 4 align with those in Figure 3: Consumers look to be most concerned about packaging and products that will end up in landfill, including plastics—and, for most consumers, food products and other fast-moving consumer goods will be the most frequently used such products. In the near term, the Covid-19 crisis may appear to have prompted the suspension of some concerns about sustainability—as consumers opted for prepackaged food as well as disposable wipes, gloves and masks—yet our data suggest just over three-quarters of all consumers either haven’t changed their view or now consider sustainability more of a priority (Figure 1).
What Shoppers Are Doing and Where They Are Going
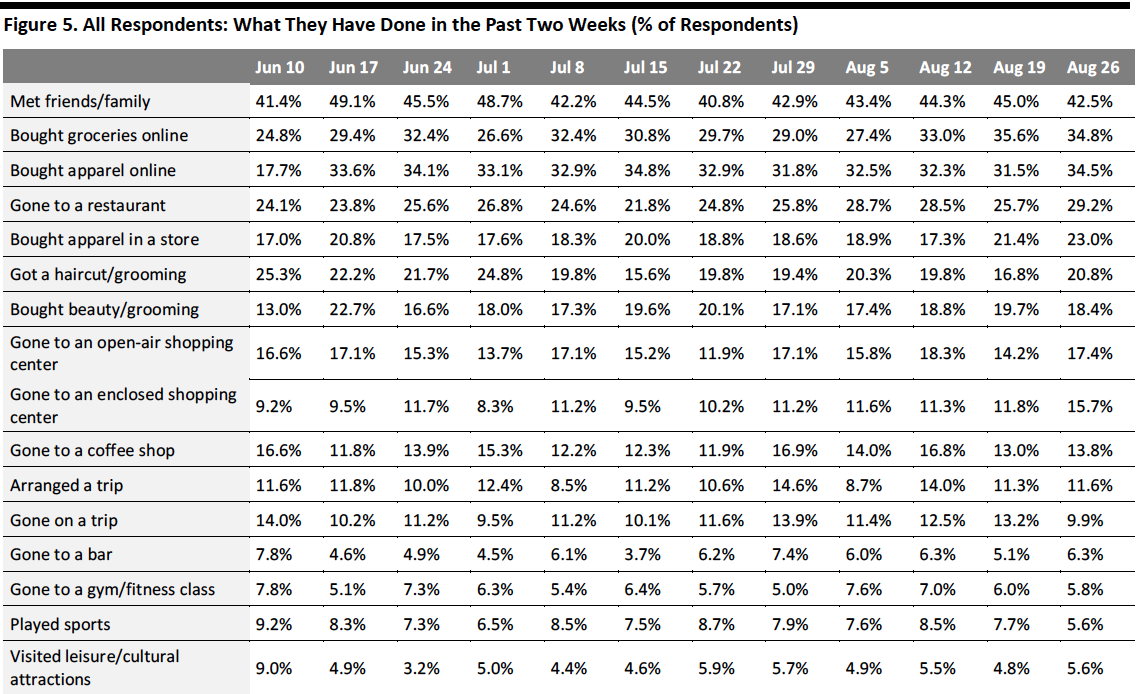
In-Store Apparel Shopping in the Past Two Weeks Reaches a New High
Each week, we ask consumers what they have done in the past two weeks. This week, the proportions of respondents increased for around half of the 16 options we provided for activities done recently—although all such changes were within the margin of error.
- For the third week running, online grocery shopping remained more popular than online apparel shopping, although the two figures are very close. The proportion of respondents that had bought groceries online stayed relatively stable, at around 35.0% this week.
- Some 34.5% respondents had bought apparel online in the past two weeks, slightly higher than 31.5% last week. This is aligned with the increasing level of consumers that are currently buying more apparel online than before the pandemic (discussed later in the report). The proportion of consumers that had bought apparel in a store also went up again slightly this week to 23.0%—the highest level since we started asking the question.
- The proportion of respondents that had visited an open-air shopping center rebounded after declining last week. Around one in six had visited this type of public place this week. The proportion of consumers that visited an enclosed shopping mall also jumped to a new high: Some 15.7% had done so this week. The proportion of respondents that had visited an enclosed mall also crept closer to those that visited an open-air mall.
 Respondents could select multiple options
Base: US Internet users aged 18+
Source: Coresight Research[/caption]
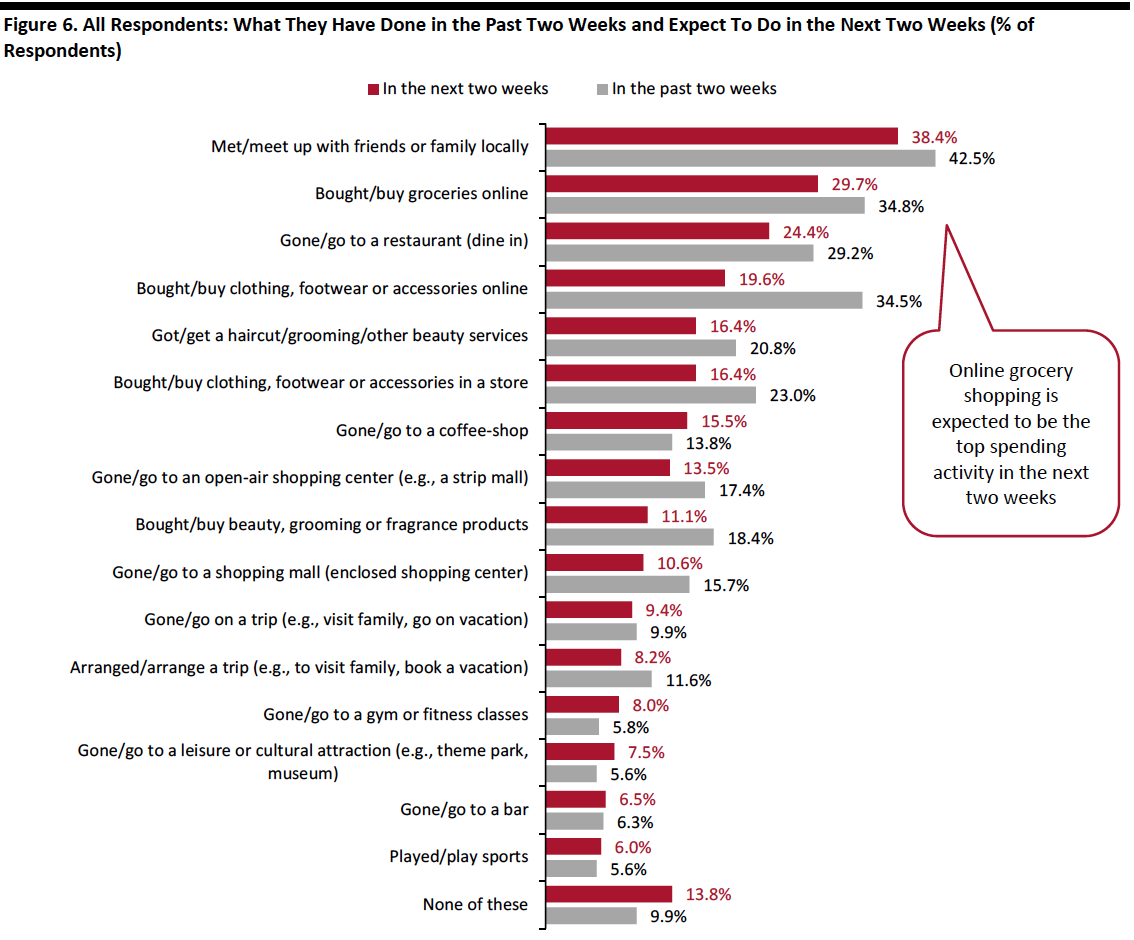
Online Grocery Shopping Is Expected To Be the Top Spending Activity
Each week, we ask consumers what they expect to do in the next two weeks, with a comparable set of options to those for the last two weeks. In the chart below, we compare these short-term expectations with recent actual behavior.
We saw slightly lower proportions of consumers expecting to do 10 of the 16 options we provided for activities in the next two weeks than actual behavior in the past two weeks.
- Online grocery shopping continues to be the top spending activity in the next two weeks, with three in 10 planning to do so, five percentage points lower than the actual behavior of such activity in the last two weeks.
- One-fifth expect to buy clothing or footwear online in the next two weeks, and 16.4% plan to do so in a store. Only 11.1% expect to purchase beauty products. We are likely to see higher proportions in actual behaviors of these shopping activities, as consumers typically do not plan discretionary purchases in advance; and, previous weekly surveys have suggested that actual behavior typically exceeds expected behavior for apparel shopping.
- Dining in a restaurant remains the second-most expected spending activity for the next two weeks, even though the expectation is lower than actual behavior. Slightly more consumers plan to go to a coffee shop in the next two weeks. We expect to see increased visits in food-service locations, as the current avoidance rate of such locations fell significantly, which we discuss in the next section of this report.
 Respondents could select multiple options
Base: US Internet users aged 18+
Source: Coresight Research[/caption]
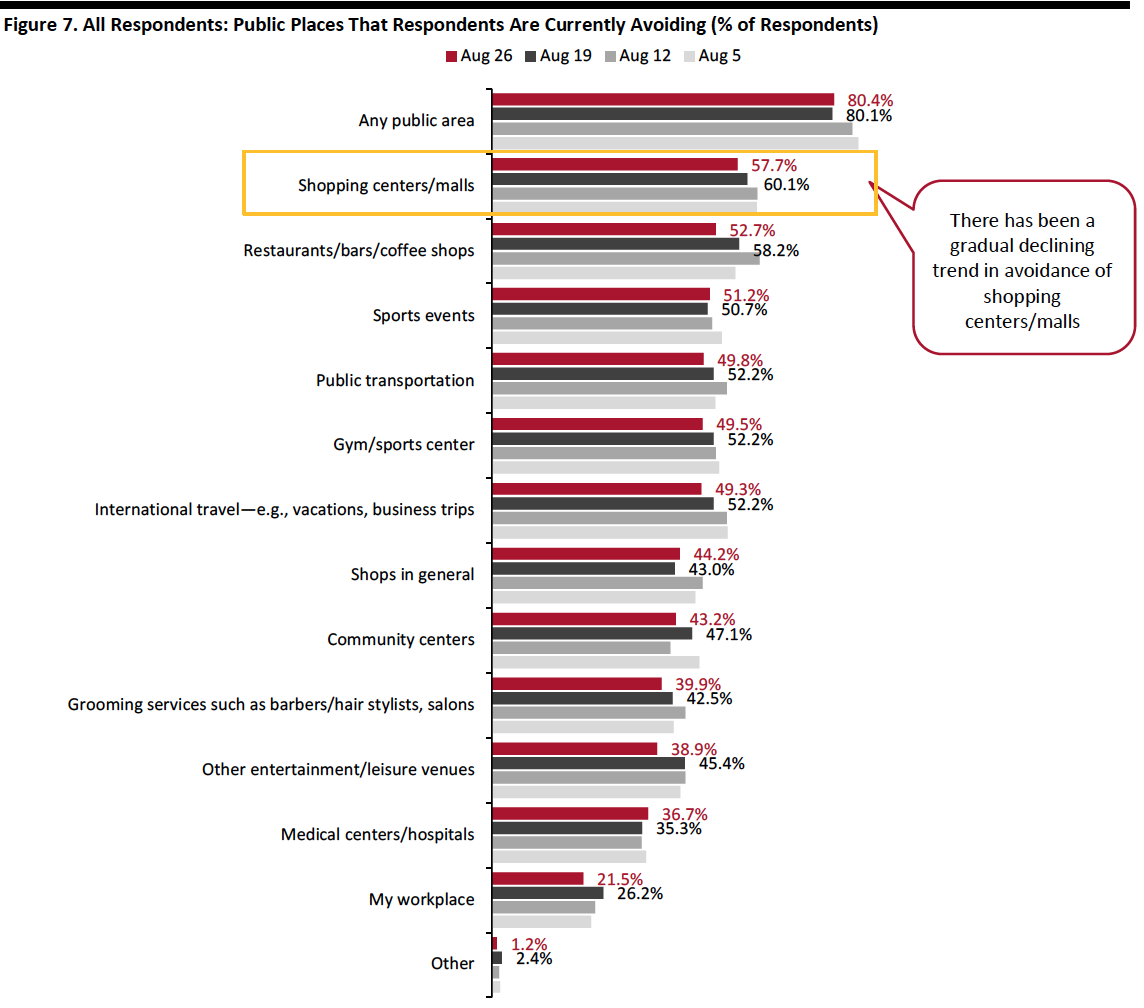
Eight in 10 Are Currently Avoiding Public Places
This week, the proportion of respondents saying that they are avoiding any type of public area was broadly level with that from last week, at around 80%.
We saw slight decreases in avoidance for around 10 of the 12 options provided, although most of the changes were within the margin of error:
- The proportion of respondents that are currently avoiding shopping centers/malls slid slightly again this week, to 57.7% this week, compared to six in 10 last week. Although the rate remains high, we have seen a gradual declining trend in the avoidance rate of malls—the rate has dropped roughly eight percentage points from the peak of two-thirds on July 22. This is aligned with the previous finding of increases in visits for both types of shopping malls.
- The proportion of respondents that are currently avoiding food-service locations fell back again, by almost six percentage points. Some 52.7% are currently avoiding restaurants/bars/coffee shops, down from 58.2% last week. This is also the lowest level we have seen since the end of June.
- Entertainment and leisure venues saw the highest decline in avoidance this week, of almost seven percentage points: Some 38.9% of respondents are currently avoiding these places, versus 45.4% last week.
 Respondents could select multiple options
Base: US Internet users aged 18+
Source: Coresight Research[/caption]
Reviewing Trend Data in Current Purchasing Behavior
What Consumers Are Currently Buying More Of and Less Of
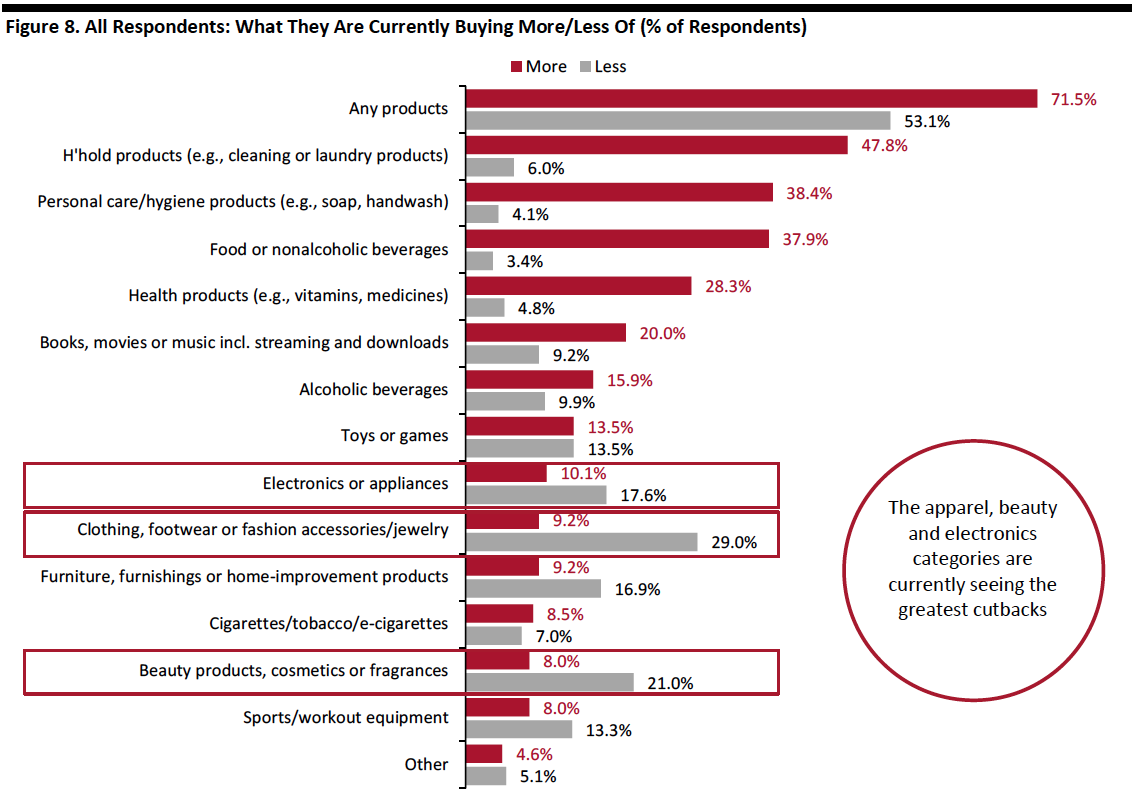
The proportion of respondents that are currently buying more of any category jumped significantly this week—by almost nine percentage points to 71.5%, from 63.0% last week. The proportion of respondents that are currently buying less broadly leveled off at 53.1% this week.
- Buying more of certain categories and buying less of certain categories were not mutually exclusive options, so respondents could answer yes to both.
Buying more: Essentials, including household products, food and personal care, still ranked as top categories that consumers are currently buying more of. The proportions in all three categories increased this week after declining last week.
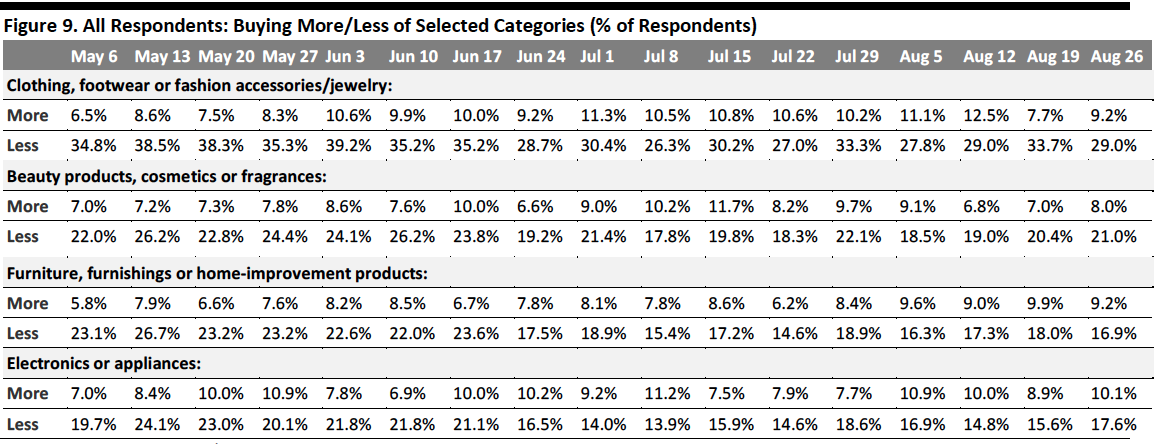
Buying less: We have seen fluctuations in the proportions of respondents buying less in discretionary categories over the past couple of weeks. This week, we saw the proportion of consumers buying less in apparel bounce back to the level of two weeks ago—some 29.0% are currently spending less on apparel, versus one-third last week. The proportions of respondents buying less in other discretionary categories, including beauty and electronics, increased slightly week over week.
Ratio of less to more: The ratios of the proportions of respondents buying less to the proportions buying more in all discretionary categories listed in Figure 9 (except the home category) saw declines.
- The ratio for apparel fell back to 3.2, after jumping to 4.4 last week.
- The ratio for electronics stood at 1.7, versus 1.8 last week.
- The ratio for beauty stood dropped to 2.6 this week, from 2.9 last week.
- The ratio for home remained stable at 1.8 this week.
 Respondents could select multiple options
Base: US Internet users aged 18+
Source: Coresight Research[/caption] [caption id="attachment_115567" align="aligncenter" width="700"]
 Base: US Internet users aged 18+
Source: Coresight Research[/caption]
Seven in 10 Are Switching Spending Online
This week, we saw the proportion of consumers buying more online than they used to increase a little. Seven in 10 consumers stated that they are buying more online than they used to this week, versus 68.0% last week (this change is within the margin of error).
The change in online shopping is minimal, compared to the uptick in consumers buying more of any category (discussed above). This may reflect that consumers are shifting their additional purchases back to physical stores, as we saw rising proportions of consumers that had shopped for apparel in-store and visited shopping malls recently in findings mentioned earlier in this report.
[caption id="attachment_115568" align="aligncenter" width="700"]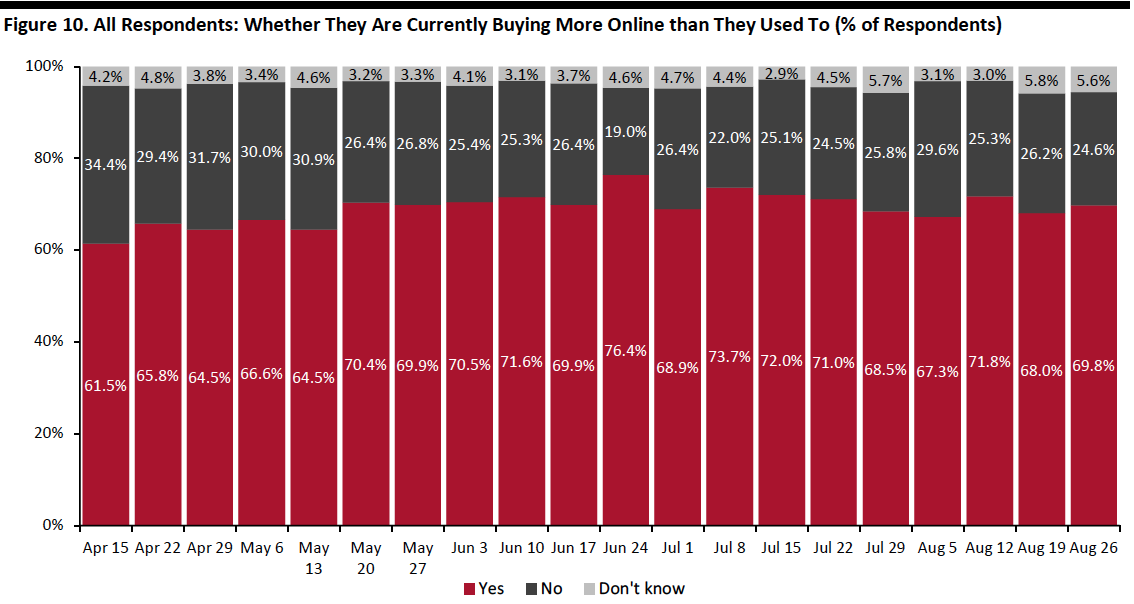 Base: US Internet users aged 18+
Source: Coresight Research[/caption]
What Consumers Are Currently Buying More Of Online
This week, we saw increases in the proportions of consumers that are currently buying more online than they used to in eight of the 13 categories, driven by purchases of essential products. Household products saw the largest uptick, of six percentage points, after a decline last week, with one-third saying they are currently buying more online. Health products also jumped significantly by five percentage points to become the third-most-purchased online product category this week.
Food is the only essentials category that saw a slight decrease this week, after reaching the highest level last week. One-quarter are buying more food online, versus 27.6% last week.
The proportion of consumers that are currently buying more apparel online went up slightly this week, to one-quarter from 23.8% last week. The proportion of respondents that are currently buying more beauty also increased slightly, while other discretionary categories, including home and electronics, remained fairly stable this week.
[caption id="attachment_115569" align="aligncenter" width="700"]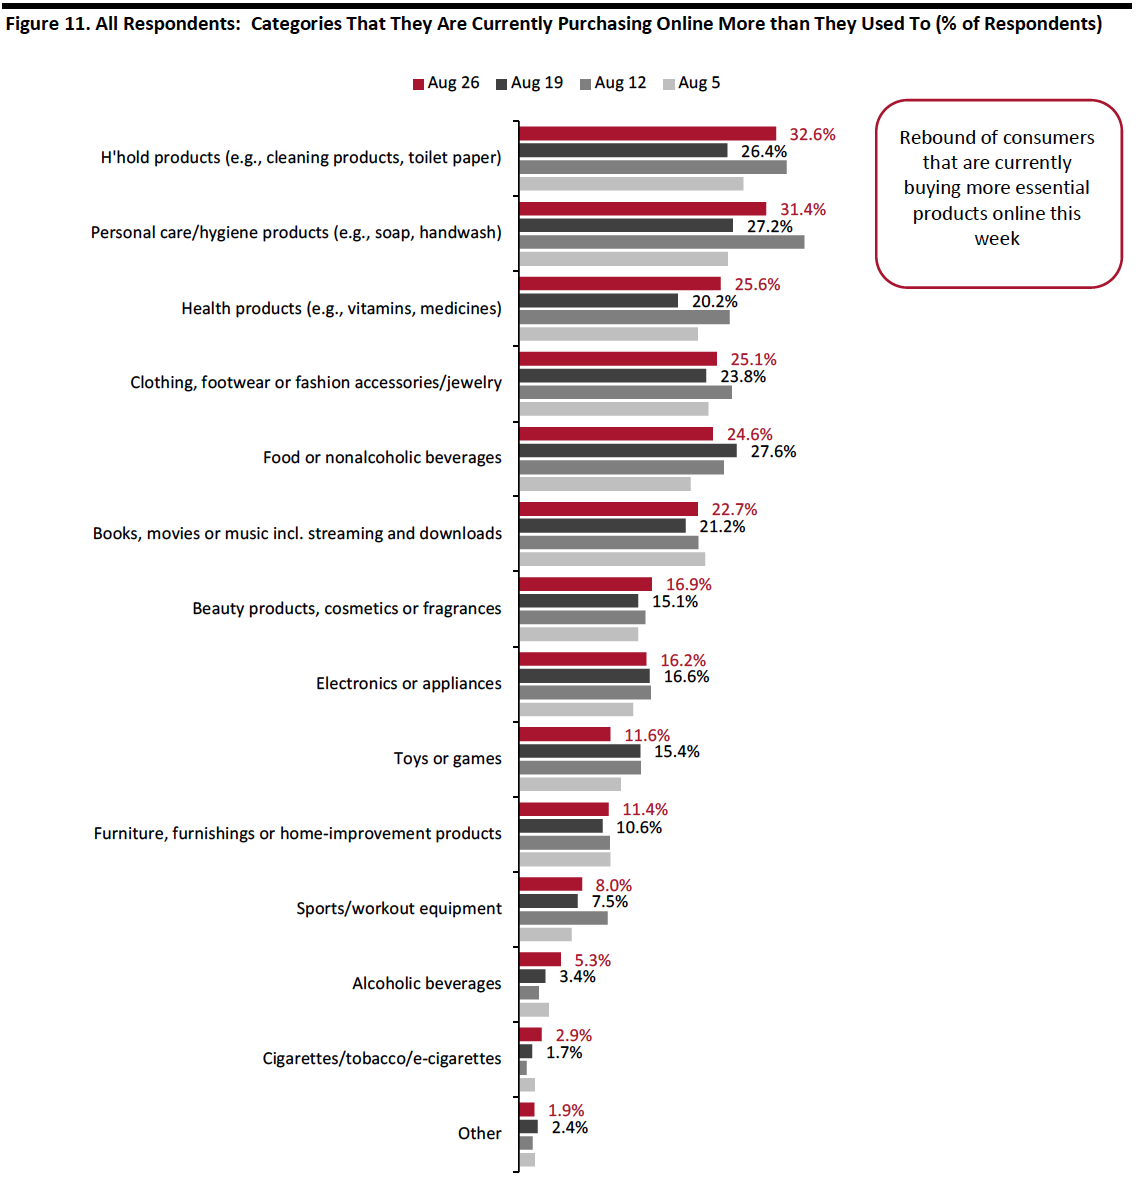 Respondents could select multiple options
Base: US Internet users aged 18+
Source: Coresight Research[/caption]
What We Think
Implications for Brands and Retailers
Our survey results suggest that the coronavirus outbreak has increased the importance of sustainability when shopping for a substantial proportion of consumers—three in 10 said the pandemic has made sustainability more of a factor for them when shopping. Almost half said the pandemic had not impacted their attitude toward sustainability, despite a proliferation of disposable masks and gloves. Brands and retailers should continue to adopt eco-friendly, sustainable practices:
- Product packaging is considered the most important area in terms of sustainability, as it is ubiquitous in consumers’ daily lives. Retailers should switch from single-use plastics to biodegradable and recyclable materials for packaging, and aim to remove unnecessary packaging—especially plastic—which can also help lower packaging costs. Retailers can leverage technology to provide innovative packaging solutions. For example, clothing brand Reformation delivers its online orders in vegetable-material bags that are completely compostable.
- Brands and retailers can employ circular models to reduce their environmental impact while fulfilling consumer demand. Recycling programs enable products to be reused, and have become common among fashion retailers. For example, apparel brand Everlane develops cashmere clothing using recycled materials.
- Sustainable production practices, such as reducing the use of chemicals and water and switching to renewable energy, can result in long-term cost reductions and improved efficiency.
This week, we also saw the following:
- Apparel: Online shopping for apparel remains at an elevated level—34.5% of consumers had bought apparel online in the two weeks prior to the survey. In addition, one-quarter are currently purchasing more apparel online than pre-crisis. Although online is still the preferred channel over physical retail, we have seen an increasing proportion of consumers that have purchased apparel in-store—Some 23% had done so in the past two weeks, the highest level since we started asking the question. Apparel remains the most-cut category, with slightly fewer consumers reporting that they are currently purchasing less apparel than the proportion last week.
- Online Grocery: Online grocery shopping maintains its appeal among consumers—a stable proportion of around 35% of respondents had bought groceries online in the past two weeks, and it is expected to be the top spending activity for the next two weeks. For more data on the trajectory in grocery e-commerce, see our forthcoming monthly US CPG Tracker report. Also see our weekly survey report from last week, in which we asked respondents in more detail about shopping for groceries online.
- E-Commerce: This week, we found that seven in 10 consumers said that they are currently buying more online than they used to, versus 68% last week. The change is minimal, in contrast to a spike in consumers who are currently buying more of any category, reflecting that consumers may return to in-store shopping for their additional purchases. We expect e-commerce levels to remain high as we move toward the holiday season peak.
Methodology
We surveyed respondents online on August 26 (414 respondents), August 19 (416 respondents), August 12 (400 respondents), August 5 (449 respondents), July 29 (403 respondents), July 22 (404 respondents), July 15 (454 respondents), July 8 (410 respondents), July 1 (444 respondents), June 24 (411 respondents), June 17 (432 respondents), June 10 (423 respondents), June 3 (464 respondents), May 27 (422 respondents), May 20 (439 respondents), May 13 (431 respondents), May 6 (446 respondents), April 29 (479 respondents), April 22 (418 respondents), April 15 (410 respondents), April 8 (450 respondents), April 1 (477 respondents), March 25 (495 respondents) and March 17–18 (1,152 respondents). The most recent results have a margin of error of +/- 5%, with a 95% confidence interval. Not all charted week-over-week differences may be statistically significant.