albert Chan
We discuss select findings and compare them to those from prior weeks: July 29, July 22, July 15, July 8, July 1, June 24, June 17, June 10, June 3, May 27, May 20, May 13, May 6, April 29, April 22, April 15, April 8, April 1, March 25 and March 17–18.
1. Bill Payments Are the Top Category for Stimulus-Check SpendingThis week, we asked consumers how they had spent their first stimulus check and how they expect to spend any second stimulus check. Below, we focus on how respondents spent money from the first round.
Around three-quarters of respondents said that they had received a stimulus check. Bills, food, personal loans, savings and housing were some of the top categories on which these consumers had spent their first check.
Some 44% had spent their stimulus checks on bills, including for utilities, cellphone, cable TV and vehicle. Over one-third had used the stimulus money for food, such as groceries, eating out and takeout.
Home improvement is the number-one retail category that consumers had spent their checks on, while stimulus spending on other discretionary products was low: Only 6% had spent on beauty, and 5% on clothing, footwear or accessories.
- See our full report for complete results of how US consumers spent their first stimulus checks. We also discuss findings on how consumers are planning to spend any future stimulus checks.
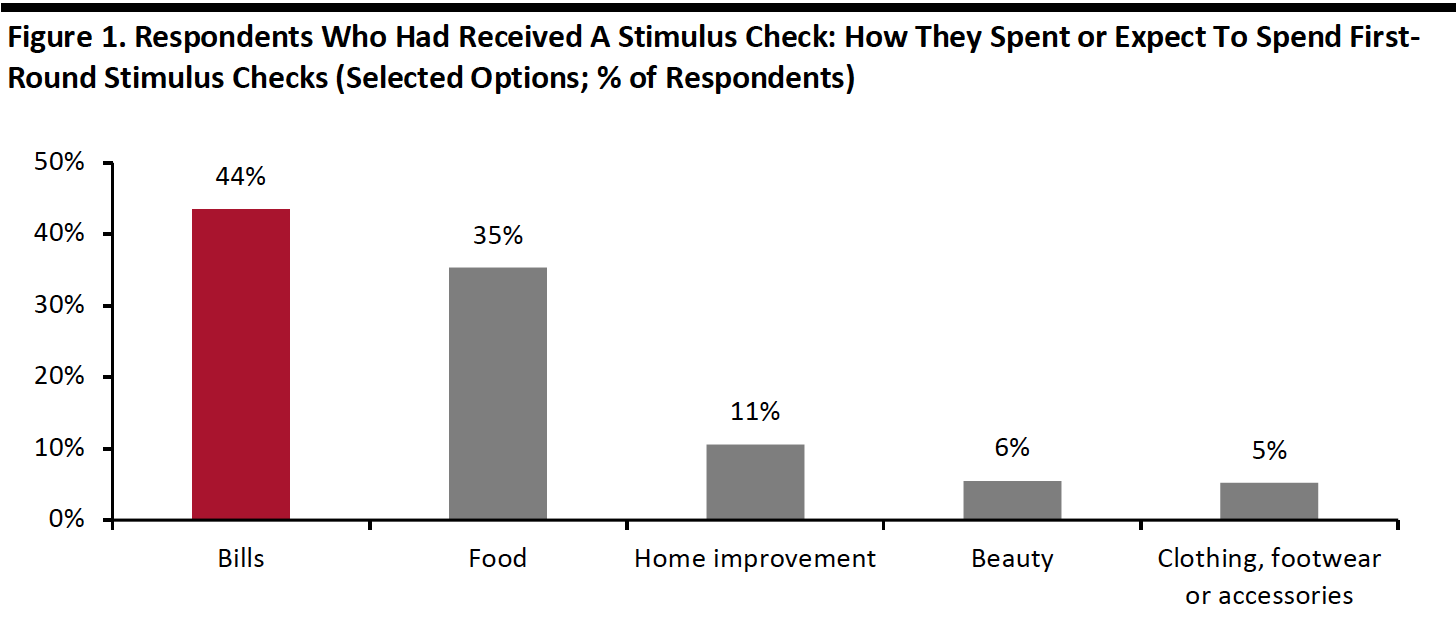 Base: US Internet users aged 18+ who received a stimulus check
Source: Coresight Research
Base: US Internet users aged 18+ who received a stimulus check
Source: Coresight Research
These results reflect that nonfood retail categories are a low priority for consumers, which aligns with the high avoidance rate for shopping malls/centers discussed below and the low rates of shopping-related activities that consumers told us they had done in the past two weeks (see our full survey).
2. Avoidance of Public Places Remains HighThis week, the proportion of respondents saying that they are avoiding any public area slightly increased to 86%, from 84% last week. The avoidance rate has remained high at above 80% for four consecutive weeks now, even though there are signs of a slowdown in new coronavirus cases in several states this week.
We saw slight decreases of avoidance in some of the 12 options provided:
- The proportion of respondents that are currently avoiding shopping centers/malls dropped again this week—some 62% said they are currently avoiding these places, versus 64% from last week.
- The proportion of respondents that are currently avoiding food-service locations fell back to the level we saw a month ago.
- Public transportation saw the highest decline in avoidance rate this week, of five percentage points.
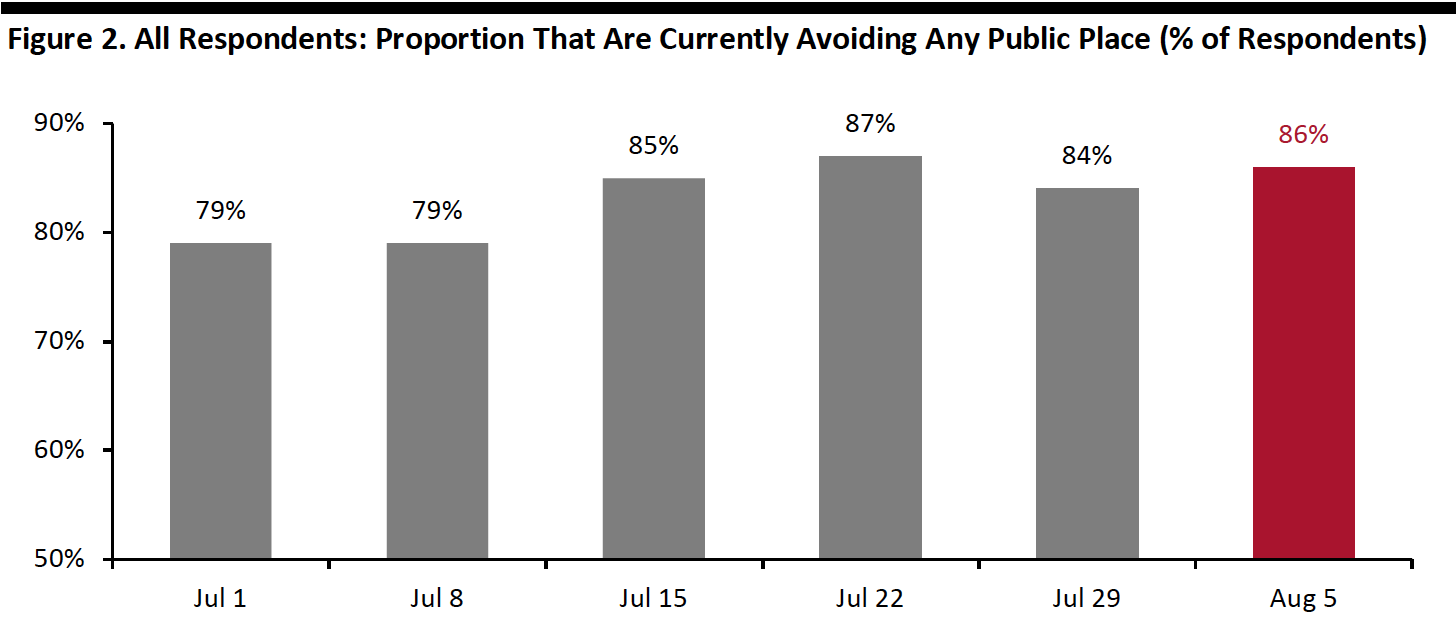 Base: US Internet users aged 18+
Source: Coresight Research[/caption] 3. A Declining Trend in Consumers’ Online Shopping
This week, the proportion of consumers switching their spending to e-commerce slid slightly again to a new low since peaking in June: Some 67% of consumers stated that they are buying more online than they used to this week, versus 69% last week. This represents a fall of nine percentage points from the peak of 76% in the week of June 24.
We also saw declines in the proportions of consumers that are currently buying more online than before the pandemic across almost all categories.
- Personal care and media/streaming products saw the largest decreases of five percentage points.
- The proportion of consumers that are currently buying more apparel online continued to fall back this week—to 24% from 28% last week and 31% two weeks before. However, apparel became the third-most-purchased category online this week.
- Home is the only discretionary category that saw the proportion of respondents buying more online remain stable this week.
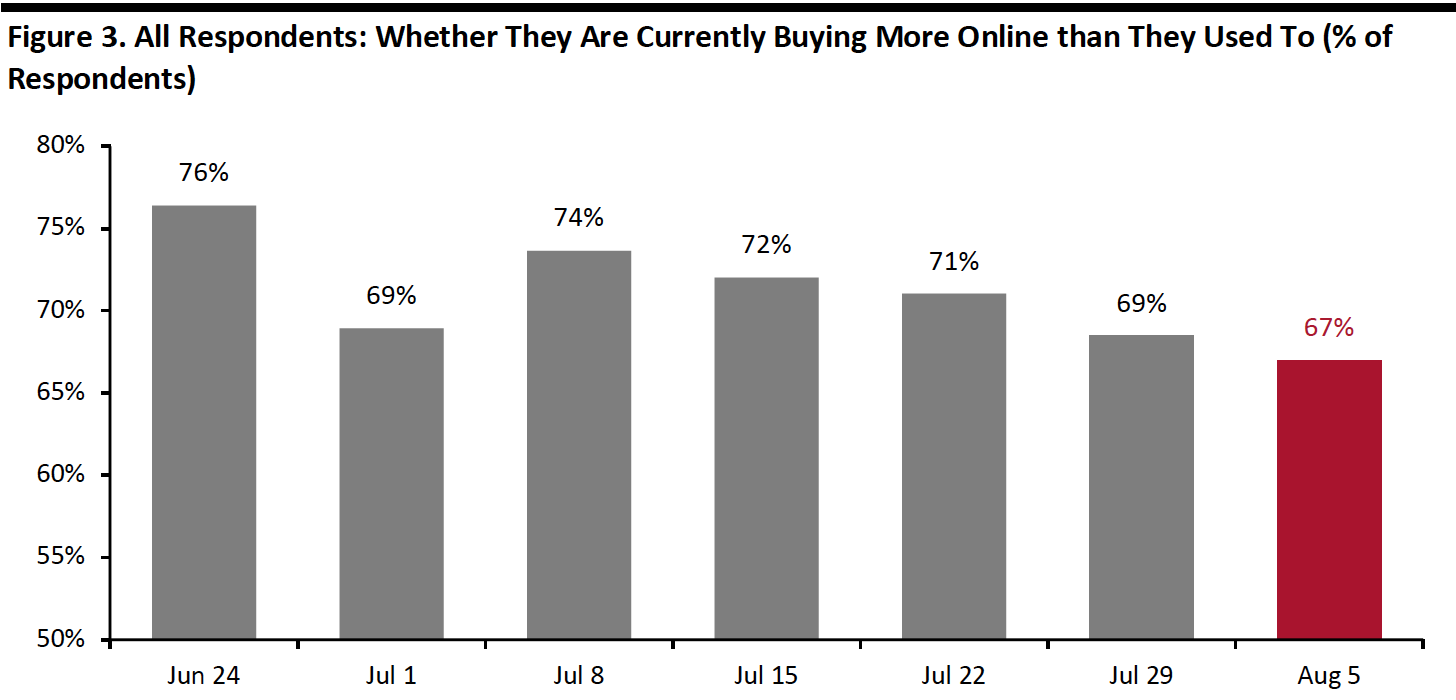 Base: US Internet users aged 18+
Source: Coresight Research[/caption]