albert Chan
What’s the Story?
This report presents the results of Coresight Research’s latest weekly survey of US consumers on the coronavirus outbreak, undertaken on August 5, 2020. We explore the trends we are seeing from week to week, following prior surveys on July 29, July 22, July 15, July 8, July 1, June 24, June 17, June 10, June 3, May 27, May 20, May 13, May 6, April 29, April 22, April 15, April 8, April 1, March 25 and March 17–18.
How Consumers Used and Plan To Use Their Stimulus Checks
From mid-April, stimulus checks injected tens of billions of dollars into the US consumer economy: These checks provided payments of up to $1,200 per adult to Americans whose income was less than $99,000. However, our survey this week found that discretionary retail spending has been a low priority for this cash.
The US government plans to send another round of stimulus checks if a deal is reached. We asked consumers who had received a stimulus check—which is around three-quarters of all respondents—how they used and plan to use their money, giving them 14 options (as well as “other” and “cannot remember”). We asked:
- How they spent the money from their stimulus checks, or how they expect to spend it if they have not yet done so.
- How they expect to spend the money if the government issues a second round of stimulus checks.
Bill Payments Are the Top Category for Stimulus-Check Spending
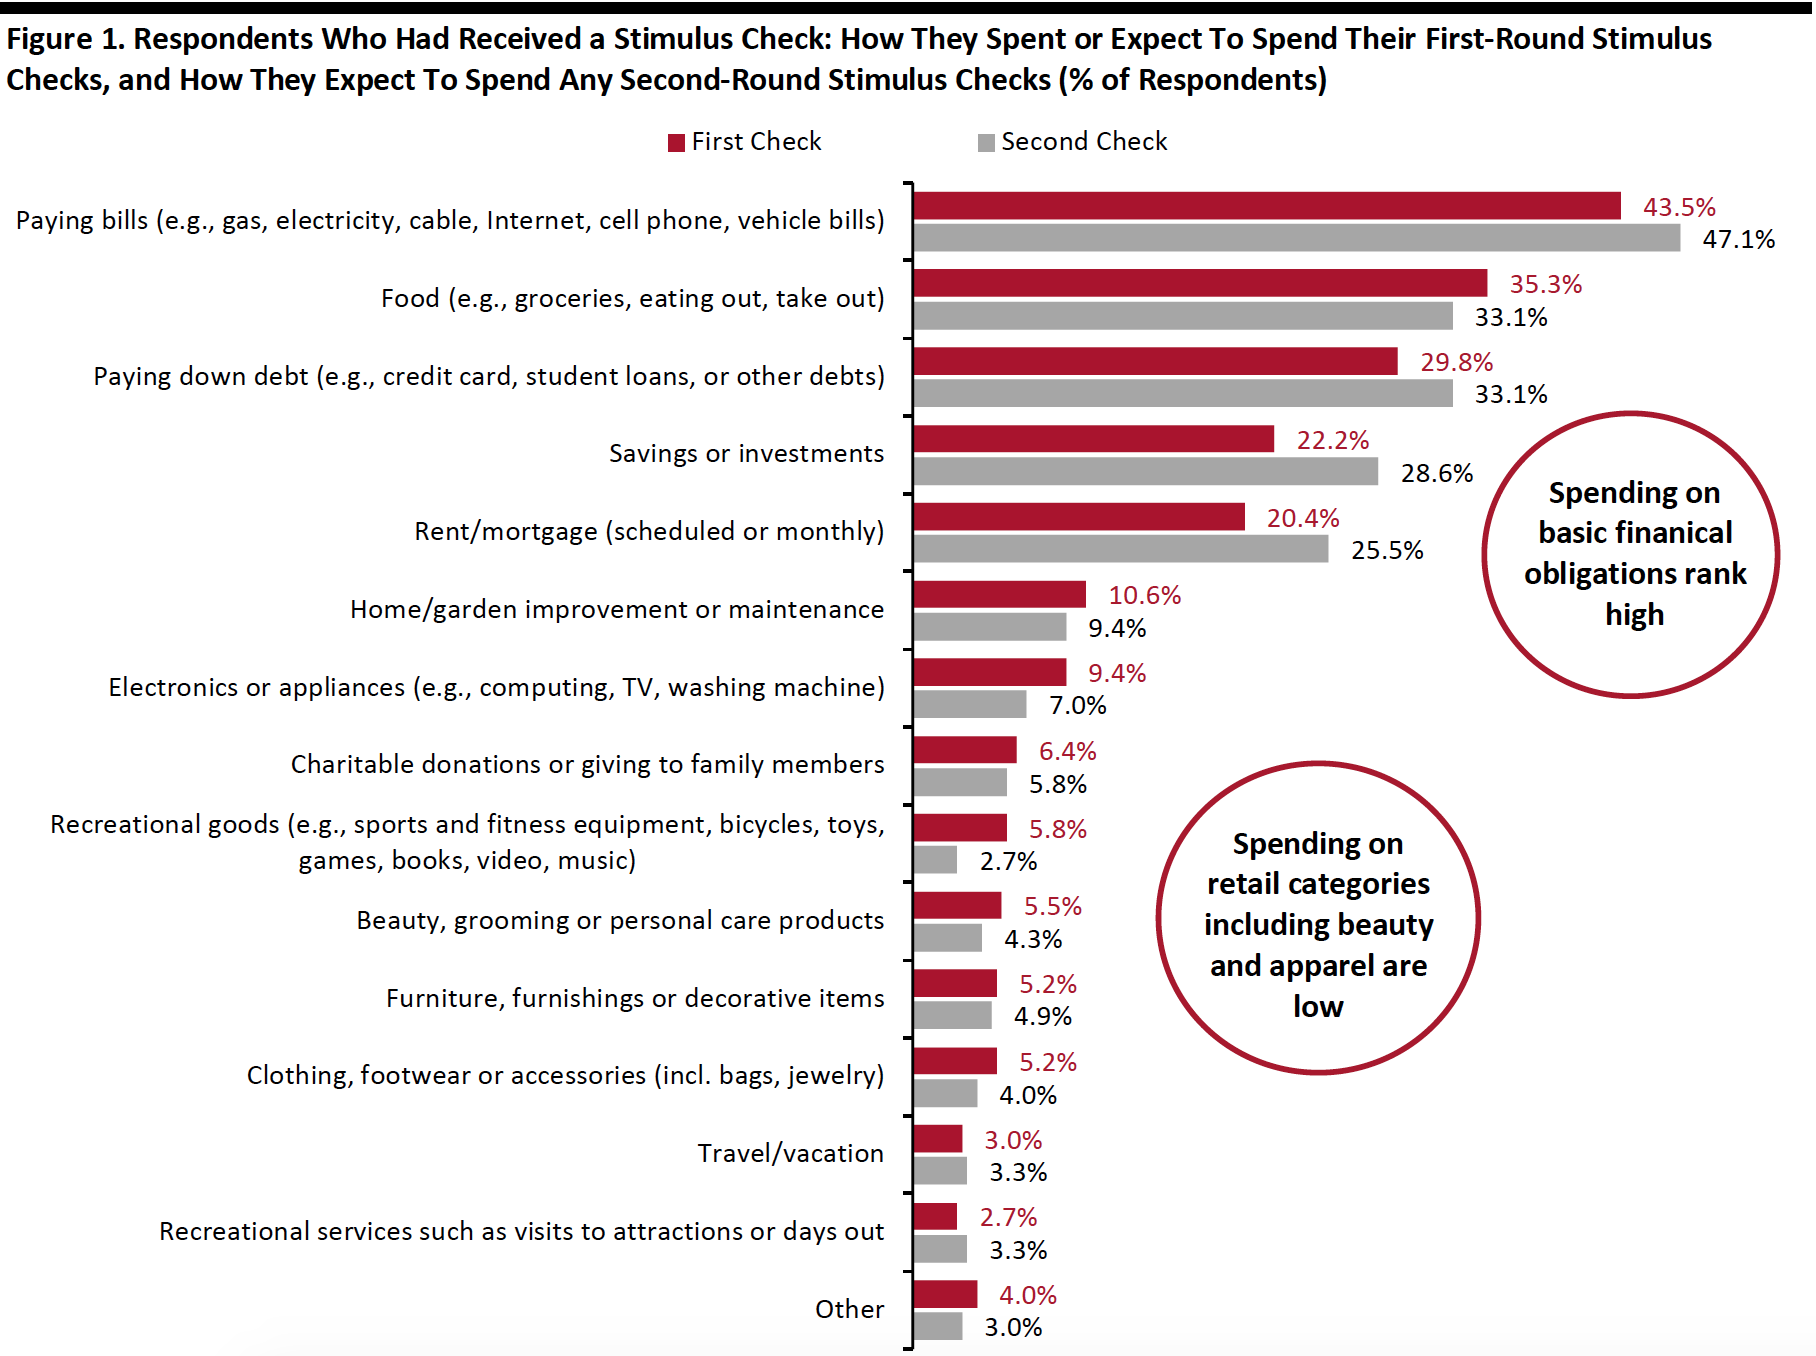
Bills, food, personal loans, savings and housing are some of the top categories on which consumers spent and expect to spend both rounds of stimulus checks.
- Some 43.5% of respondents who had received a check had spent it on bills, including for utilities, cellphone, cable TV and vehicles. An even greater proportion of consumers (47.1%) plan to use their second check to pay bills.
- Some 35.3% had used the stimulus money for food, such as groceries, eating out and takeout. One-third expect to spend money from a second check on food.
- We saw a higher proportion of consumers expecting to use their second stimulus check for debts, savings/investments and rent/mortgage, compared to their first stimulus spending.
Our data suggests that nonfood retail categories are not a high priority for consumers spending money from stimulus checks. Big-ticket retail categories see the strongest demand:
- Although only one in 10 had spent their first checks on home improvement, this is the number-one retail category, which is in line with the recent, very strong sales performance of the home-improvement sector. This is followed by electronics or appliances.
- Spending on other discretionary products is lower than 10%: Only 5.5% of respondents had spent on beauty, and 5.2% on clothing, footwear or accessories. This aligns with findings elsewhere in our survey that apparel and beauty continue to see the greatest spending cuts; see later in this report for those findings.
- The proportions of consumers planning to spend their second stimulus checks on retail categories including beauty, furniture, electronics and apparel are lower than those who had spent their first checks on these categories, as they expect to use the money to cover basic financial obligations.
 Respondents could select multiple options
Base: US Internet users aged 18+ who received a stimulus check
Source: Coresight Research[/caption]
The low absolute percentages of the stimulus-check spending on retail categories is alarming for retailers that sell a large portion of nonessential products. This is also consistent with the low rates in shopping-related activity that all respondents reported to have done in the past two weeks, and the high avoidance of shopping centers/malls, which we discuss in the next section.
What Shoppers Are Doing and Where They Are Going
Fewer Consumers Bought Groceries Online in the Past Two Weeks
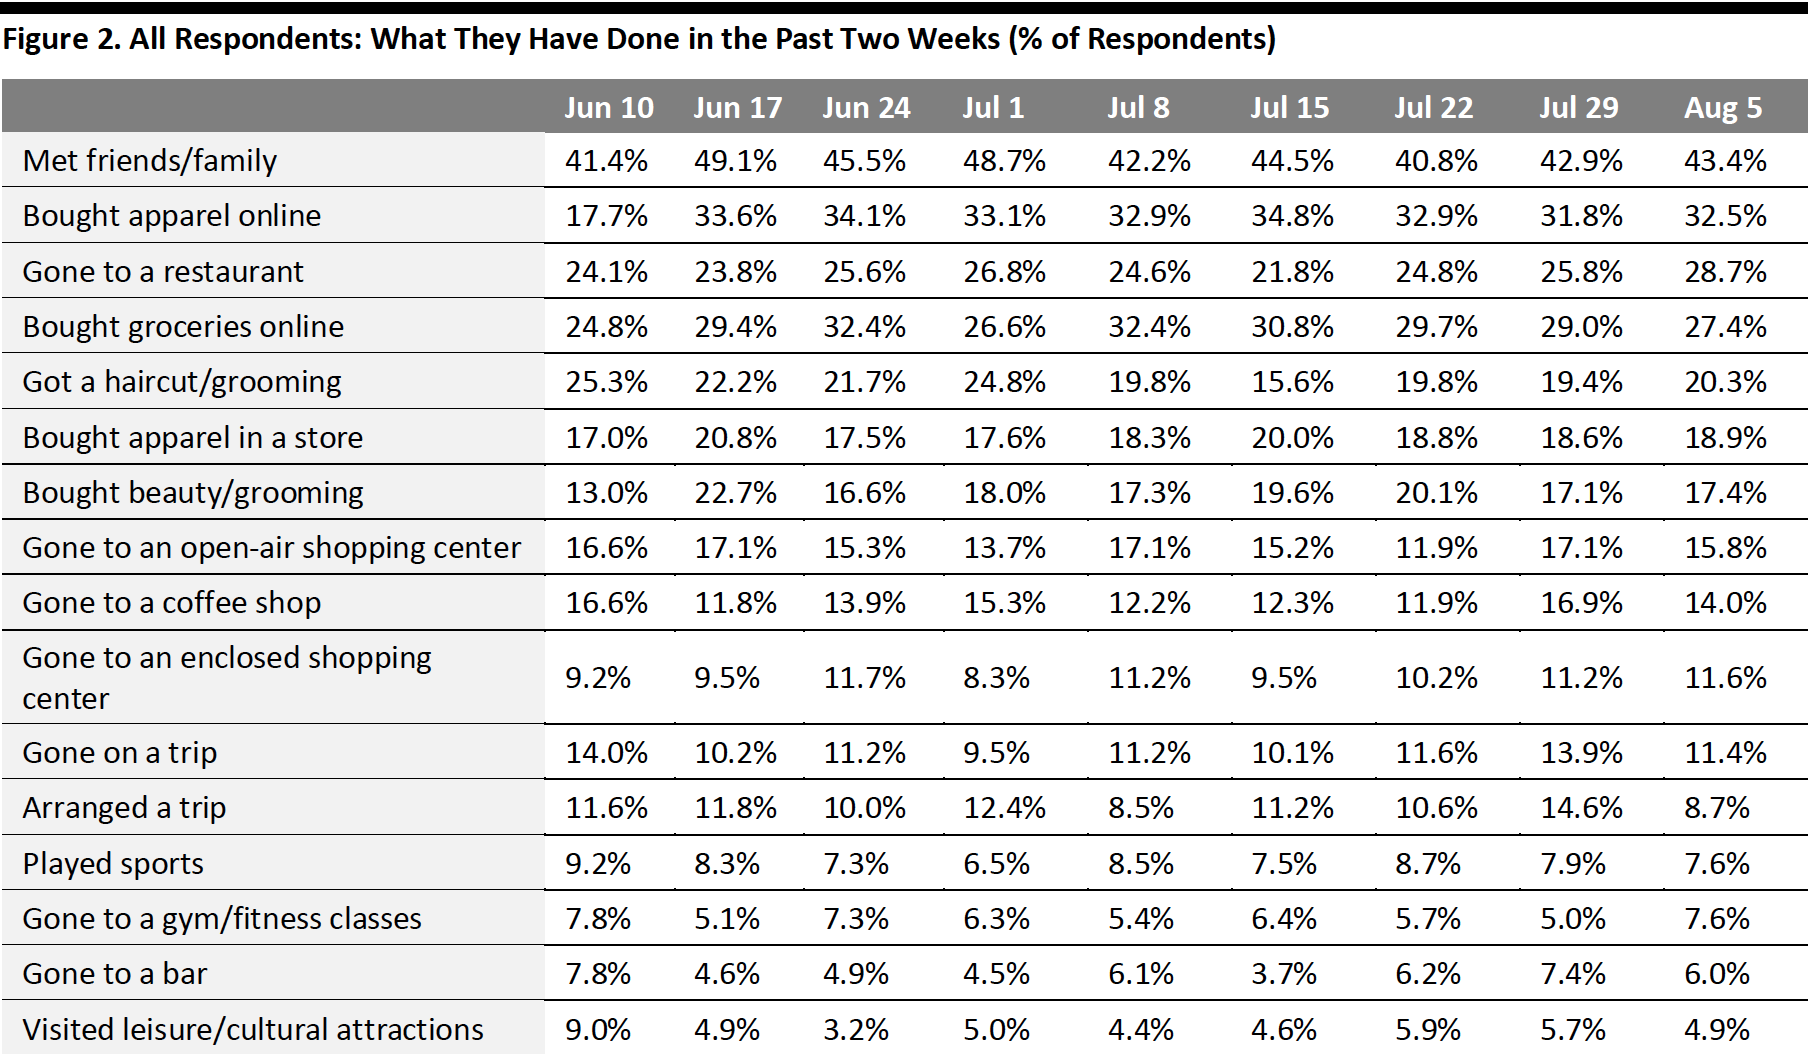
Each week, we ask consumers what they have done in the past two weeks. This week, the proportions of respondents for half of the 16 options we provided for activities done recently remained fairly stable. The proportions of consumers that had done shopping-related activities—such as in-store apparel shopping, making beauty purchases and visiting shopping centers/malls—were all lower than one-fifth, reinforcing that discretionary spending is currently a low priority.
- The proportion of respondents that had bought apparel online in the past two weeks stood at one-third this week, versus 31.8% last week. Some 18.9% had bought apparel in a store, level with the proportion last week. Consumers who bought beauty in the past two weeks also stayed consistent at around 17%.
- The proportion of respondents that had bought groceries online has declined at a very gradual pace for four consecutive weeks now, which aligns with our survey finding a downward trend in consumers buying more food online than before the pandemic (discussed later in the report). This week, some 27.4% had done so, down five percentage points from a month ago.
- The proportion of respondents that had visited an open-air shopping center has been fluctuating in the past few weeks. Some 15.8% had visited this type of public place this week, compared to around one in six last week. The proportion of consumers that visited an enclosed shopping mall broadly leveled off this week. The low absolute percentage in visits for both types of malls is in line with our finding elsewhere in the survey of high avoidance of shopping malls/centers.
- The proportion of respondents that had gone to restaurants in the past two weeks jumped to a new high this week. Almost three in 10 had dined in a restaurant, versus one-quarter last week. However, we saw that fewer consumers had gone to a coffee shop—one in seven compared to one in six last week.
 Respondents could select multiple options
Base: US Internet users aged 18+
Source: Coresight Research[/caption]
Expectations To Visit Shopping Malls in the Next Two Weeks Remain Low
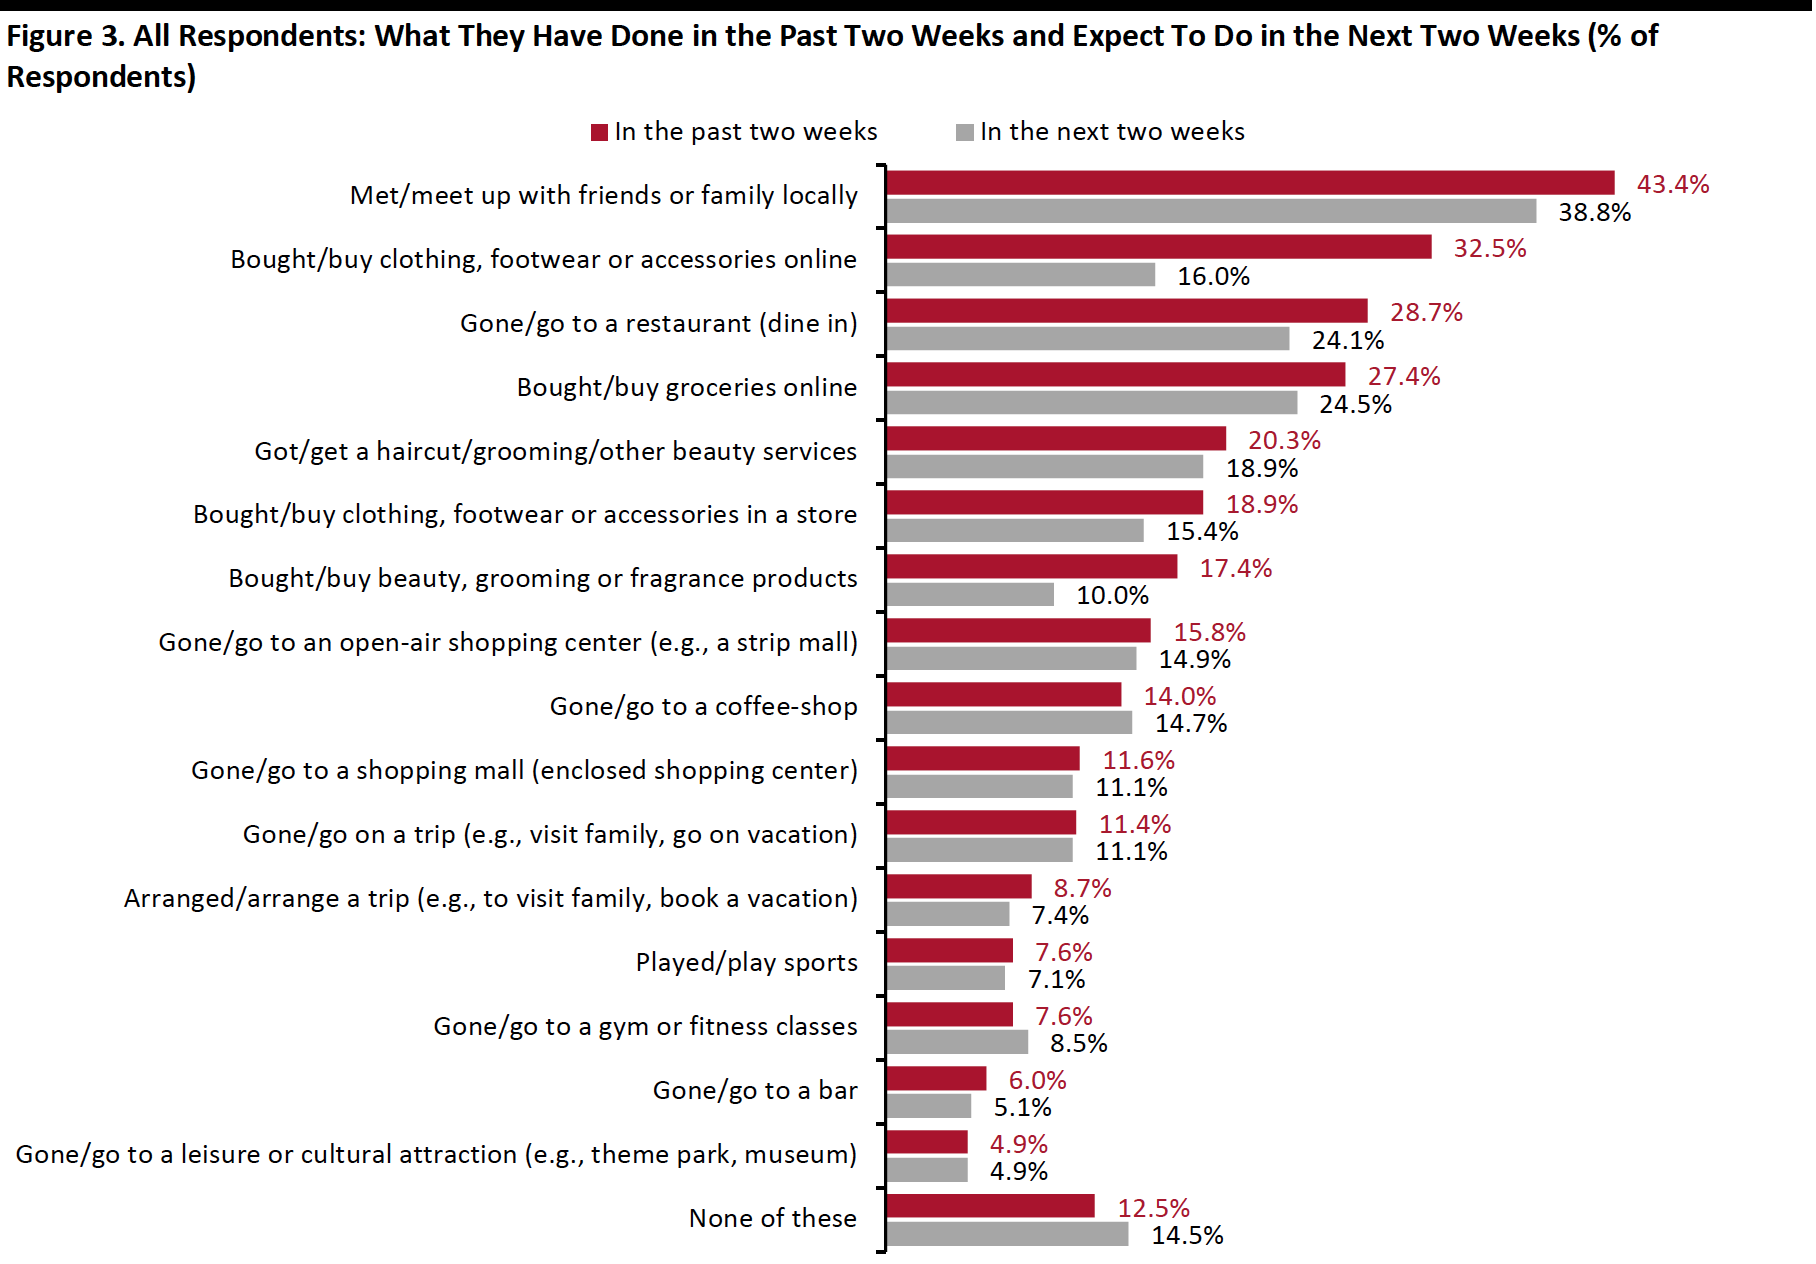
Each week, we also ask consumers what they expect to do in the next two weeks, with a comparable set of options to those for the last two weeks. In the chart below, we compare these short-term expectations with recent actual behavior.
We saw slightly lower proportions of consumers expecting to do almost all activities in the next two weeks than actual behavior in the past two weeks. We also noted that nonretail related activities will take priority for consumers in the next two weeks.
- Some 16.0% expect to buy clothing or footwear online in the next two weeks, very close to the 15.4% planning to do so in a store. However, we have seen a consistent pattern of a much higher proportion in actual online apparel shopping, showing that some discretionary purchases may not planned in advance by consumers.
- Some 24.1% expect to buy groceries online in the next two weeks, slightly lower than those that had done so in the last two weeks.
- Around one in seven expect to go to an open-air shopping center in the next two weeks, versus only one in 10 that expect to visit an enclosed mall. The expectations in visiting both types of shopping malls are very close to actual behaviors in the past two weeks.
 Respondents could select multiple options
Base: US Internet users aged 18+
Source: Coresight Research[/caption]
Almost Nine in 10 Are Currently Avoiding Public Places
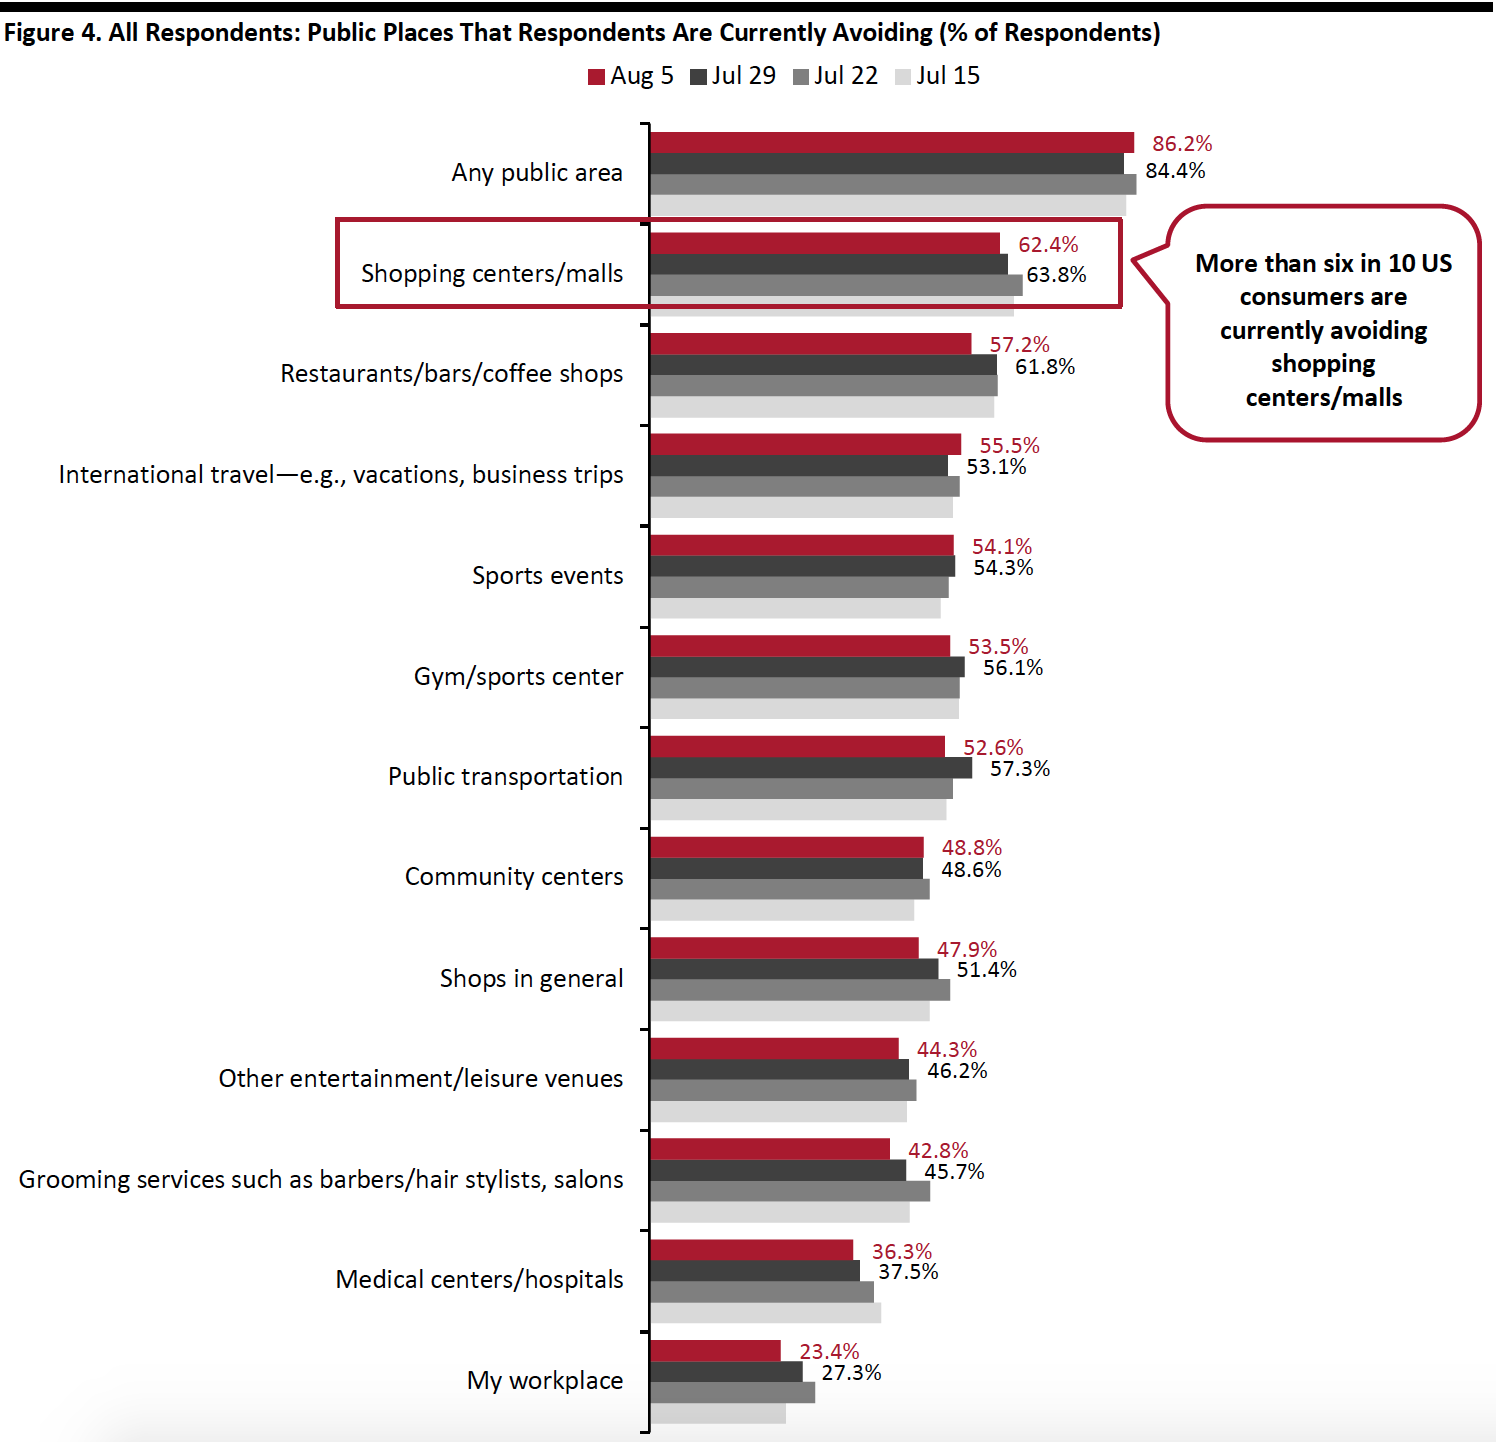
This week, the proportion of respondents saying that they are avoiding any type of public area increased slightly to 86.2%, from the 84.4% we saw last week. This is the fourth consecutive week that the avoidance rate has been above 80, even though there are signs of a slowdown in new coronavirus cases across several states this week.
We saw slight decreases in avoidance for nine of the 12 options provided, although these changes were within the margin of error:
- The proportion of respondents who are currently avoiding shopping centers/malls dropped again this week, after reaching a peak of two-thirds two weeks ago. Some 62.4% said that they are currently avoiding these places, versus 63.8% last week. This rate has remained high at above 60% for the past couple of weeks, and shopping malls continue to be the most-avoided place.
- The proportion of respondents that are currently avoiding food-service locations fell back to the level we saw one month ago. Some 57.2% are currently avoiding restaurants/bars/coffee shops, down from 61.3% last week. This echoes our previous finding that more consumers had gone to a restaurant in the past two weeks.
- Avoidance of shops in general came in at 47.9% of respondents this week, compared to 51.4% last week. This is the lowest rate we have seen in the past few weeks.
- Public transportation saw the highest decline in avoidance rate this week, of five percentage points: Some 52.6% of respondents are currently avoiding these places, versus 57.3% last week.
 Respondents could select multiple options
Base: US Internet users aged 18+
Source: Coresight Research[/caption]
Reviewing Trend Data in Current Purchasing Behavior
What Consumers Are Currently Buying More Of and Less Of
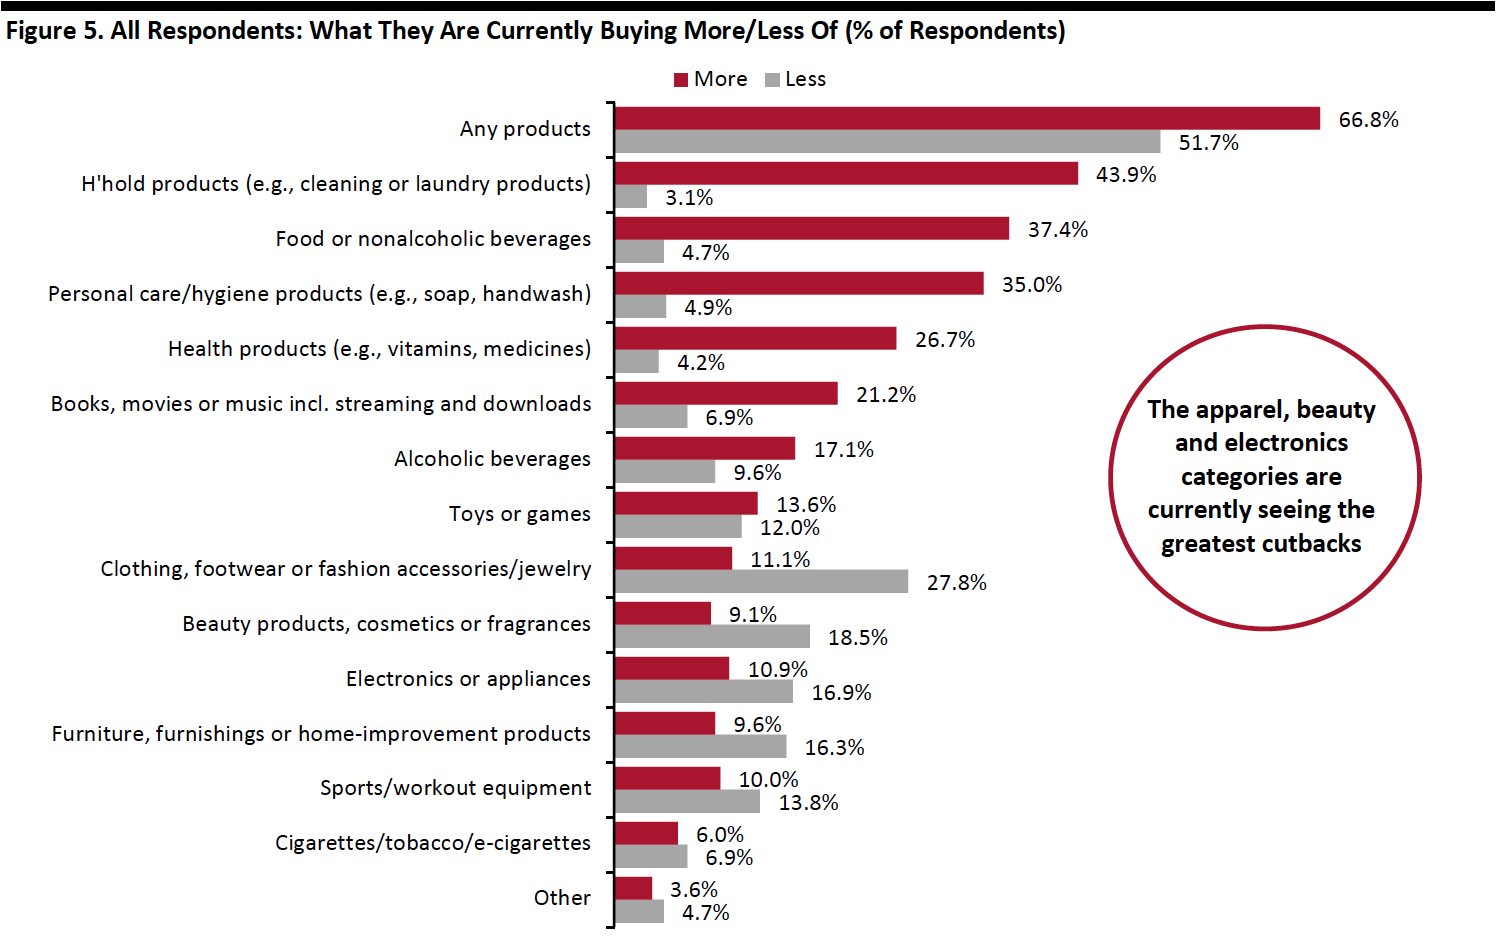
The proportion of respondents who are currently buying more of any category increased again this week to 66.8%, from 63.8% last week. The proportion of respondents who are currently buying less fell to the level we saw one month ago. Some 51.7% of consumers are currently buying less, down five percentage points from 56.6% last week.
- Buying more of certain categories and buying less of certain categories were not mutually exclusive options, so respondents could answer yes to both.
Buying more: Essentials, including household products, food and personal care, continue to hold the top spot in categories that consumers are buying more of. The proportion of consumers buying household products went up slightly to 43.9%, from 41.2% last week.
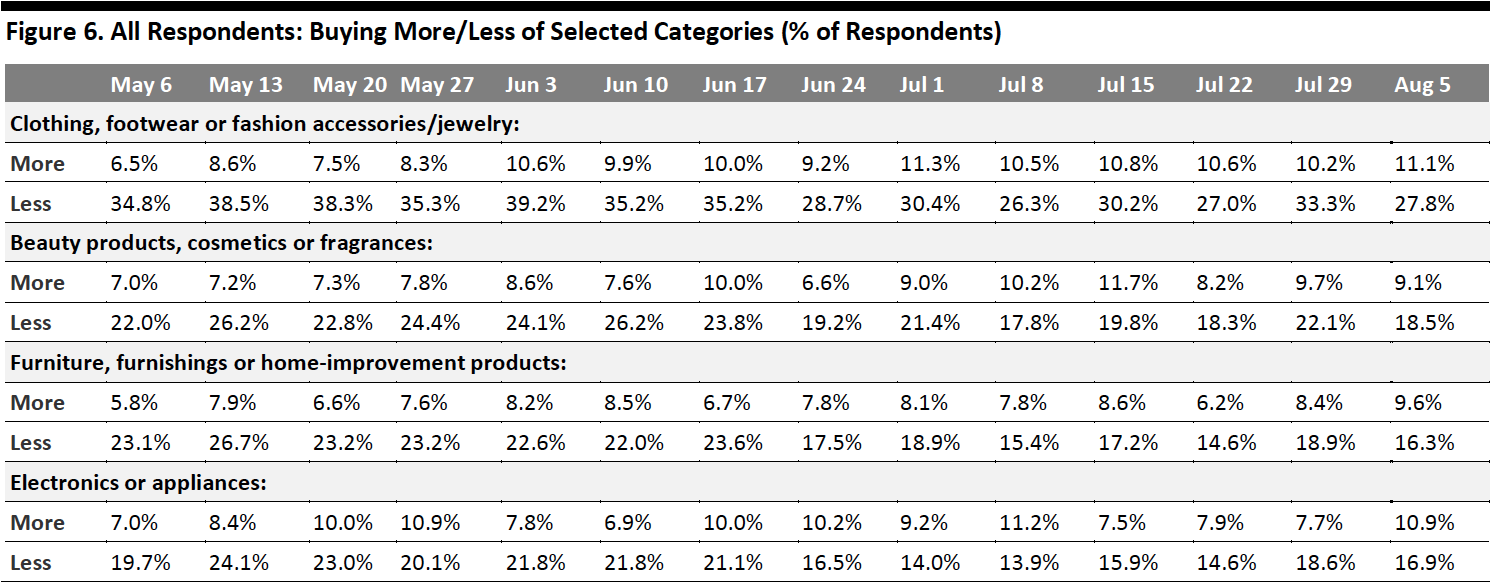
Buying less: We have seen fluctuations in the proportions of respondents buying less in discretionary categories over the past couple of weeks. This week, we saw fewer consumers buying less in all of the selected discretionary categories tracked in Figure 6. Some 27.8% are currently spending less on apparel, down from one-third last week. Beauty is the second-most-cut category, with 18.5% currently buying less. Home products and electronics both saw around one in six consumers buying less in these categories.
Ratio of less to more: The ratios of the proportions of respondents buying less to the proportions buying more in all discretionary categories declines this week:
- The ratio for apparel decreased to 2.5 from 3.3 last week.
- The ratio for home reached a new low of 1.7 this week, versus 2.2 last week and 2.4 two weeks before.
- The ratio for beauty stood at 2.0, versus 2.3 last week.
- The ratio for electronics dropped to 1.6 from 2.4 last week.
 Respondents could select multiple options
Base: US Internet users aged 18+
Source: Coresight Research[/caption] [caption id="attachment_114212" align="aligncenter" width="700"]
 Base: US Internet users aged 18+
Source: Coresight Research[/caption]
Two-Thirds Are Switching Spending Online
In contrast to the uptick in buying more of any category, shown above, the proportion of consumers buying more online than they used to slid a little to reach a new low since peaking in June; this would appear to reflect a return to in-store shopping for the additional purchases that consumers are making.
Some 67.3% of consumers stated that they are buying more online than they used to this week, versus 68.5% last week. The near-consistent declining trend we have seen since June 24 reflects that consumers are gradually switching some of their spending back to physical stores.
[caption id="attachment_114213" align="aligncenter" width="700"]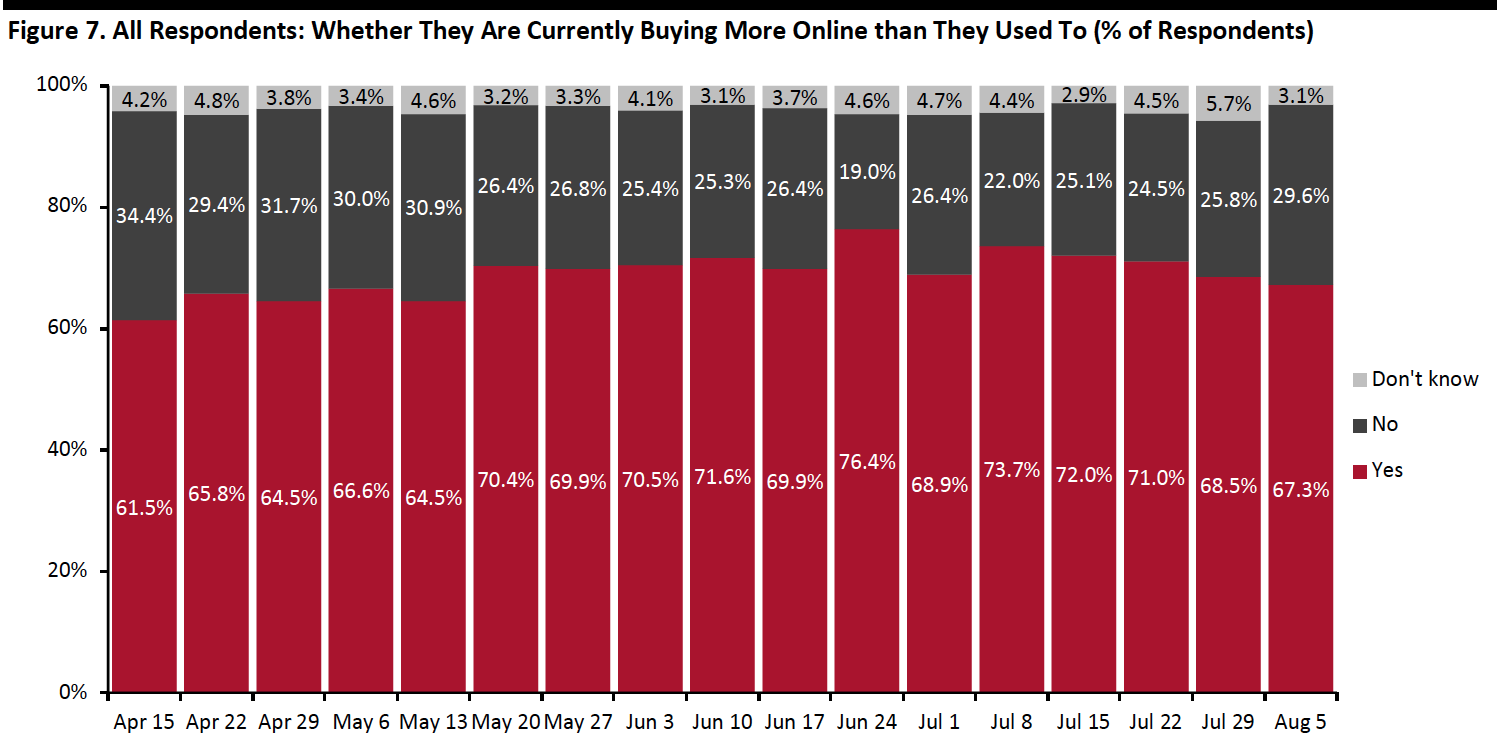 Base: US Internet users aged 18+
Source: Coresight Research[/caption]
What Consumers Are Currently Buying More Of Online
This week, we saw declines in the proportions of consumers who are currently buying more online than they used in almost all categories. Personal care saw the largest decrease of five percentage points, with 26.5% saying they are currently buying more online. Media products and streaming also saw an almost five-percentage-point decline after a jump last week.
The proportion of consumers that are currently buying more apparel online continued to fall back this week, to 24.1% from 28.3% last week and 31.4% two weeks before. However, it became the third-most-purchased category online this week. Some 15.1% are currently buying more beauty online than they used to, versus 18.6% last week. The proportion of respondents that are currently buying more home products online remained fairly stable at 11.6% this week.
[caption id="attachment_114214" align="aligncenter" width="700"]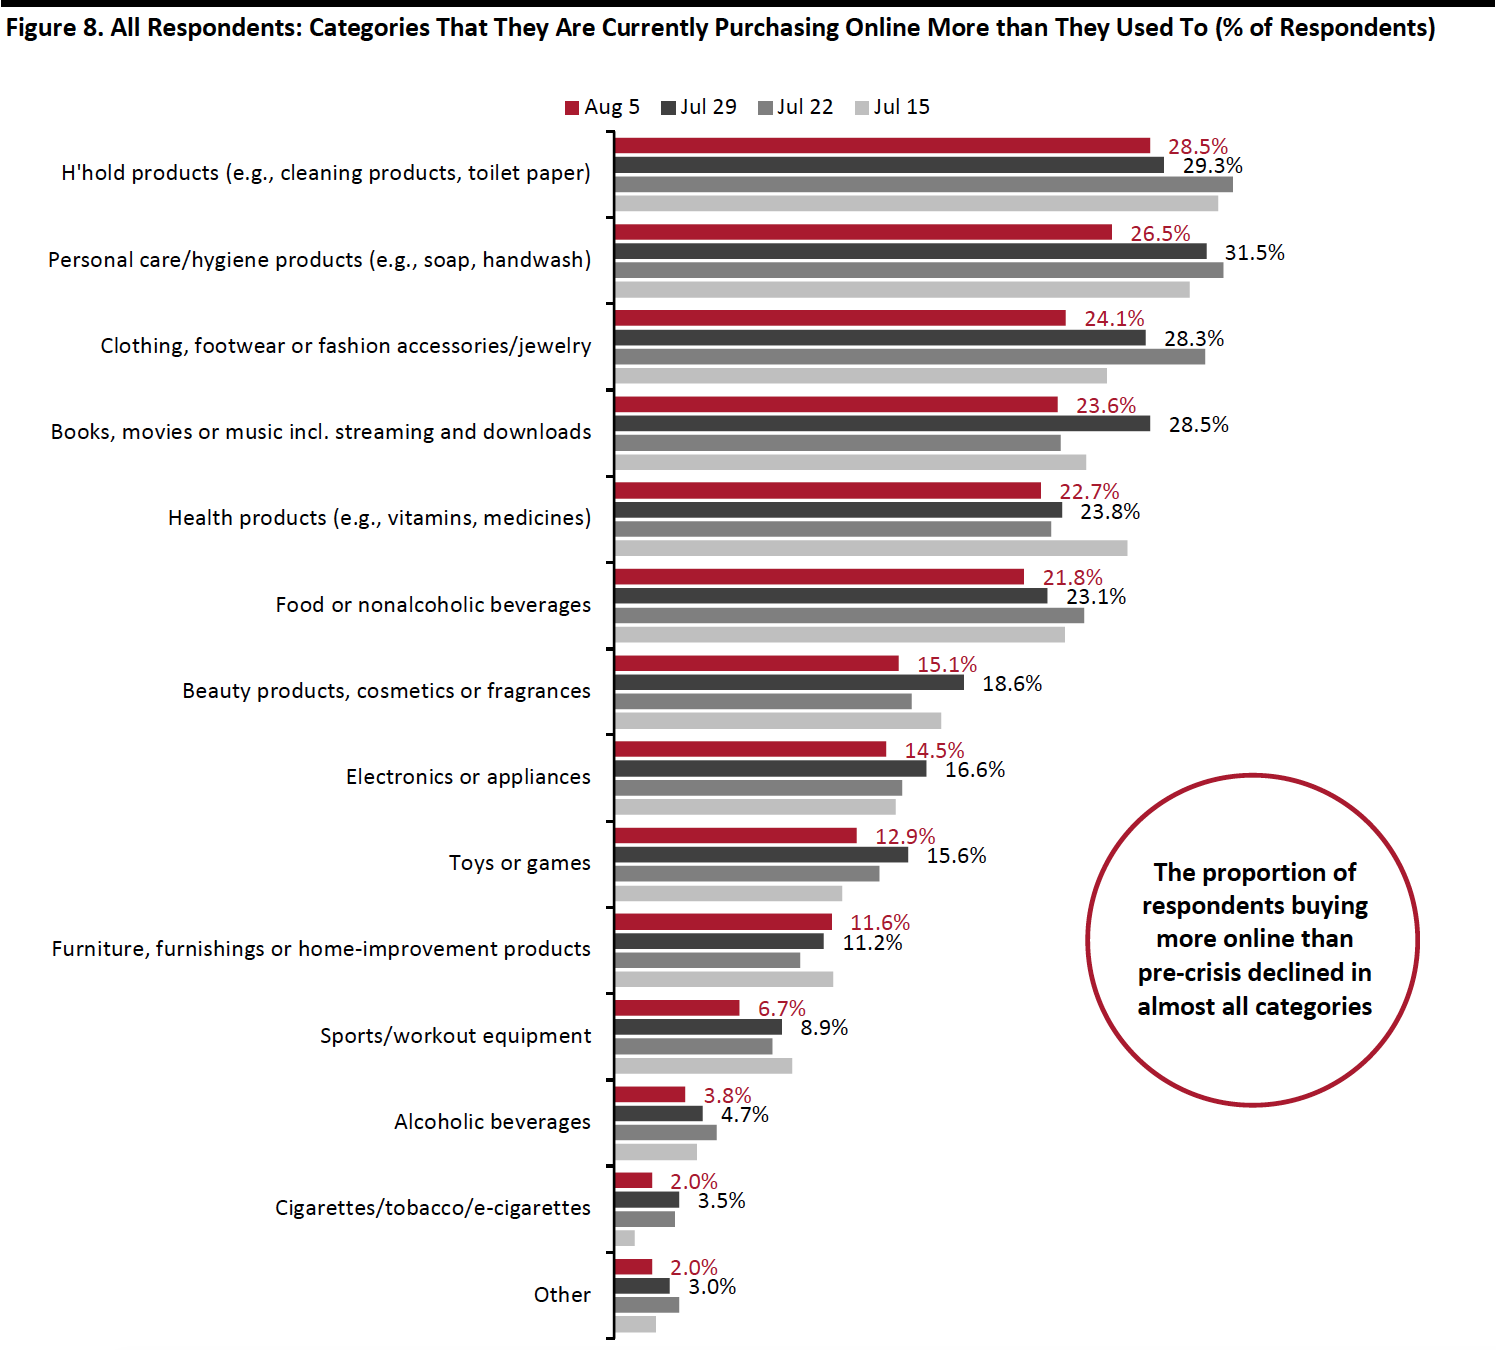 Respondents could select multiple options
Base: US Internet users aged 18+
Source: Coresight Research[/caption]
What We Think
Implications for Brands and Retailers
Our survey results suggest that retail spending is considered a low priority for consumers that received a stimulus check, as they spent that money for necessities and financial obligations. In addition, the high avoidance rate in shopping centers/malls and low percentage of shopping-related activities will be alarming to some discretionary retailers.
- Big-ticket retail sees the strongest demand, as consumers spent more time at home. This trend will continue to benefit home-improvement and electronics retailers.
- Apparel and beauty remain the top categories that saw the highest spending cutbacks, and apparel ranked low as a use for stimulus payments. Brands and retailers should step up their efforts to attract consumers, which could include promotional activities and more exciting product offerings. As consumers appear to be slowly returning to in-store shopping, retailers should also ensure a smooth and safe shopping experience in the store.
Methodology
We surveyed respondents online on August 5 (449 respondents), July 29 (403 respondents), July 22 (404 respondents), July 15 (454 respondents), July 8 (410 respondents), July 1 (444 respondents), June 24 (411 respondents), June 17 (432 respondents), June 10 (423 respondents), June 3 (464 respondents), May 27 (422 respondents), May 20 (439 respondents), May 13 (431 respondents), May 6 (446 respondents), April 29 (479 respondents), April 22 (418 respondents), April 15 (410 respondents), April 8 (450 respondents), April 1 (477 respondents), March 25 (495 respondents) and March 17–18 (1,152 respondents). The most recent results have a margin of error of +/- 5%, with a 95% confidence interval. Not all charted week-over-week differences may be statistically significant.