albert Chan
What’s the Story?
This report presents the results of Coresight Research’s latest weekly survey of US consumers, including on the impacts of the coronavirus outbreak, undertaken on September 22, 2020. We explore the trends we are seeing from week to week, following prior surveys on September 15, September 9, September 2, August 26, August 19, August 12, August 5, July 29, July 22, July 15, July 8, July 1, June 24, June 17, June 10, June 3, May 27, May 20, May 13, May 6, April 29, April 22, April 15, April 8, April 1, March 25 and March 17–18.
How Consumers Expect To Celebrate and Spend for Halloween 2020
This week, we asked consumers how they expect to celebrate and spend for this year’s Halloween amid the coronavirus pandemic. Some 64.0% of all respondents said they usually celebrate or take part in Halloween events or have children that do so. We asked those respondents:
- About their expected Halloween spending this year compared to last year.
- How they will celebrate Halloween this year.
- What precautions, if any, those who expect to celebrate Halloween this year will take to celebrate the holiday safely.
Four in 10 Expect To Spend Less for Halloween This Year
Halloween spending looks set to be lower than last year. Among consumers who usually take part in Halloween, 40.4% said they expect to spend less this year compared to last year—the most popular option. In addition, some 15.9% said they will spend nothing on Halloween this year.
[caption id="attachment_116758" align="aligncenter" width="700"]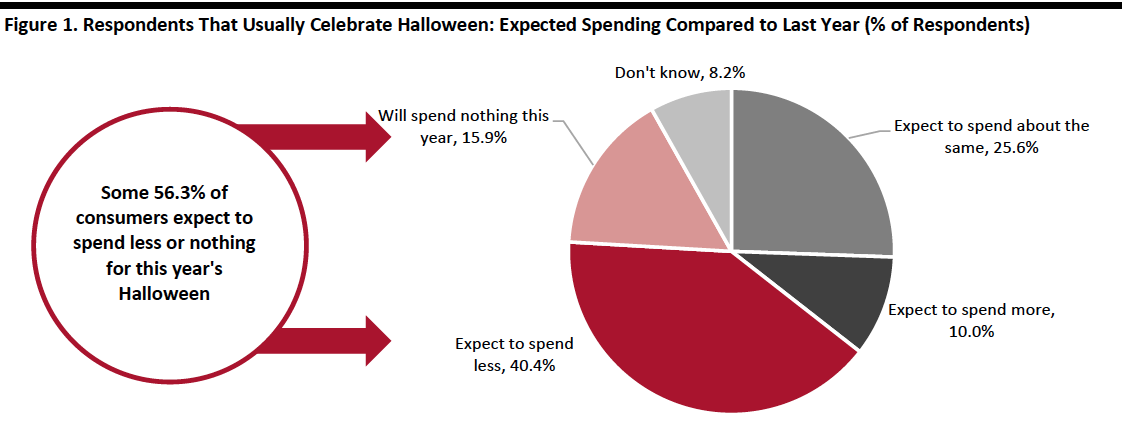 Base: 270 US Internet users aged 18+ who usually celebrate Halloween, or have children that do so
Source: Coresight Research[/caption]
Half Expect To Decorate Their House To Celebrate Halloween
Consumers are still planning to celebrate Halloween this year despite the ongoing Covid-19 pandemic. Only one in 10 who typically celebrate Halloween said they do not plan to celebrate the holiday this year.
At-home activity ranked the highest among all celebration activity options we provided—half of consumers expect to decorate their house. This is followed by dressing in costumes, at 36.3%. These top two celebration activities suggest that seasonal home decorations and costumes will see solid consumer demand for Halloween this year.
Almost one-fifth said they will go to a friend’s or neighbor’s house for a party, and 14.4% said they will organize a party at home; both figures are higher than the proportion that plan to celebrate Halloween virtually—only 12.2% said they expect to have a virtual celebration.
[caption id="attachment_116759" align="aligncenter" width="700"]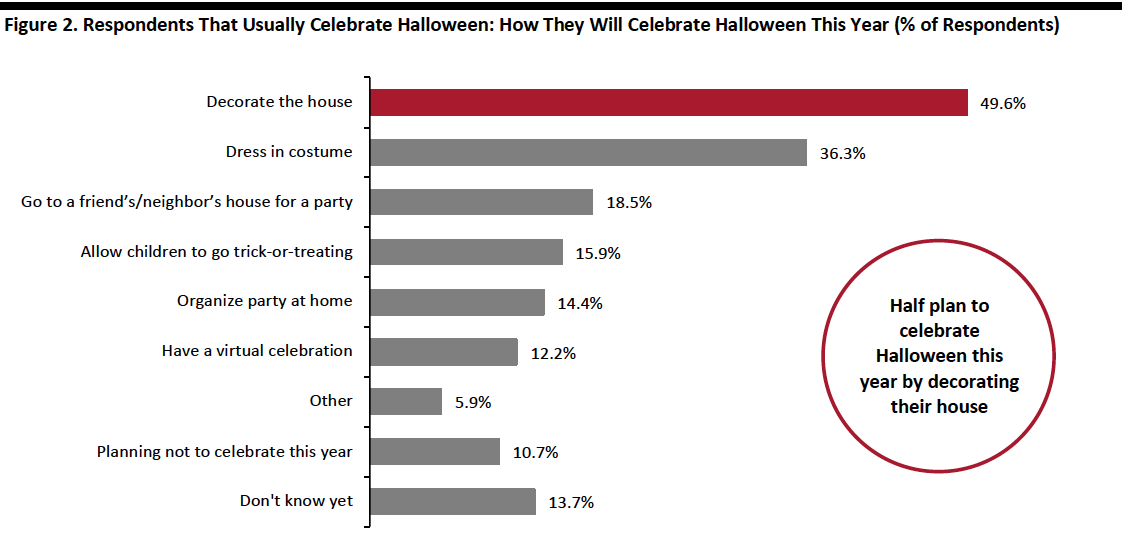 Respondents could select multiple options or “planning not to celebrate this year” or “don’t know yet”
Base: 270 US Internet users aged 18+ who usually celebrate Halloween, or have children that do so
Source: Coresight Research[/caption]
Safety Precautions Celebrants Plan To Take for Halloween
Celebration of Halloween will be different this year, with those taking part implementing safety precautions in the wake of the pandemic. Among those that plan to participate in Halloween events this year, one-third will wear masks and gloves and practice social distancing—the highest rate of any of the options.
Halloween celebrants are concerned about handing out candies and trick-or-treating, which traditionally involves now-risky face-to-face interaction. Some 31.1% said they will think of a creative way to hand out candy safely—for example, grouping candy in individual bags for kids to grab and go. Over one-fifth plan to hand out candy to trick-or-treaters wearing a mask and gloves.
[caption id="attachment_116760" align="aligncenter" width="700"]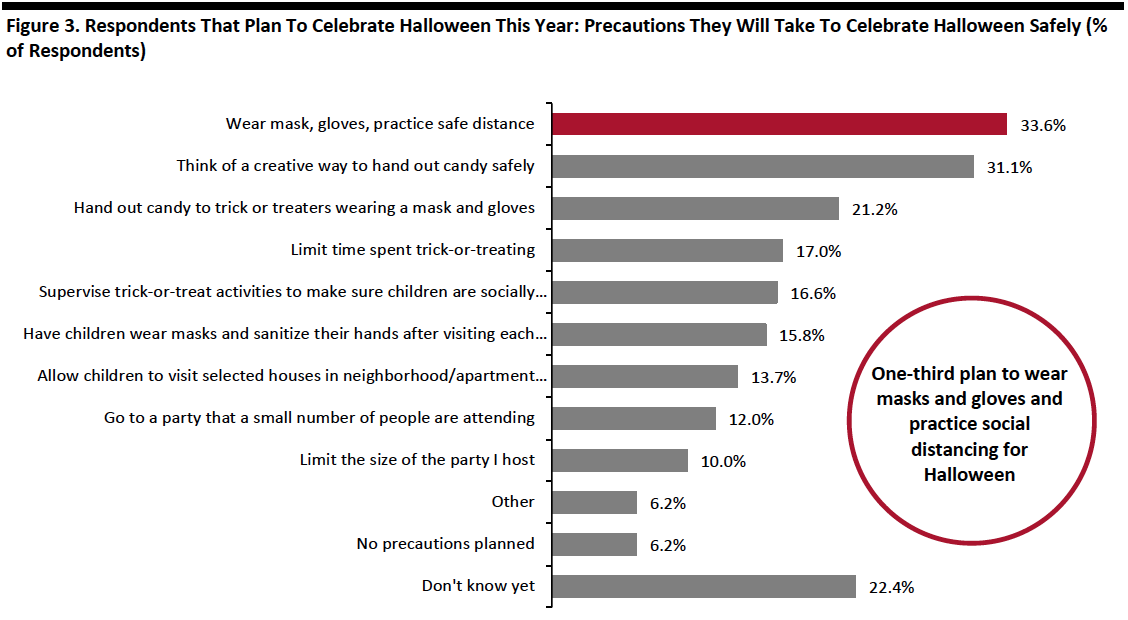 Respondents could select multiple options or “no precautions planned” or “don’t know yet”
Base: 241 US Internet users aged 18+ who plan to celebrate Halloween 2020
Source: Coresight Research[/caption]
What Shoppers Are Doing and Where They Are Going
Dining in a Restaurant Reaches a New High This Week
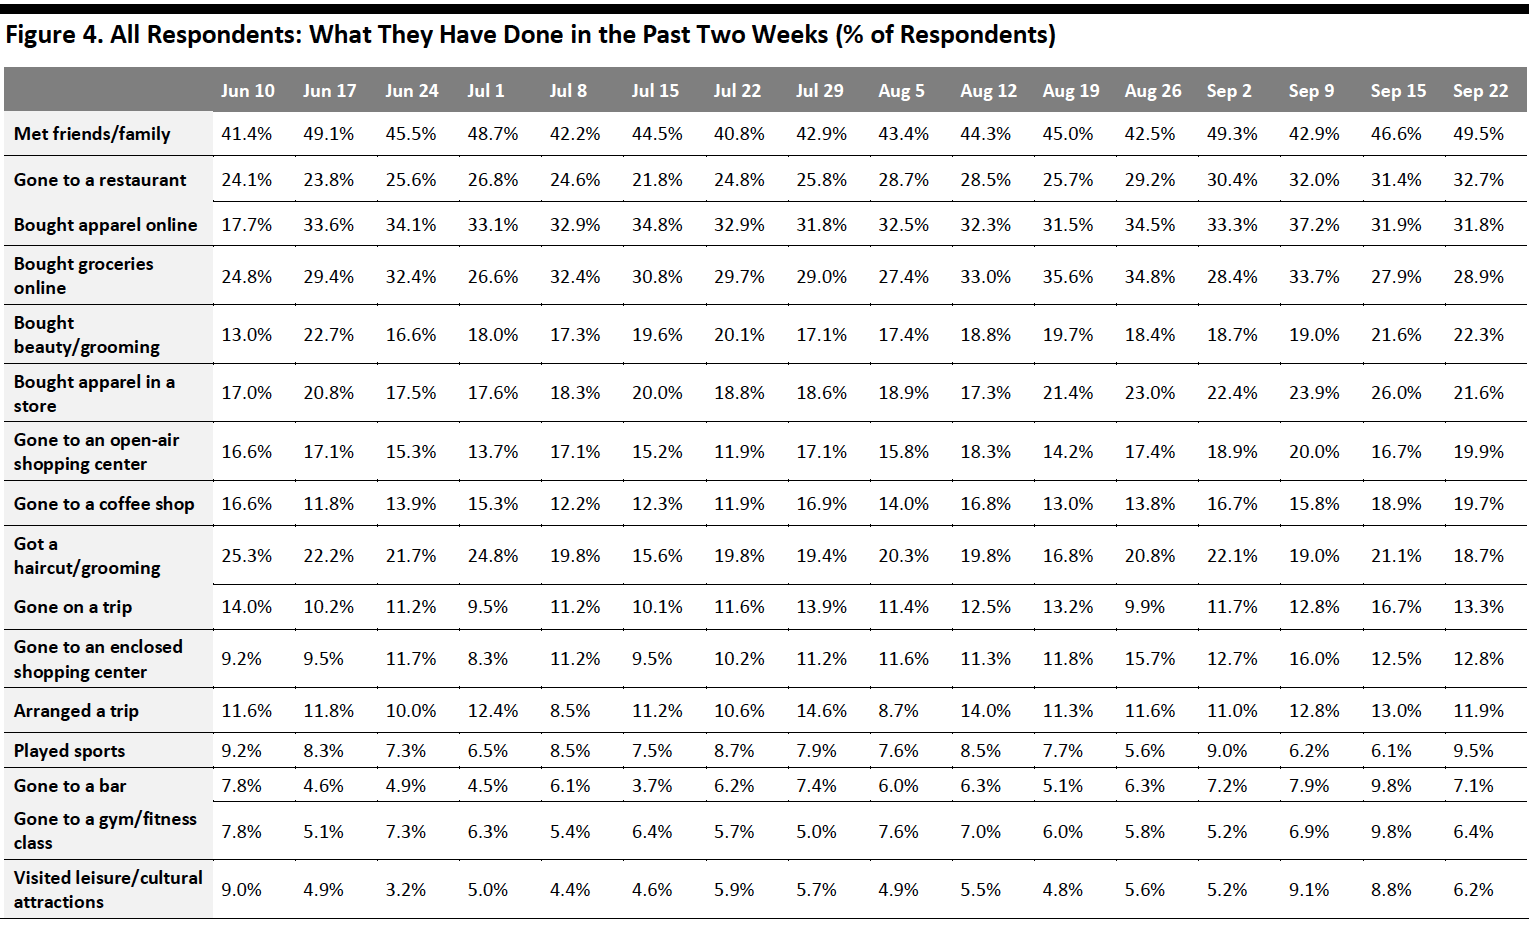
Each week, we ask consumers what they have done in the past two weeks. This week, the proportion of respondents decreased for seven of the 16 options we provided for recent activity options. Although all week-over-week changes were within the margin of error, the directional trends, including over a number of weeks, can prove informative.
- The proportion of respondents that had bought clothing and footwear online broadly leveled off at 32% this week, after reaching the highest level of 37.2% two weeks ago. This is consistent with our finding, shown later in this report, that the proportion of consumers that are buying more apparel online than before the pandemic remained stable week over week. The proportion of respondents that had bought apparel in-store fell to the level we saw a month ago, following the peak last week. Some 21.6% had bought clothing or footwear in a store in the past two weeks, versus 26.0% last week.
- Dining in a restaurant became the top spending activity in the past two weeks. Some 32.7% had done so—the highest level we have seen since we started asking this question, despite over half of consumers reporting to be currently avoiding food-service locations, as shown later in this report.
- This week, the proportion of respondents that had bought groceries online broadly leveled off after dropping almost six percentage points last week. Some 28.9% had done so in the past two weeks.
- The proportion of respondents that had visited an open-air shopping center returned to the level we saw two weeks ago. One-fifth had visited such a location in the past two weeks, while the proportion that had visited an enclosed shopping center remained stable at 13% this week.
 Respondents could select multiple options
Base: US Internet users aged 18+
Source: Coresight Research[/caption]
More Consumers Plan To Get a Haircut in the Next Two Weeks
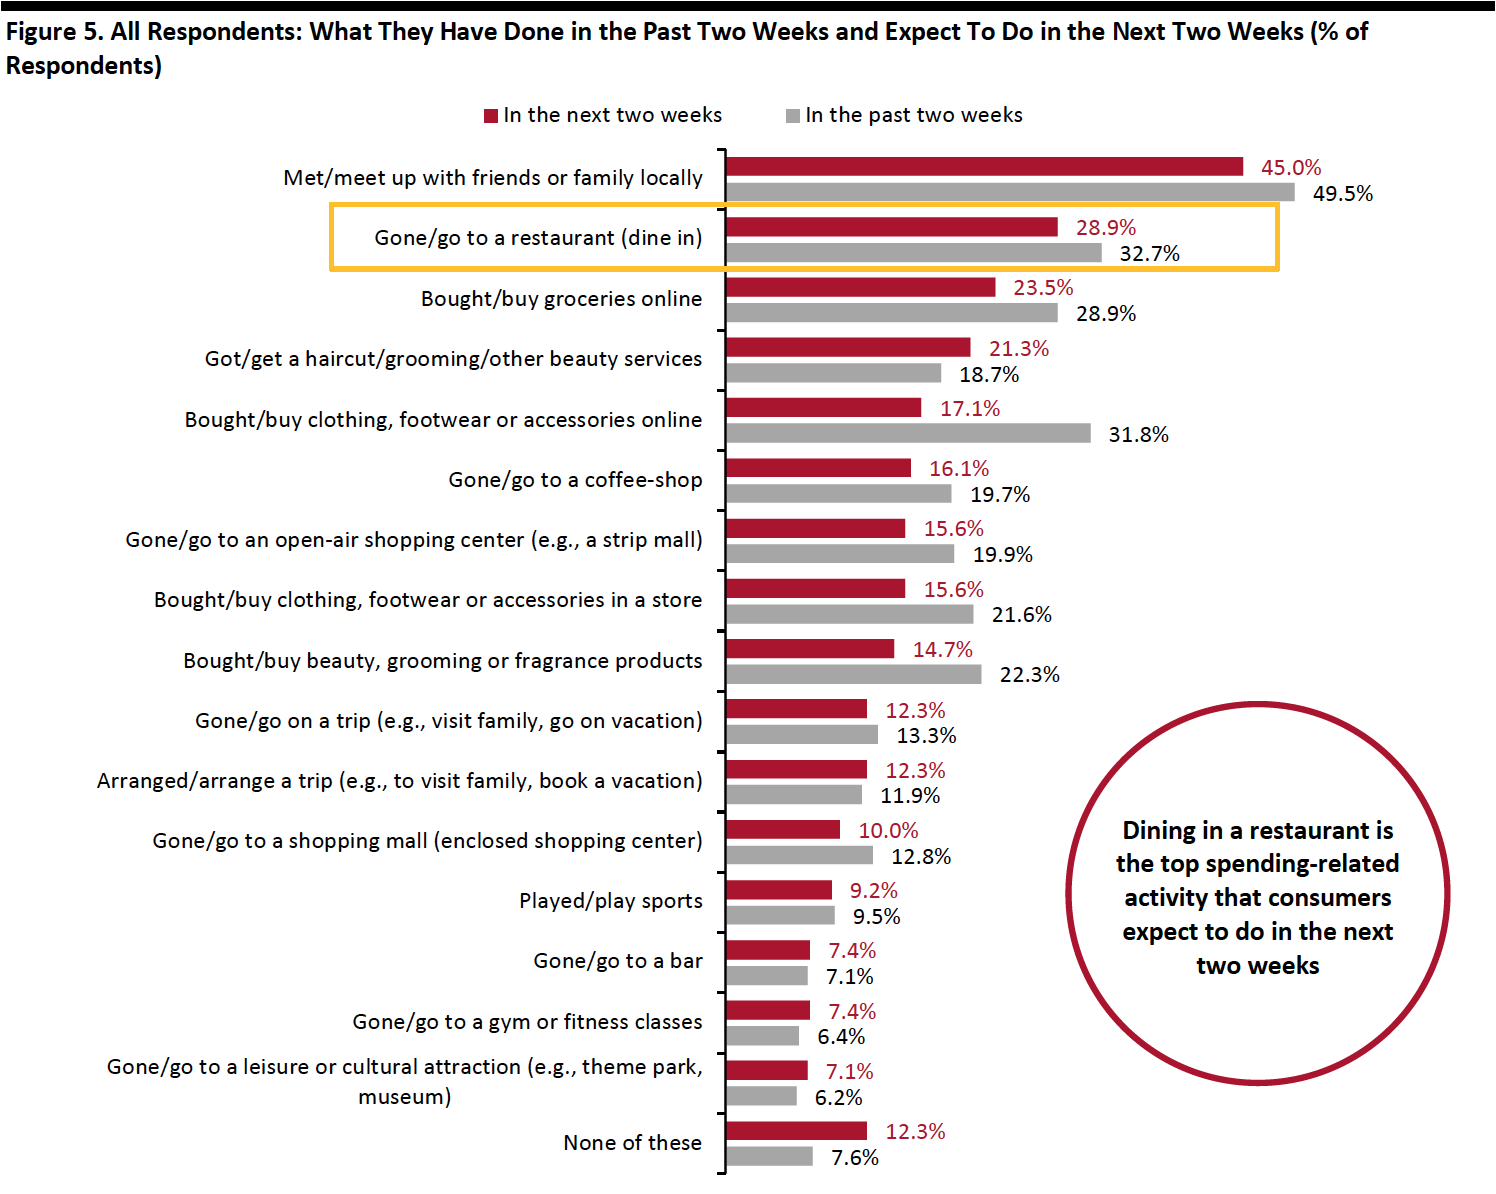
Each week, we ask consumers what they expect to do in the next two weeks, with a comparable set of options to those for the last two weeks. In the chart below, we compare these short-term expectations with recent actual behavior.
We saw slightly lower proportions of consumers expecting to do 10 of the 16 options we provided for activities in the next two weeks than actual behavior in the past two weeks.
- Dining in a restaurant overtook online grocery shopping as the top expected spending-related activity for the next two weeks, with almost three in 10 planning to go such places, versus one-third of actual behavior of such activity in the past two weeks.
- More consumers plan to get a haircut or other grooming services in the next two weeks than actual behavior of such activity in the past two weeks: Some 21.3% expect to do so, compared to 18.7% of actual behavior.
- The proportion of respondents that expect to buy clothing or footwear online stood at 17.1%, while 15.6% of consumers plan to do so in a store. Some 14.7% of consumers expect to purchase beauty products. We are likely to see higher proportions in actual behavior of these shopping activities, particularly for both online and in-store apparel purchases, as the actual behavior of those activities has typically exceeded expected behavior in past survey results.
- Only 15.6% expect to visit an open-air shopping center, and one in 10 plan to go to an enclosed center in the next two weeks. The low expected rates are aligned with increased avoidance in shopping malls/centers, which we discuss in the next section.
 Respondents could select multiple options
Base: US Internet users aged 18+
Source: Coresight Research[/caption]
Eight in 10 Are Currently Avoiding Public Places
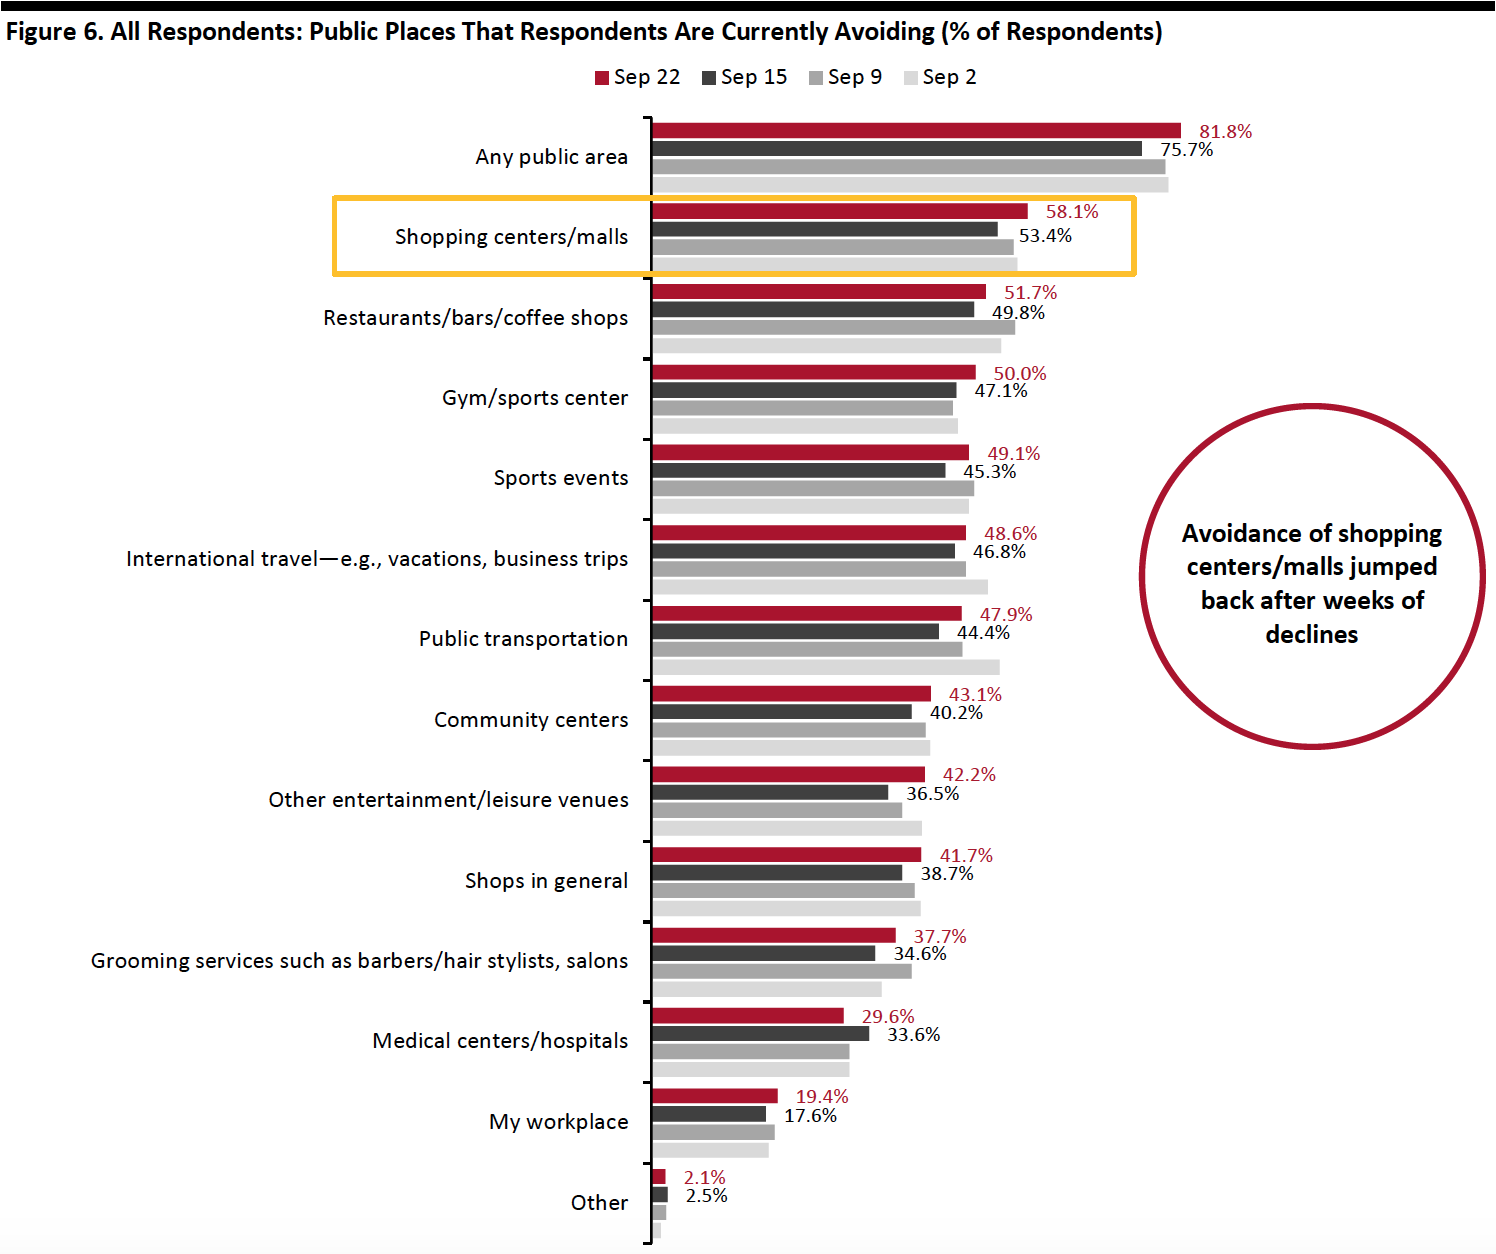
This week, the proportion of respondents saying that they are avoiding any type of public area spiked after weeks of declines: Some 81.5% are currently avoiding any public place, up six percentage points from 75.7% last week. This could be due to rising coronavirus cases in some states, indicating a possible second wave of the virus this fall.
We saw increases in avoidance for almost all of the 12 options provided, although most of the changes were within the margin of error.
- The proportion of respondents that are currently avoiding shopping centers/malls jumped after declining for five consecutive weeks. Some 58.1% are currently avoiding such places, increasing by almost five percentage points from 53.4% last week. Although the avoidance rate rebounded this week, it was still below 60% and much lower than the peak of two-thirds on July 22.
- Avoidance of shops in general also went up to the level we saw three weeks ago after seeing a downward trend in the past few weeks. Some 41.7% are currently avoiding such places, versus 38.7% last week.
- Entertainment and leisure venues saw the largest increase of avoidance this week, of almost six percentage points: Some 42.2% of respondents are currently avoiding these places, versus 36.5% last week.
 Respondents could select multiple options
Base: US Internet users aged 18+
Source: Coresight Research[/caption]
Reviewing Trend Data in Current Purchasing Behavior
What Consumers Are Currently Buying More Of and Less Of
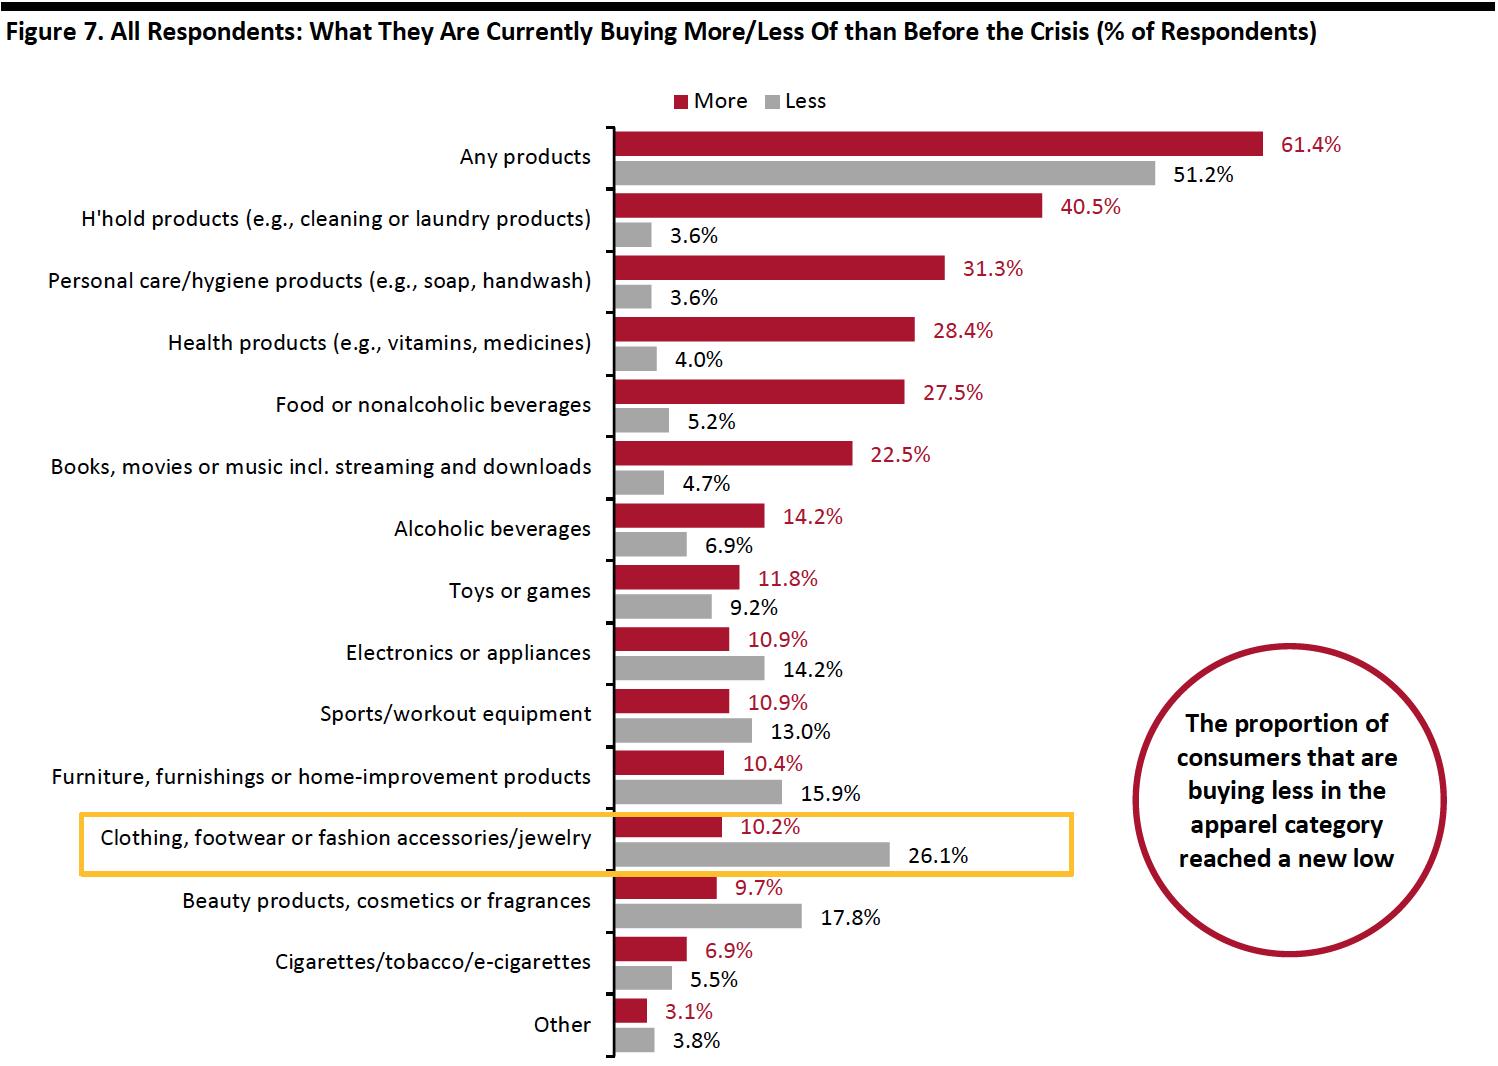
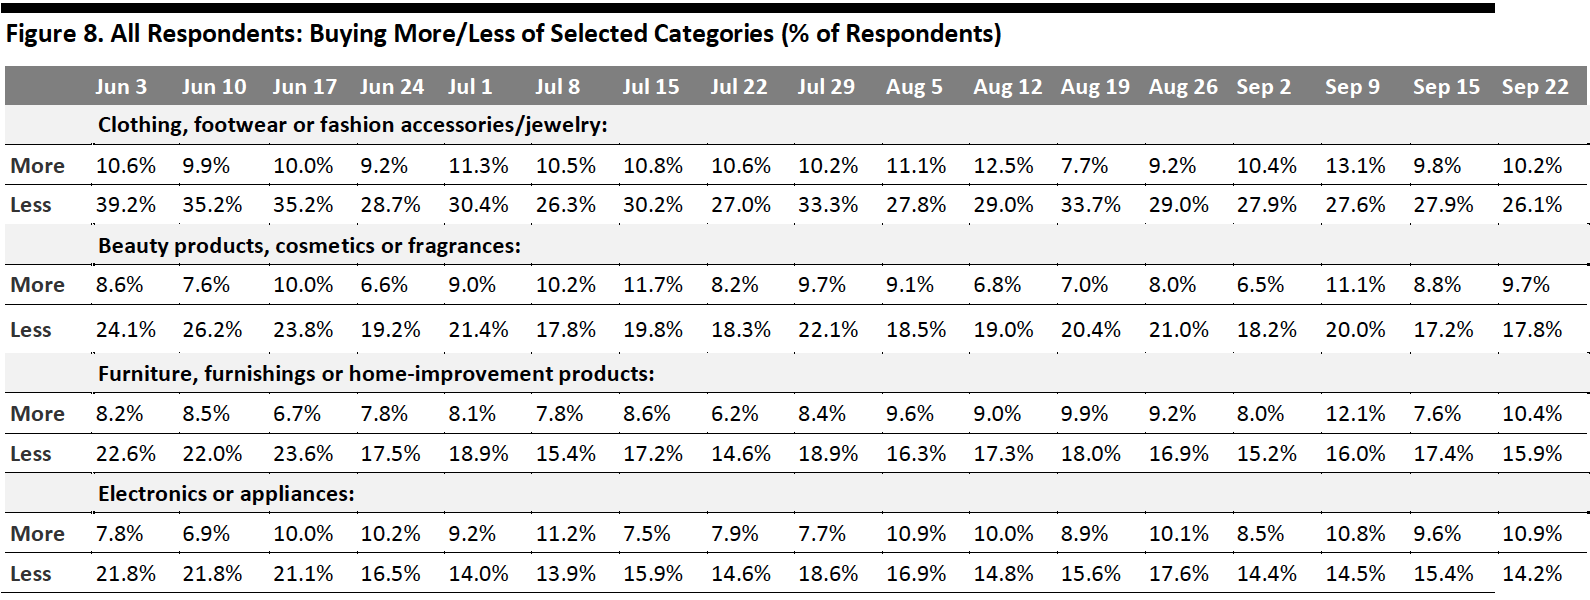
This week, the proportion of respondents that are currently buying more than before the crisis increased slightly to 61.4% from 57.8% last week. The proportion of respondents that are currently buying less than pre-crisis broadly leveled off at 51%.
- Buying more of certain categories and buying less of certain categories were not mutually exclusive options, so respondents could answer yes to both.
Buying more: Essentials, including household products and personal care, continue to be the most-purchased categories, while health products overtook food as one of the top three categories of which consumers are currently buying more than pre-crisis. Some 27.5% are buying more food than they used to, versus three in 10 last week.
Buying less: Discretionary categories—including clothing and footwear, beauty and home—remained the most-cut categories, with the highest proportions of consumers currently buying less of such products. Some 26.1% are currently buying less apparel; although clothing and footwear is still the most-cut category, this is the lowest level we have seen since April. The proportions of respondents that are currently buying less in both home and electronics also dropped slightly week over week.
Ratio of less to more: The ratios of the proportions of respondents buying less to the proportions buying more in all four discretionary categories tracked in Figure 8 declined, after slight increases last week.
- The ratio for clothing and footwear fell to 2.6, from 2.9 last week.
- The ratio for beauty returned to the level we saw two weeks ago at 1.8, versus 1.9 last week.
- The ratio for home came at 1.5, down from 2.3 last week.
- The ratio for electronics stood at 1.3, versus 1.6 last week.
 Respondents could select multiple options
Base: US Internet users aged 18+
Source: Coresight Research[/caption] [caption id="attachment_116765" align="aligncenter" width="700"]
 Base: US Internet users aged 18+
Source: Coresight Research[/caption]
Almost Three-Quarters Are Switching Spending Online
This week, we saw the proportion of consumers buying more online than they used to jump to the highest level since July. Some 73.5% are currently buying more online, up seven percentage points from two-thirds last week. This could suggest that consumers are switching some of their spending back to e-commerce, as avoidance rates in shopping centers/malls and shops in general both went up this week, as discussed above.
[caption id="attachment_116766" align="aligncenter" width="700"]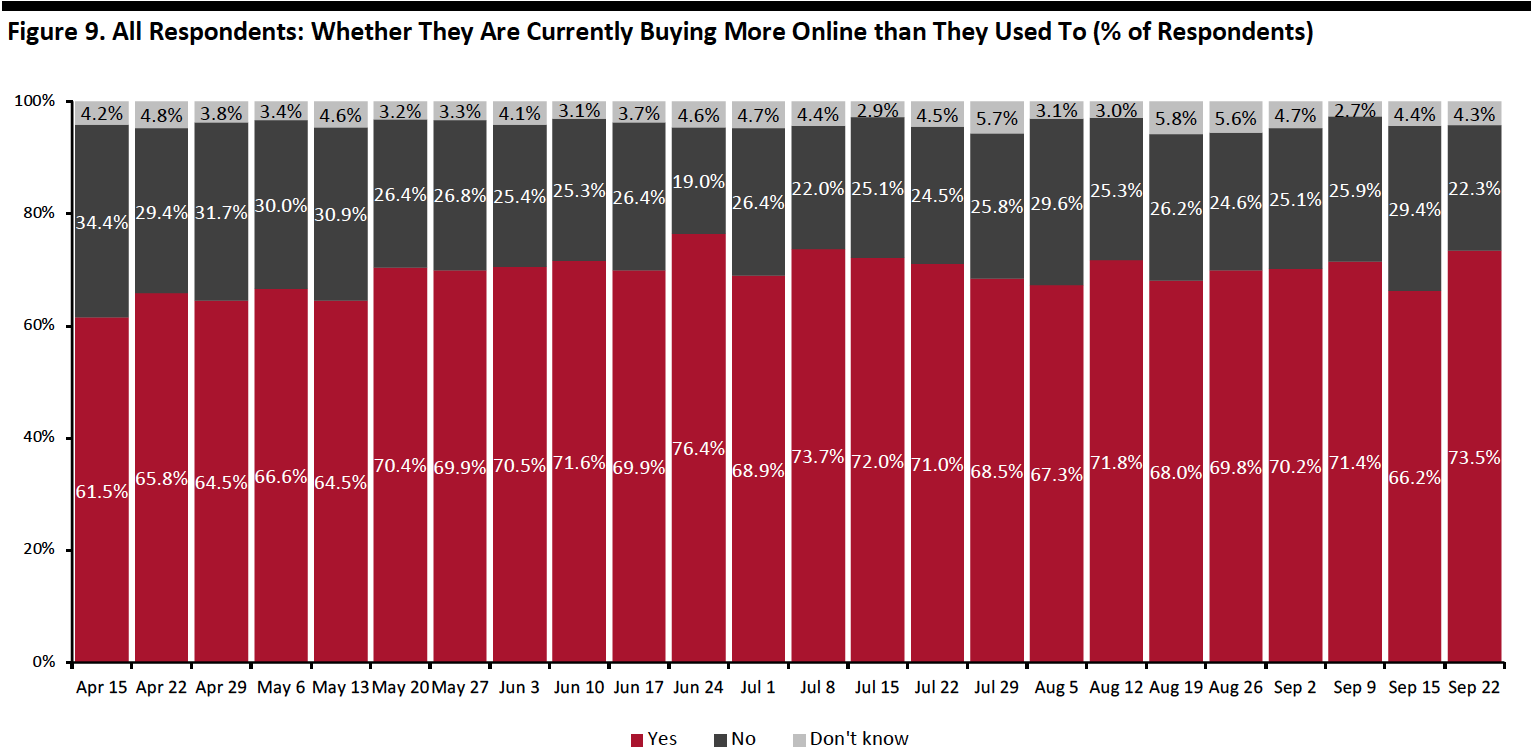 Base: US Internet users aged 18+
Source: Coresight Research[/caption]
What Consumers Are Currently Buying More Of Online
Looking at specific categories, nine of the 13 categories we provided as options saw week-over-week increases in consumers buying more online than pre-crisis, although all changes were within margin of error.
The household product and personal care categories topped the list of consumers’ online purchasing behavior. Some 27.0% are buying more health products online than before the crisis, making it the third-most-purchased category online this week.
Online purchases of food rebounded a little, after declining last week to the lowest level we have seen in months. Some 24.6% are buying more food online, versus 21.6% last week.
The proportion of respondents that are currently buying more apparel online remained broadly level at around 27%, aligned with previous finding of a stable proportion of 32% of consumers had bought apparel online in the past two weeks. Online purchases of other discretionary categories, including home and electronics, both went up slightly to the highest level we have seen since July. Some 12.3% are buying more home products online, and 17.3% are buying more electronics online.
[caption id="attachment_116767" align="aligncenter" width="700"]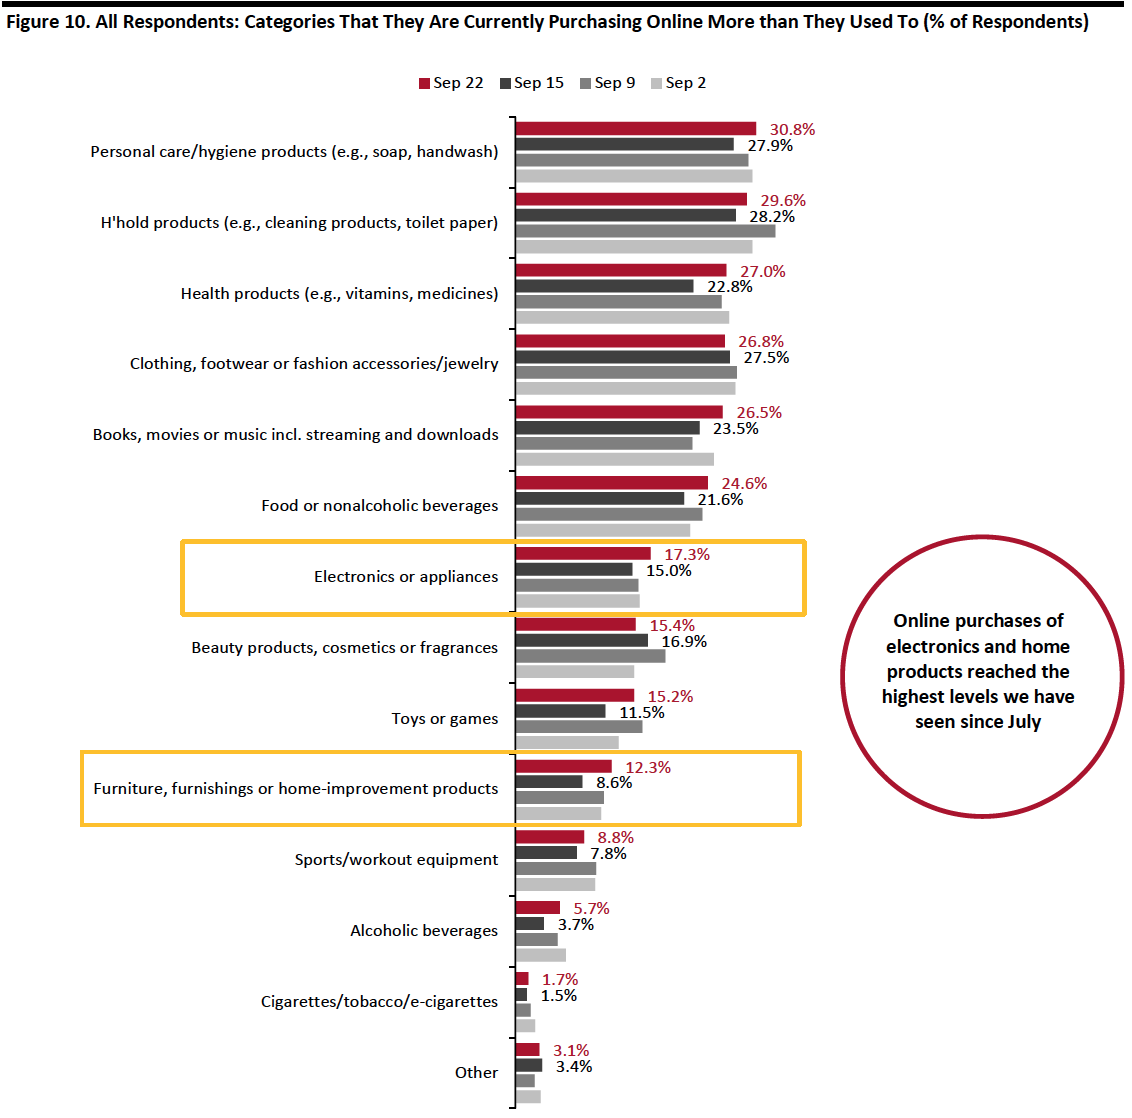 Respondents could select multiple options
Base: US Internet users aged 18+
Source: Coresight Research[/caption]
What We Think
Halloween celebration is going to be different this year due to the pandemic. Our survey found that among consumers that typically celebrate Halloween, 56.3% plan to spend less than last year or nothing on Halloween this year. Traditional celebrants still expect to celebrate Halloween amid the pandemic, focusing on decorating their home and dressing in costumes—so we are likely to see relatively strong consumer demand for seasonal decorations and costumes in a total Halloween market that looks set to decline year over year. See our Halloween 2020 Preview, publishing this week, for more data and analysis on this year’s Halloween.
This week, we saw the following:
- Apparel: Clothing and footwear remained the most-cut category this week, but we saw the proportion of consumers that are buying less in apparel fall to 26.1%—the lowest level we have seen since April. We saw online apparel purchases broadly level off this week: A stable proportion of 32% had bought clothing or footwear online in the past two weeks, and about 27% are currently buying more apparel online than pre-crisis. However, in-store apparel shopping in the past two weeks fell to 21.6%, following the peak of 26.0% last week.
- Online Grocery: The proportion that had bought groceries online in the past two weeks remained relatively stable at around 29% after seeing fluctuations of such activity in the past few weeks. One-quarter of consumers are buying more food online than before the crisis this week, slightly more than last week, although the change was within the margin of error. For more data on the trajectory of online grocery, keep an eye out for our monthly US CPG Sales Tracker report, publishing this week, for exclusive data on online CPG sales growth.
- E-Commerce: This week, we saw the proportion of consumers that are currently buying more online than they used to spike by seven percentage points to the highest level we have seen since July, at 73.5%, compared to two-thirds last week. This may imply that consumers are switching some of their spending back to e-commerce, as avoidance rates in shopping centers/malls and shops in general both went up this week. We could see e-commerce remain at this elevated level as we move toward the holiday season. See our US E-Commerce: Post-Crisis Outlook report for more data and analysis, and our forthcoming US holiday survey report for data on consumers’ expected holiday shopping behavior and spending.
Methodology
We surveyed respondents online on September 22 (422 respondents), September 15 (408 respondents), September 9 (406 respondents), September 2 (402 respondents), August 26 (414 respondents), August 19 (416 respondents), August 12 (400 respondents), August 5 (449 respondents), July 29 (403 respondents), July 22 (404 respondents), July 15 (454 respondents), July 8 (410 respondents), July 1 (444 respondents), June 24 (411 respondents), June 17 (432 respondents), June 10 (423 respondents), June 3 (464 respondents), May 27 (422 respondents), May 20 (439 respondents), May 13 (431 respondents), May 6 (446 respondents), April 29 (479 respondents), April 22 (418 respondents), April 15 (410 respondents), April 8 (450 respondents), April 1 (477 respondents), March 25 (495 respondents) and March 17–18 (1,152 respondents). The most recent results have a margin of error of +/- 5%, with a 95% confidence interval. Not all charted week-over-week differences may be statistically significant.