
albert Chan
We discuss select findings and compare them to those from prior weeks: November 17, November 10, November 3, October 27, October 20, October 13, October 6, September 29, September 22, September 15, September 9, September 2, August 26, August 19, August 12, August 5, July 29, July 22, July 15, July 8, July 1, June 24, June 17, June 10, June 3, May 27, May 20, May 13, May 6, April 29, April 22, April 15, April 8, April 1, March 25 and March 17–18.
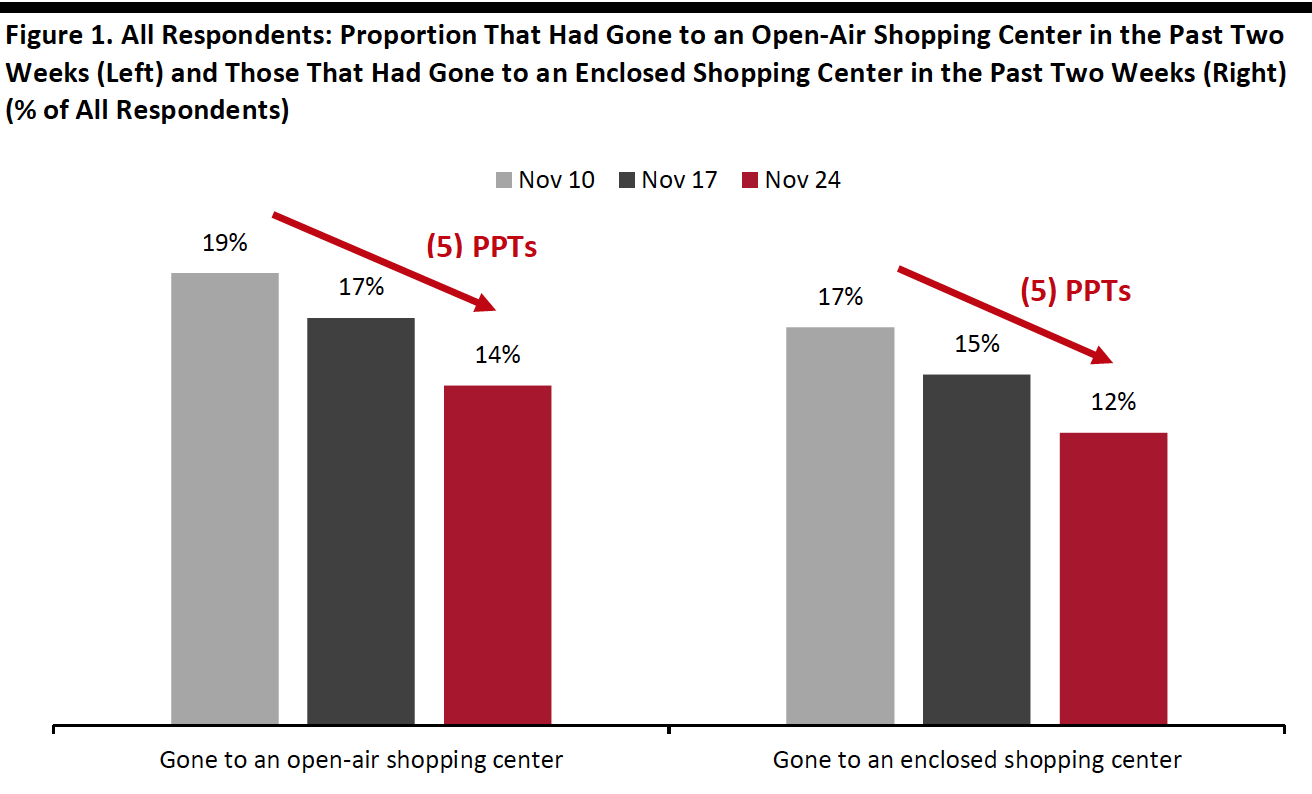
1. Fewer Consumers Visited Shopping Centers in the Past Two WeeksThis week, we have seen a declining trend in consumers’ visits to both open-air and enclosed shopping centers, even as we head further into the holiday shopping season. Some 14% had visited an open-air shopping center in the past two weeks and only 12% had gone to an enclosed shopping center, both down by around five percentage points from the proportions we saw two weeks ago. This is aligned with the high avoidance rate in such locations, which we discuss in the next section.
By age group, visits to both types of shopping centers peaked among respondents aged 45–60 this week. Despite the overall downward trend, this age group still saw uptick of almost five percentage points in the proportion that had gone to an enclosed shopping center.
- See our full report for complete results on activities respondents had done in the past two weeks and their expected activities for the next two weeks.
 Base: US respondents aged 18+
Source: Coresight Research[/caption] 2. Over Eight In 10 Are Avoiding any Public Places
This week, the avoidance rate of any type of public area remained at an elevated level: Some 82% said that they are currently avoiding any public area, roughly the same as that last week. Despite the high overall avoidance rate, we saw week-over-week decreases in the avoidance for almost all of the 13 options provided, although most changes were within the margin of error.
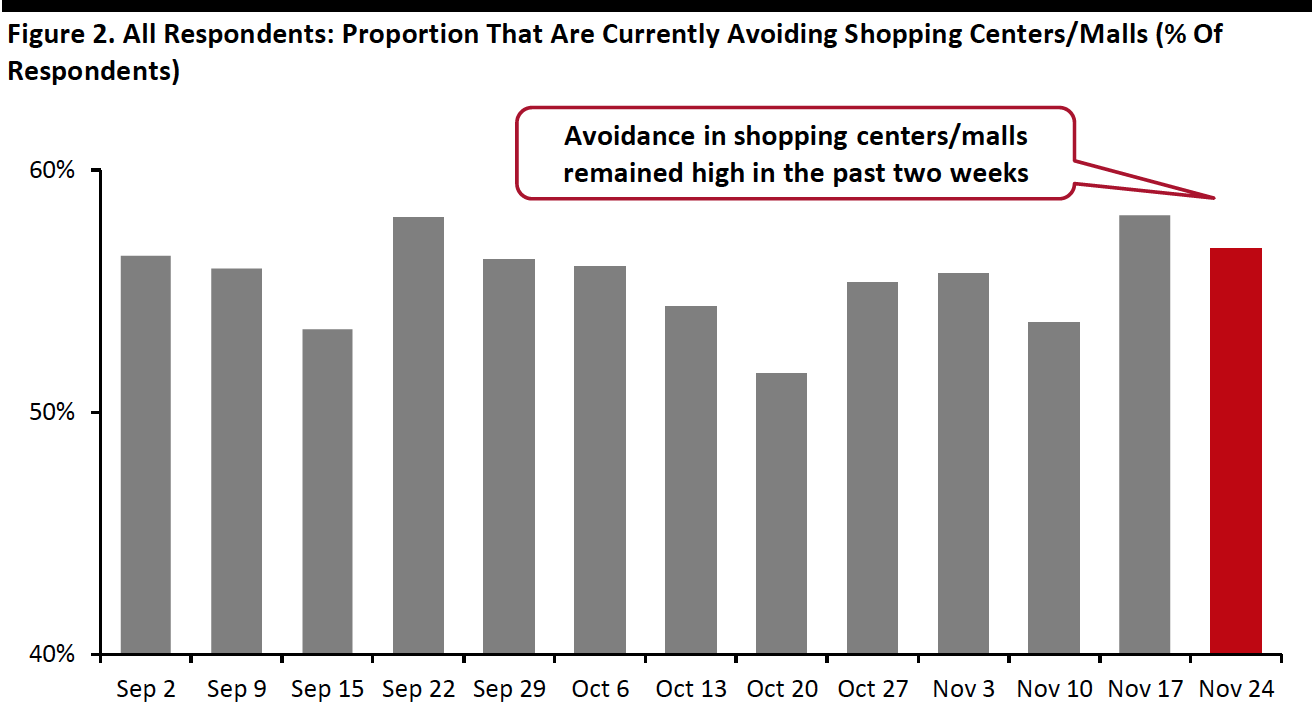
- Shopping malls/centers continued to be the most-avoided public places. The proportion of respondents that are currently avoiding such locations stood at 57%, versus 58% last week. Looking at the monthly average results, avoidance of shopping centers/malls has increased month over month from October to November.
- Avoidance of shops in general has been fluctuating in November. This week, some 43% are currently avoiding such places, compared to 45% last week.
- Sports events saw the highest week-over-week decline of nine percentage points to the lowest level since July.
 Base: US respondents aged 18+
Source: Coresight Research[/caption] 3. Improvements in Purchases of Some Discretionary Categories
Some discretionary categories, such as home, electronics and toys/games, saw improvements in purchases this week as we move further into the holiday season.
The proportion of consumers buying more in home, electronics and toys/games than before the crisis all increased slightly week over week, while the proportion for those currently buying less in these three categories declined. This results in lower ratios of consumers buying less to those buying more week over week:
- The ratio for home went down from 3.0 last week to 1.7—the ratio we saw consistently in the weeks before last week.
- The ratio for electronics stood at 1.1, versus 1.4 last week and is the lowest level witnessed in November.
- Toys/games, which is a popular category for the holiday season, saw its ratio decrease to the lowest level ever at 0.5 this week, from 0.7 last week.