albert Chan
What’s the Story?
This report presents the results of Coresight Research’s latest weekly survey of US consumers, including on the impacts of the coronavirus outbreak, undertaken on November 24, 2020. We explore the trends we are seeing from week to week, following prior surveys on November 17, November 10, November 3, October 27, October 20, October 13, October 6, September 29, September 22, September 15, September 9, September 2, August 26, August 19, August 12, August 5, July 29, July 22, July 15, July 8, July 1, June 24, June 17, June 10, June 3, May 27, May 20, May 13, May 6, April 29, April 22, April 15, April 8, April 1, March 25 and March 17–18.
What Shoppers Are Doing and Where They Are Going
Fewer Consumers Had Visited Shopping Centers in the Past Two Weeks
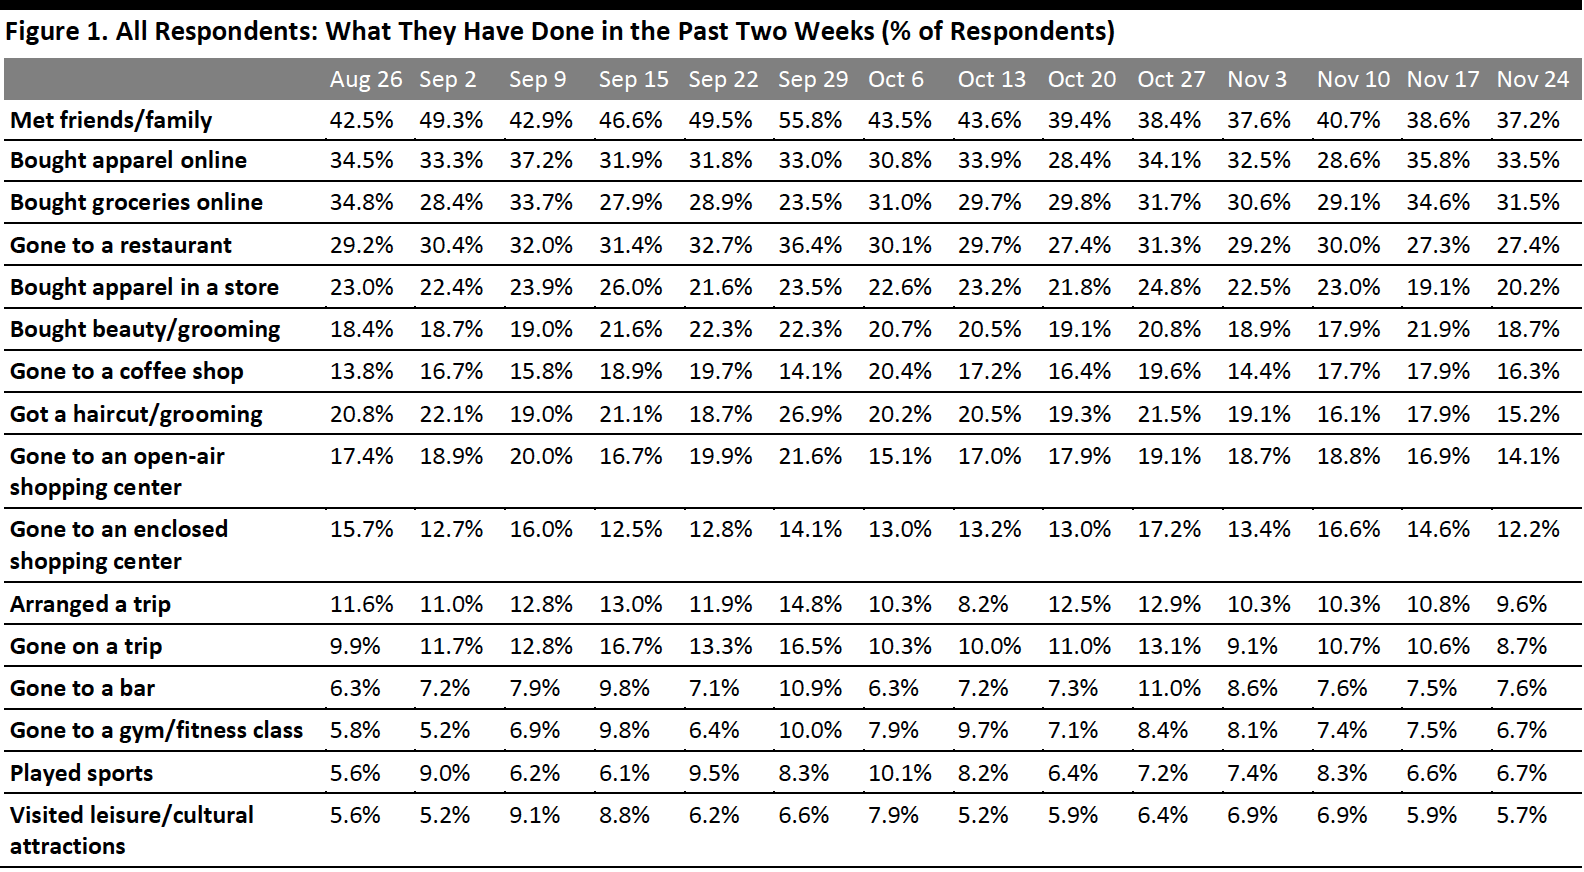
Each week, we ask consumers what they have done in the past two weeks. This week, the proportion of respondents slightly decreased for 10 of the 16 options we provided for recent activities. All of the week-over-week changes were within the margin of error; however, the directional trends, including over a number of weeks, can prove informative.
Even as we move further into the holiday shopping season, consumers appear to be visiting shopping centers less:
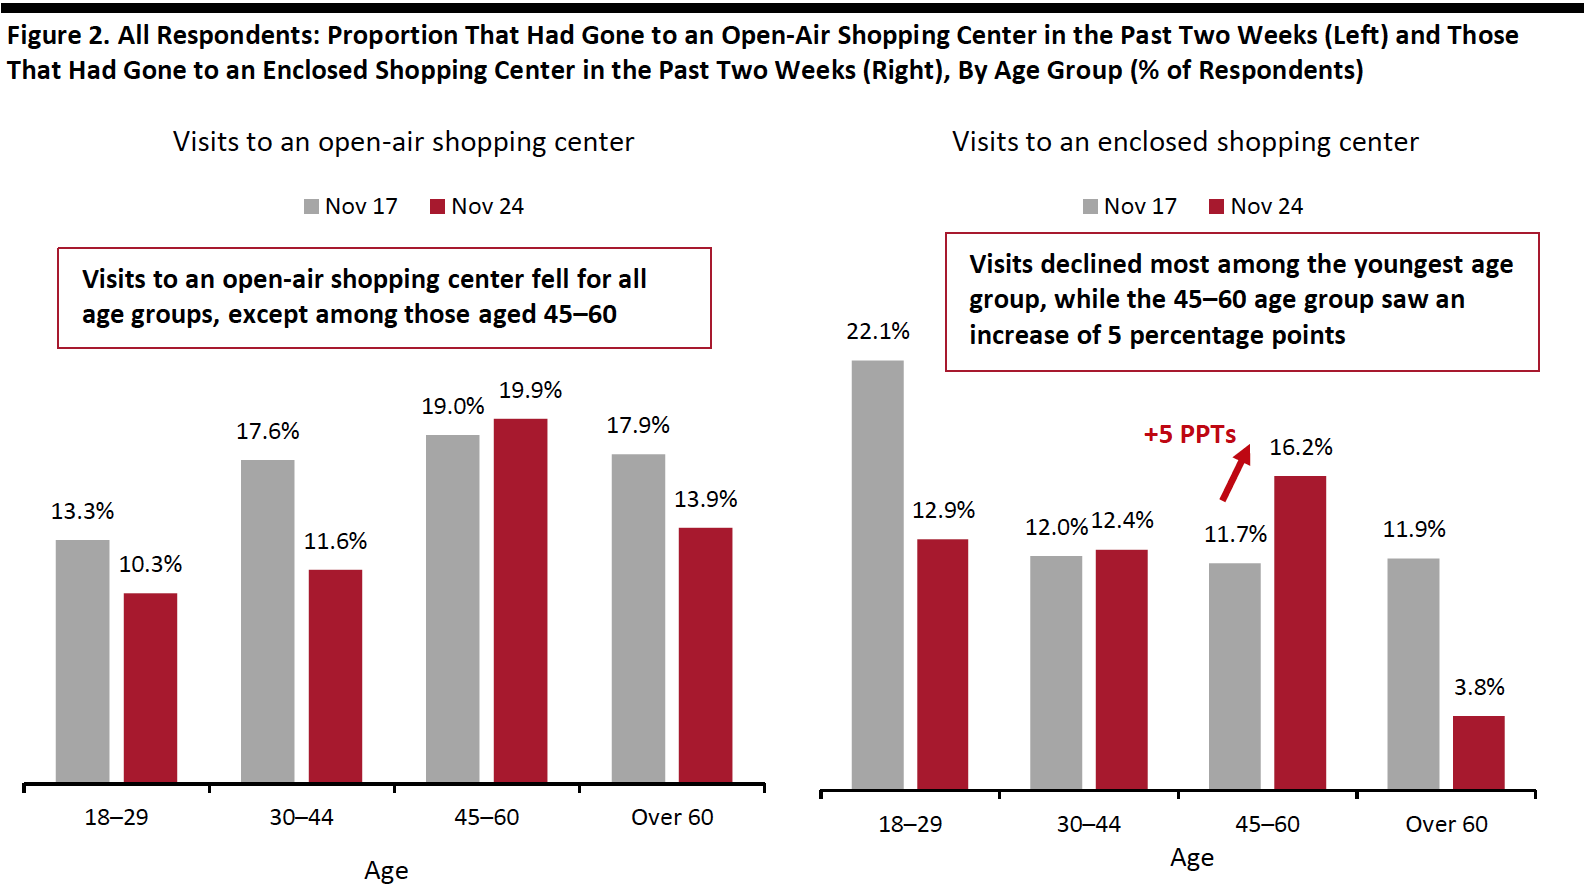
- We have seen a declining trend in consumers’ visits to both open-air and enclosed shopping centers. Some 14.1% had visited an open-air shopping center and only 12.2% had gone to an enclosed shopping center, both down by almost five percentage points from the proportion two weeks ago. This is aligned with the high avoidance rate in such locations, which we discuss later in this report. Looking at age distribution (shown in Figure 2), visits to both types of shopping centers peaked among respondents aged 45–60 this week. Despite the overall downward trend, this age group still saw an uptick of almost five percentage points in the proportion that had gone to an enclosed shopping center.
- Online apparel shopping fell back slightly this week, after reaching the highest level in two months last week. The proportion of respondents that had bought clothing, footwear or accessories online in the past two weeks stood at 33.5%, versus 35.8% last week. This compared to one-fifth that had bought apparel in-store, which went up very little from 19.1% last week but was still lower than the level we saw in October and first two weeks of November. The difference we saw between those that had bought apparel in-store and online in recent weeks, of 17 percentage points last week and 13 percentage points this week, was much higher this week, reflecting consumers’ preference to shop for apparel online during the holiday season.
- The proportion of consumers that had bought groceries online also dropped back slightly following an increase of almost six percentage points last week. Some 31.5% had bought groceries online, versus 34.6% last week. Visits to food-service locations remained low: Some 27.4% had dined in a restaurant, level with last week, and 16.3% had gone to a coffee shop, versus 17.9% last week.
 Respondents could select multiple options
Base: US respondents aged 18+
Source: Coresight Research[/caption] [caption id="attachment_120035" align="aligncenter" width="700"]
 Base: US respondents aged 18+
Source: Coresight Research[/caption]
More Consumers Expect To Visit an Enclosed Shopping Center than Actual Behaviour Indicates
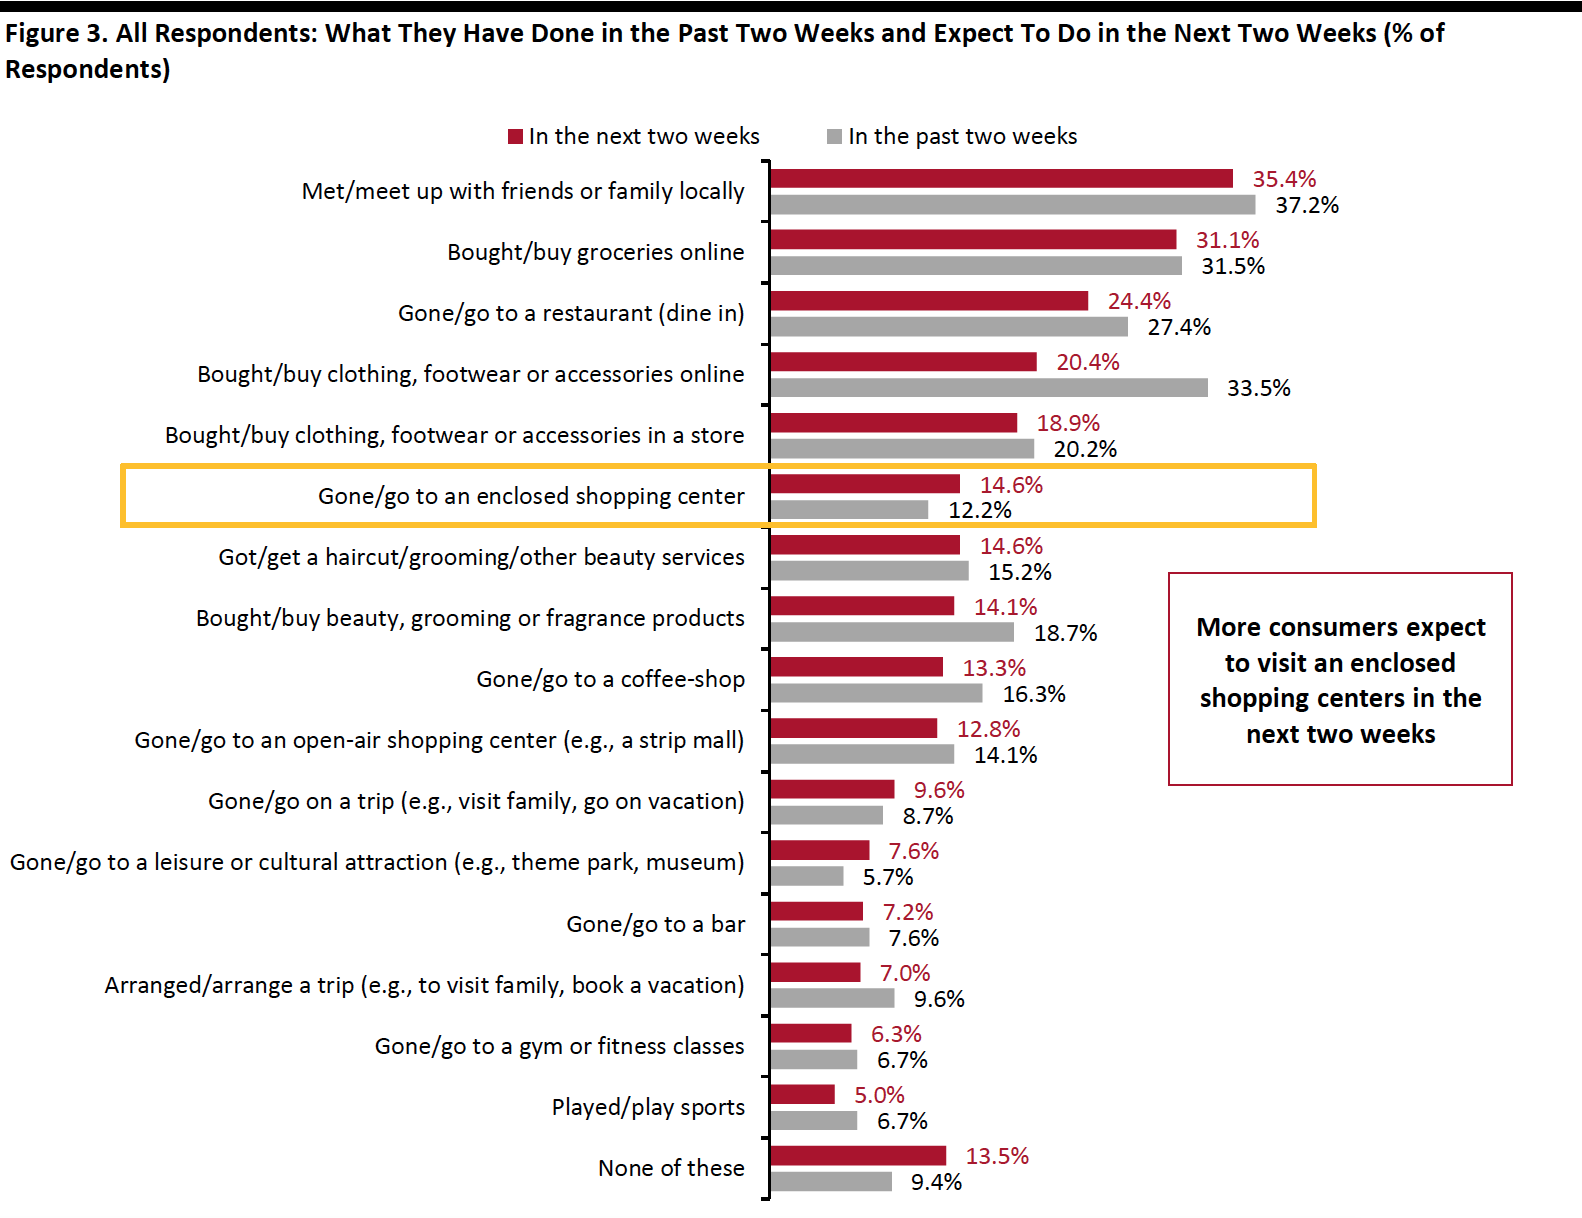
Each week, we also ask consumers what they expect to do in the next two weeks, with a set of options comparable to those for the last two weeks. In Figure 3, we compare these short-term expectations with recent actual behavior.
We saw slightly lower proportions of consumers expecting to do nine of the 16 options we provided for activities in the next two weeks than actual behavior in the past two weeks.
For the next two weeks, slightly more consumers expect to visit an enclosed shopping center compared to the indications from recent actual behavior:
- Online grocery shopping continued to be the top spending-related activity that consumers expect to do in the next two weeks, with roughly the same proportion (31%) of consumers planning to do so as the recent actual behavior indicates.
- We saw slightly more consumers respond that they expect to go to an enclosed shopping center than recent actual behavior indicates, with 14.6% planning to do so in the next two weeks. Expectations to visit an enclosed shopping center also exceeded those related to visiting an open-air shopping center, which could be due to the colder weather now.
- The proportion of respondents that expect to buy clothing or footwear online came in at one-fifth, versus 22.6% last week. Some 18.9% plan to make purchases in this category in a store, up by five percentage points from 14.1% last week. This reflects some consumers’ plans to partially shift online apparel purchases to in-store in the next two weeks. Based on past survey results, we also expect to see higher proportions in actual behavior for both online and in-store apparel shopping than expected levels next week.
 Respondents could select multiple options
Base: US respondents aged 18+
Source: Coresight Research[/caption]
Over Eight in 10 Are Currently Avoiding Public Places
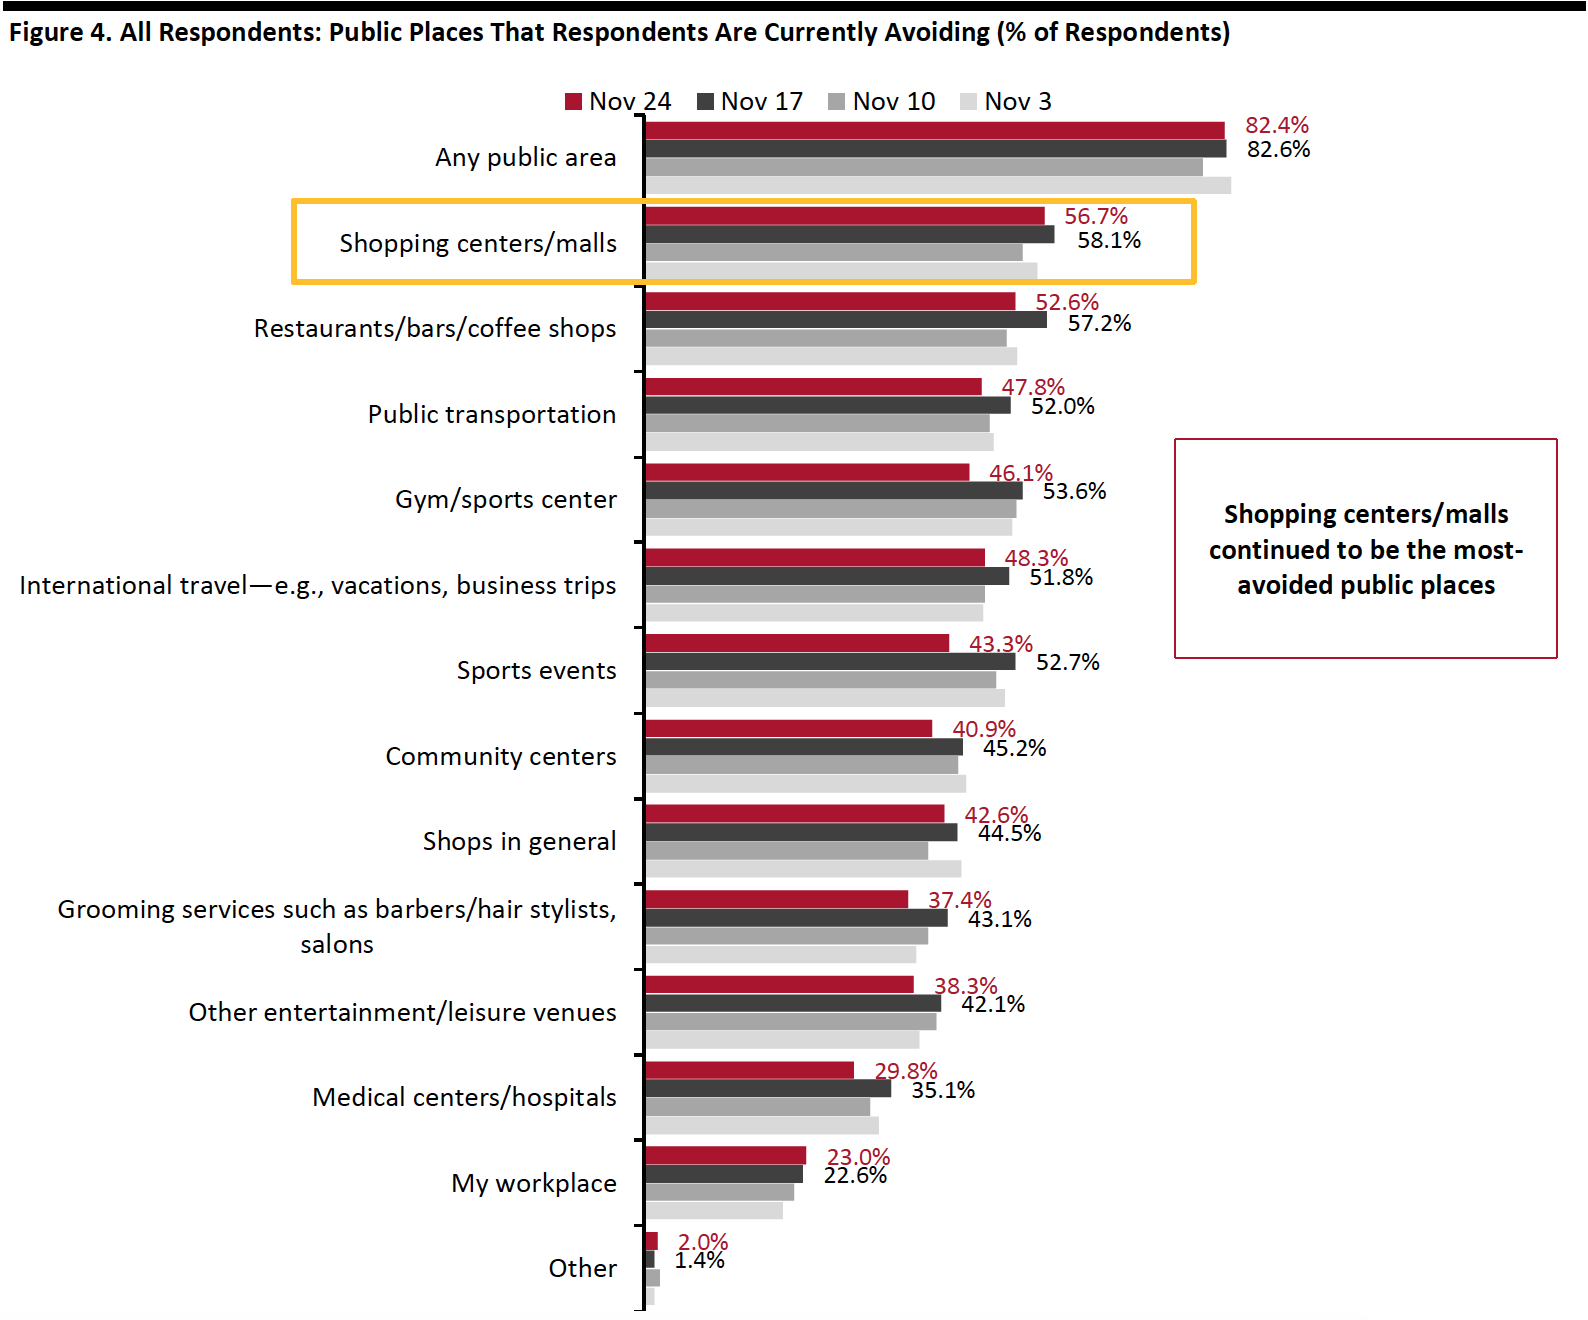
This week, the avoidance rate of any type of public area remained at an elevated level: Some 82.4% said that they are currently avoiding any public area, which is roughly the same as last week.
Despite the high overall avoidance rate, we saw week-over-week decreases in the avoidance for almost all of the 13 options provided, although most changes were within the margin of error.
Avoidance of retail locations and food-service locations decreased slightly this week:
- The proportion of respondents that are currently avoiding shopping centers/malls dropped slightly after jumping to the highest level in months last week. Some 56.7% are avoiding such locations, versus 58.1% last week. Looking at the monthly average results, avoidance in shopping centers/malls has increased month over month from October to November.
- Food-service locations saw a decline of five percentage points in the avoidance rate week over week, from 57.2% last week to 52.6% this week—roughly the level we saw in the first week of November.
- Avoidance of shops in general has been fluctuating in November. This week, some 42.6% of respondents are currently avoiding such places, compared to 44.5% last week.
- Sports events saw the highest week-over-week decline of nine percentage points to the lowest level since July.
 Respondents could select multiple options
Base: US respondents aged 18+
Source: Coresight Research[/caption]
Reviewing Trend Data in Current Purchasing Behavior
What Consumers Are Currently Buying More Of and Less Of
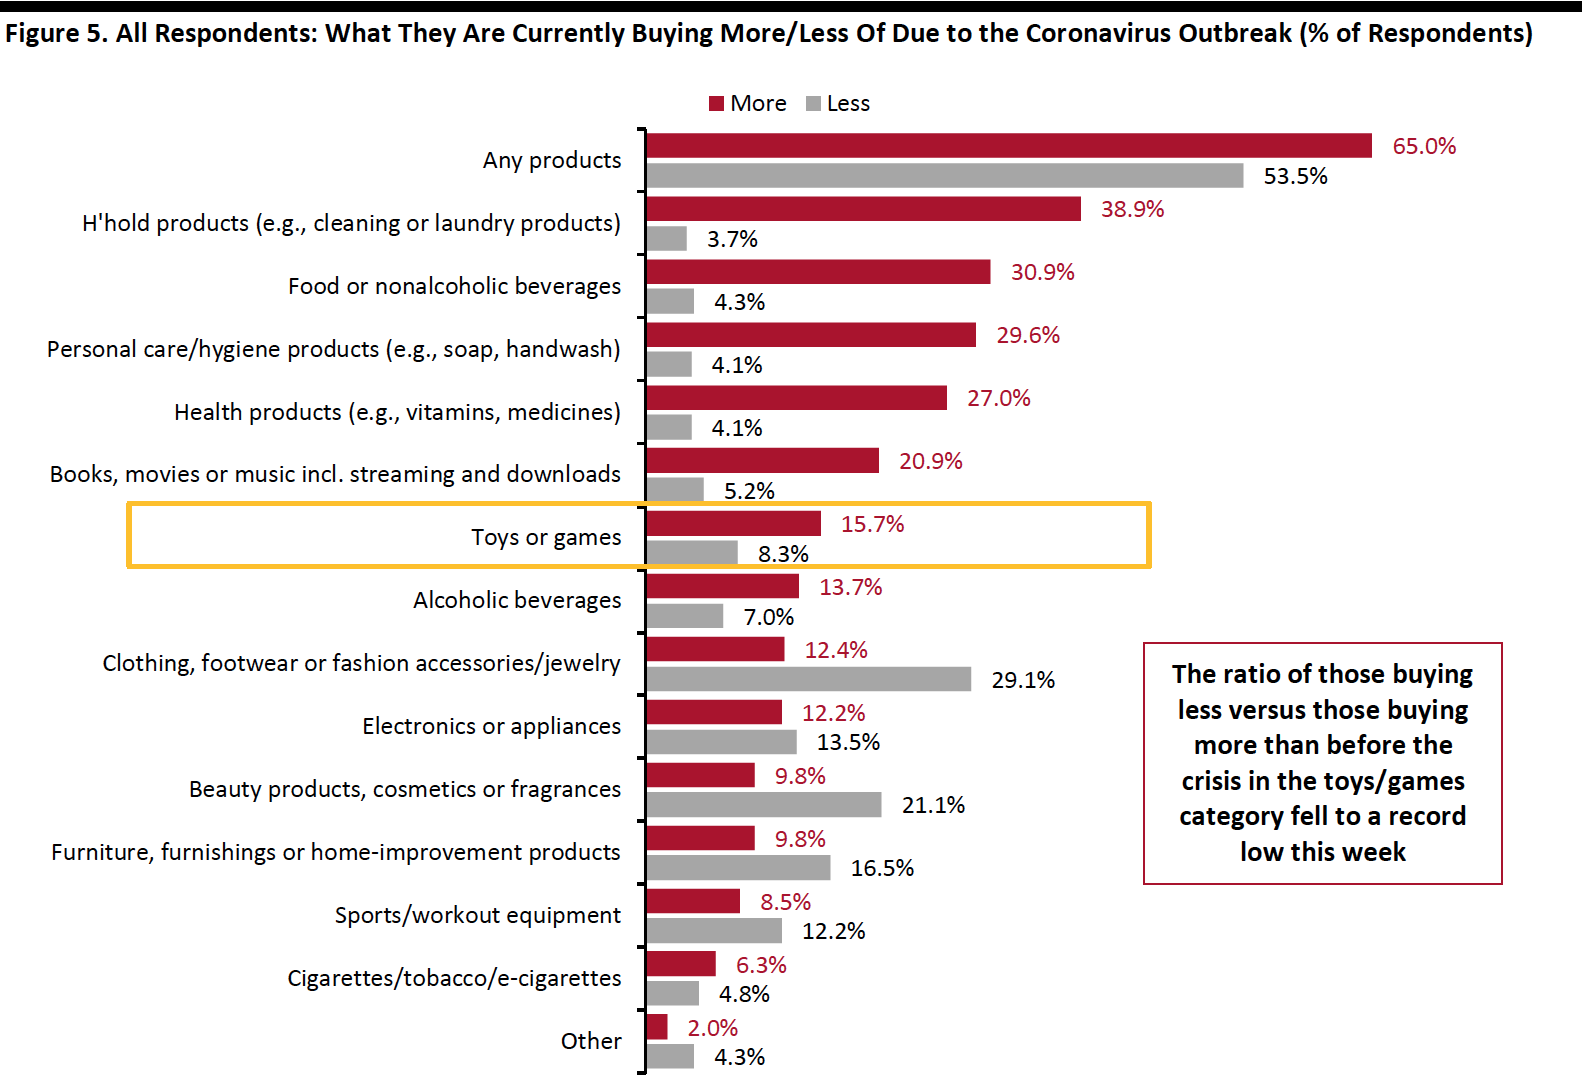
In recent weeks, we have seen fluctuation in the proportion of respondents that are currently buying more of any product due to the coronavirus crisis. This week, some 65.0% are currently buying more, compared to 69.4% last week. The proportion of respondents that are currently buying less than pre-crisis remained relatively stable, with 53.5% doing so this week, versus 52.9% last week.
- Buying more of certain categories and buying less of certain categories were not mutually exclusive options, so respondents could answer yes to both.
Buying more: Essentials—including household products, personal care and food—remained the most-purchased categories, although all proportions returned to the levels we saw two weeks ago. Personal care saw the largest drop, of 11 percentage points week over week. The proportion of consumers that are currently buying more home products bounced back after falling to its lowest level last week, while other discretionary categories, such as apparel, beauty and electronics broadly leveled off this week.
Buying less: Electronics and home categories both saw week-over-week improvements in purchases, with smaller proportions of consumers buying less than before the crisis from last week. The proportions of consumers that are currently buying more apparel and beauty both remained relatively stable from last week.
Ratio of less to more: The ratios of the proportion of respondents buying less to the proportion buying more in apparel and beauty increased, while the ratios for other discretionary categories including home, electronics and toys/games slid.
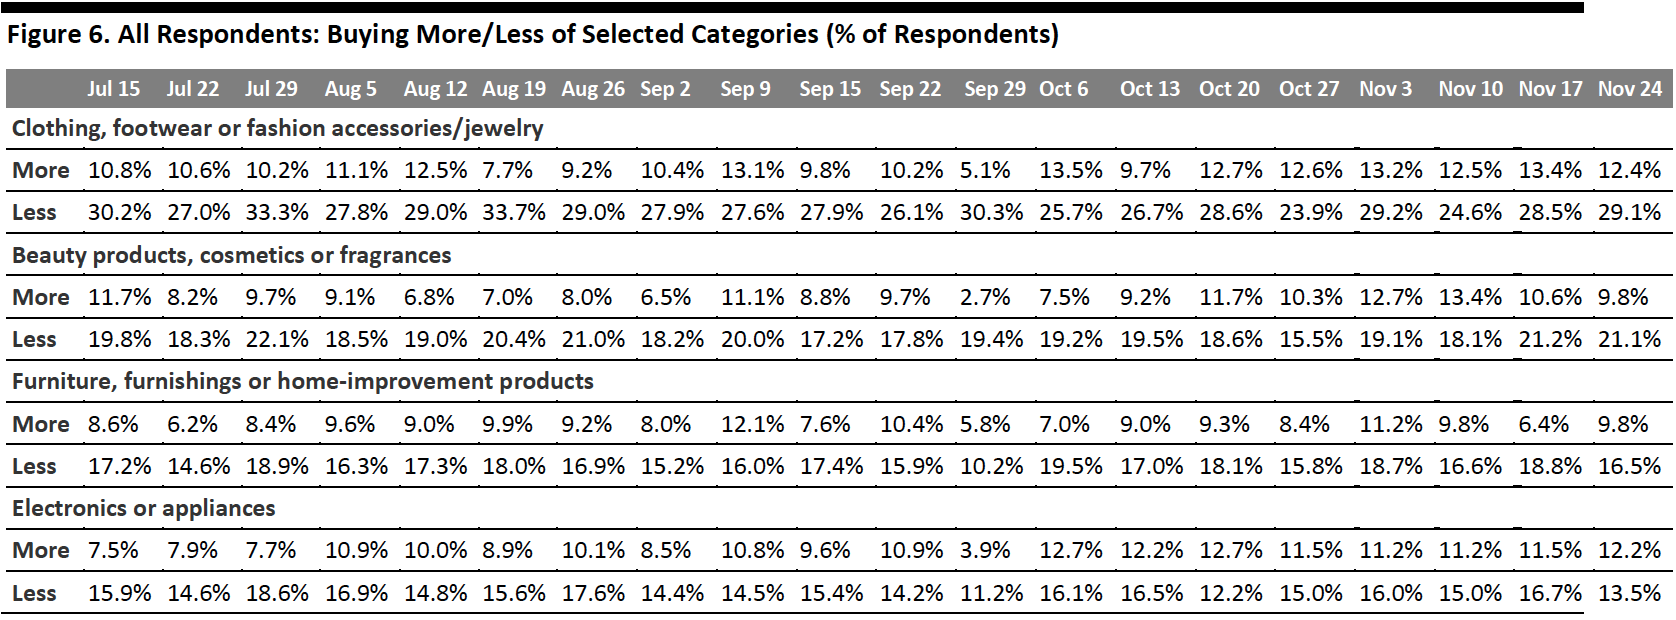
- The ratio for clothing and footwear increased again this week to 2.4, from 2.1 last week and 2.0 two weeks ago, although we are moving further into the holiday season and apparel is a top gifting category.
- The ratio for beauty jumped to 2.2, from 2.0 last week.
- The ratio for home went down from 3.0 last week to 1.7—the ratio we saw consistently in the weeks before last week. This suggests that the continued strength in home categories and last week’s metric could be just a one-off.
- The ratio for electronics stood at 1.1, versus 1.4 last week, which is the lowest level witnessed in November.
- A popular category for the holiday season, toys/games saw its ratio of buying less to more decrease to the lowest level ever at 0.5 this week, from 0.7 last week.
 Respondents could select multiple options
Base: US respondents aged 18+
Source: Coresight Research[/caption] [caption id="attachment_120039" align="aligncenter" width="700"]
 Base: US respondents aged 18+
Source: Coresight Research[/caption]
Over Seven In 10 Are Switching Spending Online
The proportion of consumers buying more online than they used to stood at 71.3%, compared to 72.5% last week. Online shopping has appeared to experience a very slight downward trend in recent weeks (changes were within the margin of error), but the level has remained above 70%—despite the previously discussed fluctuations in the proportion of consumers buying more in any category overall than before the crisis in the past couple of weeks. Looking at the monthly average, the e-commerce level has increased by five percentage points from September to November.
[caption id="attachment_120040" align="aligncenter" width="700"]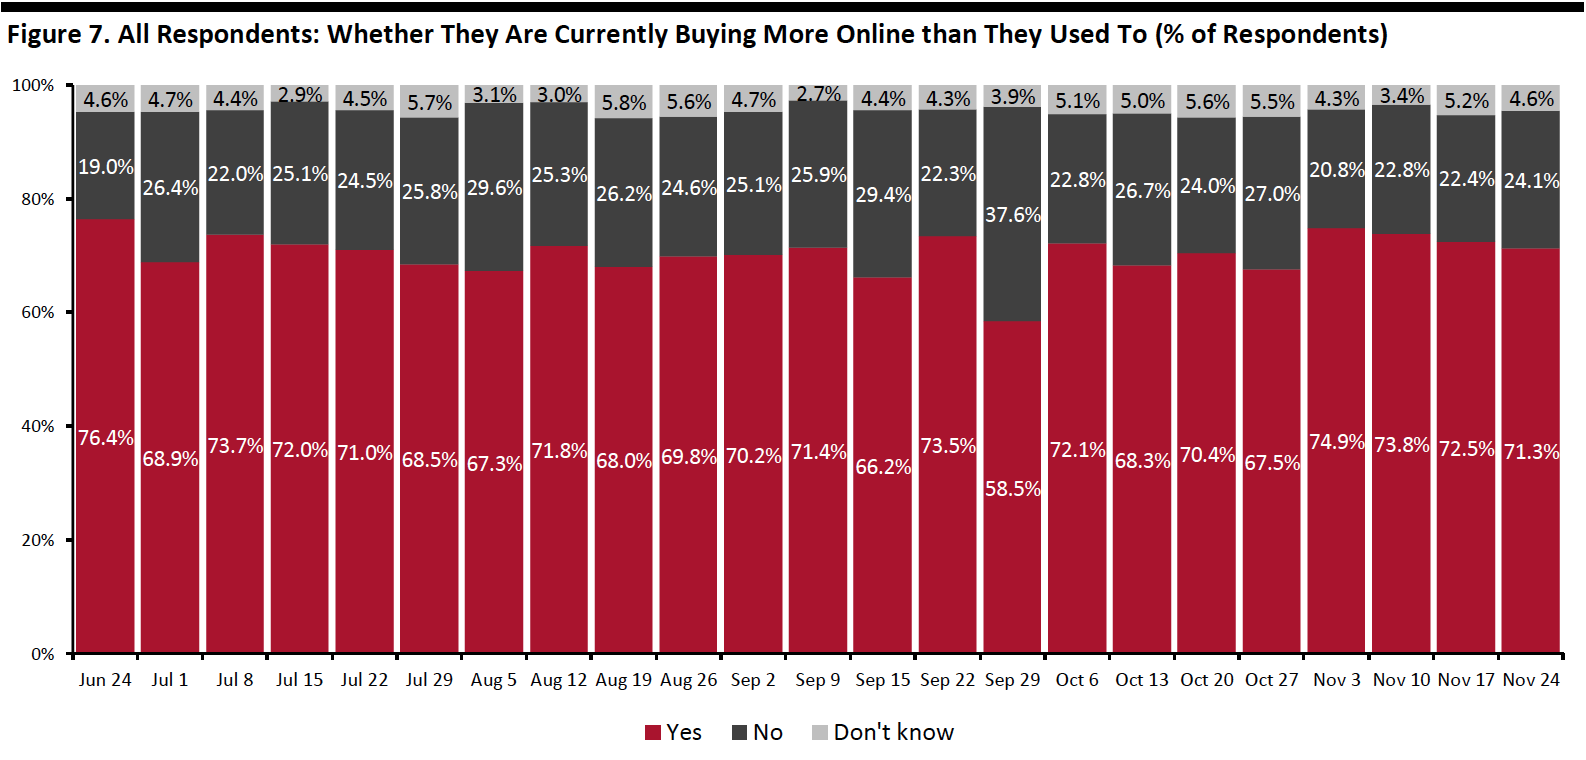 Base: US respondents aged 18+
Source: Coresight Research[/caption]
What Consumers Are Currently Buying More Of Online
Looking at specific categories, eight of the 13 options we provided saw week-over-week declines in consumers buying more online than pre-crisis, although most of the changes were within the margin of error.
Everyday household products declined again this week, to 30.9% from 34.1% last week and 39.1% two weeks ago. Books, movies or music saw the largest cutbacks in online purchases, of nine percentage points, dropping to the lowest level in months.
The proportion of consumers buying more food online was level with that last week, at 24.6%, although slightly fewer consumers had bought groceries online in the past two weeks, as discussed earlier.
The proportions of consumers buying more clothing, footwear or accessories, and electronics both remained stable week over week. Online purchases for home products improved slightly, to 12.4% from 8.9% last week.
[caption id="attachment_120041" align="aligncenter" width="700"]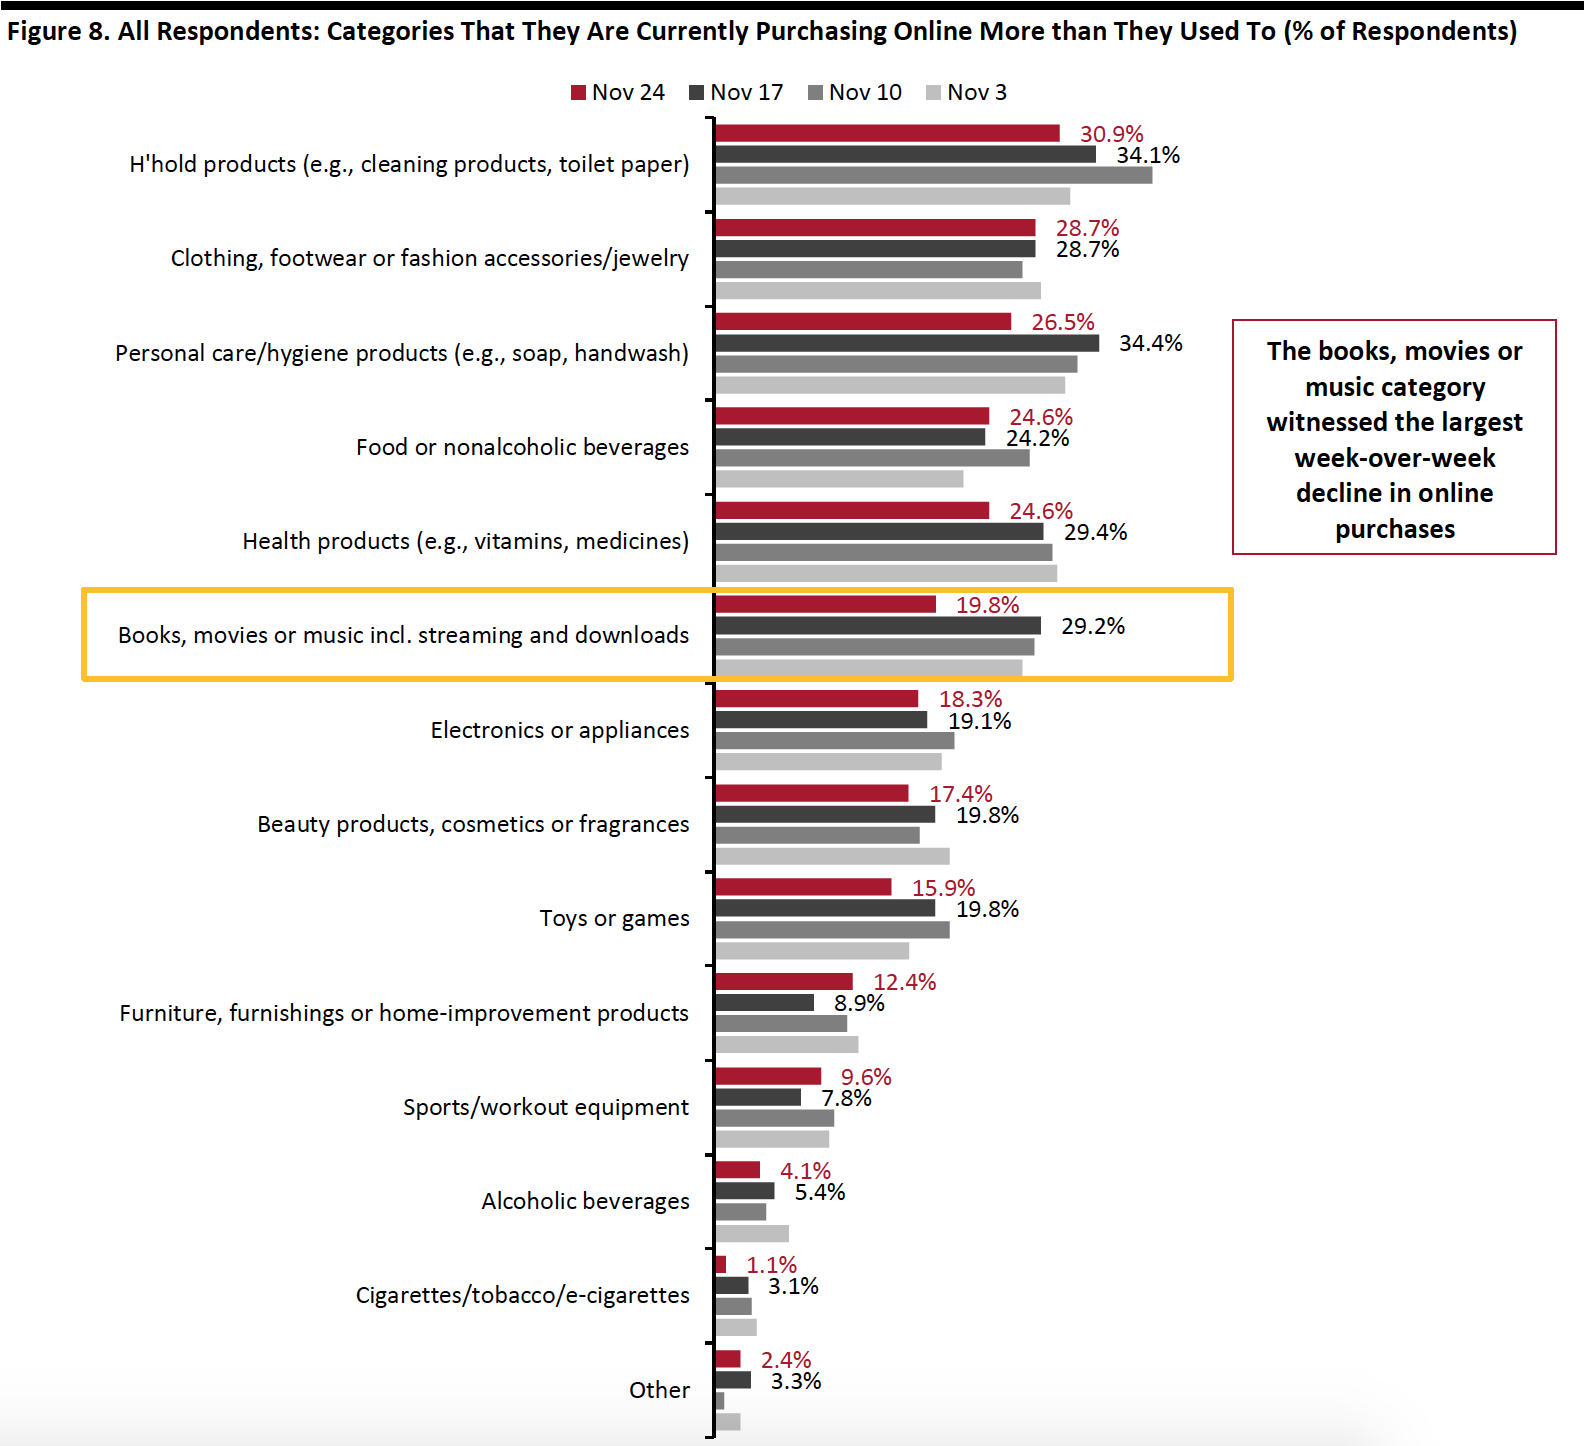 Respondents could select multiple options
Base: US respondents aged 18+
Source: Coresight Research[/caption]
What We Think
This week, we saw the following from our recurring weekly questions:
- Apparel: This week’s survey revealed that respondents have made slightly fewer purchases in clothing, footwear or accessories over the latest two-week period compared to our previous survey. The ratio of buying less to more than pre-crisis in the apparel category increased week over week, possibly due to consumers’ partial spending shift to some other discretionary categories, such as home, electronics and toys/games, which all saw improvements in purchases this week. Online was still preferred by consumers for apparel shopping—with around one-third of respondents reporting that they had bought apparel online, versus one-fifth that had bought apparel in-store in the past two weeks. In a separate question, we also saw that a stable proportion of respondents, approximately 29%, are currently buying more apparel online than pre-crisis in recent weeks, higher than the average of one-quarter in October.
- Online Grocery: Showing great resilience, it looks like this trend is here to stay. This week, the proportion of shoppers that had bought groceries online in the latest two-week period stood at 31.5%, versus 34.6% last week. Looking at the recent monthly average trend, our survey found that the this metric has increased slightly from September to November. This supports our expectation of 60+% year-over-year growth in online food sales during the holiday period, which will propel full-year 2020 growth to around 75%. Look out for our upcoming monthly US CPG Sales Tracker for more data on the trajectory of grocery e-commerce sales in the past few months.
- E-Commerce: Over the past few weeks, we have consistently seen a consistent proportion of over 70% of consumers currently buying more online than they used to in, despite fluctuation in the proportion that are buying more overall than pre-crisis. Monthly e-commerce levels jumped by five percentage points from September to November. The e-commerce level could remain elevated, as a substantial proportion of consumers continue to avoid shopping centers/malls and shops in general. We expect total online sales to climb by around one-third in the holiday season. See our Holiday 2020: US Shopper Survey for more data on consumers’ holiday shopping expectations, and our US E-Commerce: Post-Crisis Outlook report for more e-commerce data and analysis.
Methodology
We surveyed respondents online on November 24 (460 respondents), November 17 (425 respondents), November 10 (447 respondents), November 3 (418 respondents), October 27 (419 respondents), October 20 (409 respondents), October 13 (401 respondents), October 6 (416 respondents), September 29 (412 respondents), September 22 (422 respondents), September 15 (408 respondents), September 9 (406 respondents), September 2 (402 respondents), August 26 (414 respondents), August 19 (416 respondents), August 12 (400 respondents), August 5 (449 respondents), July 29 (403 respondents), July 22 (404 respondents), July 15 (454 respondents), July 8 (410 respondents), July 1 (444 respondents), June 24 (411 respondents), June 17 (432 respondents), June 10 (423 respondents), June 3 (464 respondents), May 27 (422 respondents), May 20 (439 respondents), May 13 (431 respondents), May 6 (446 respondents), April 29 (479 respondents), April 22 (418 respondents), April 15 (410 respondents), April 8 (450 respondents), April 1 (477 respondents), March 25 (495 respondents) and March 17–18 (1,152 respondents). The most recent results have a margin of error of +/- 5%, with a 95% confidence interval. Not all charted week-over-week differences may be statistically significant.