albert Chan
We discuss select findings and compare them to those from prior weeks: September 2, August 26, August 19, August 12, August 5, July 29, July 22, July 15, July 8, July 1, June 24, June 17, June 10, June 3, May 27, May 20, May 13, May 6, April 29, April 22, April 15, April 8, April 1, March 25 and March 17–18.
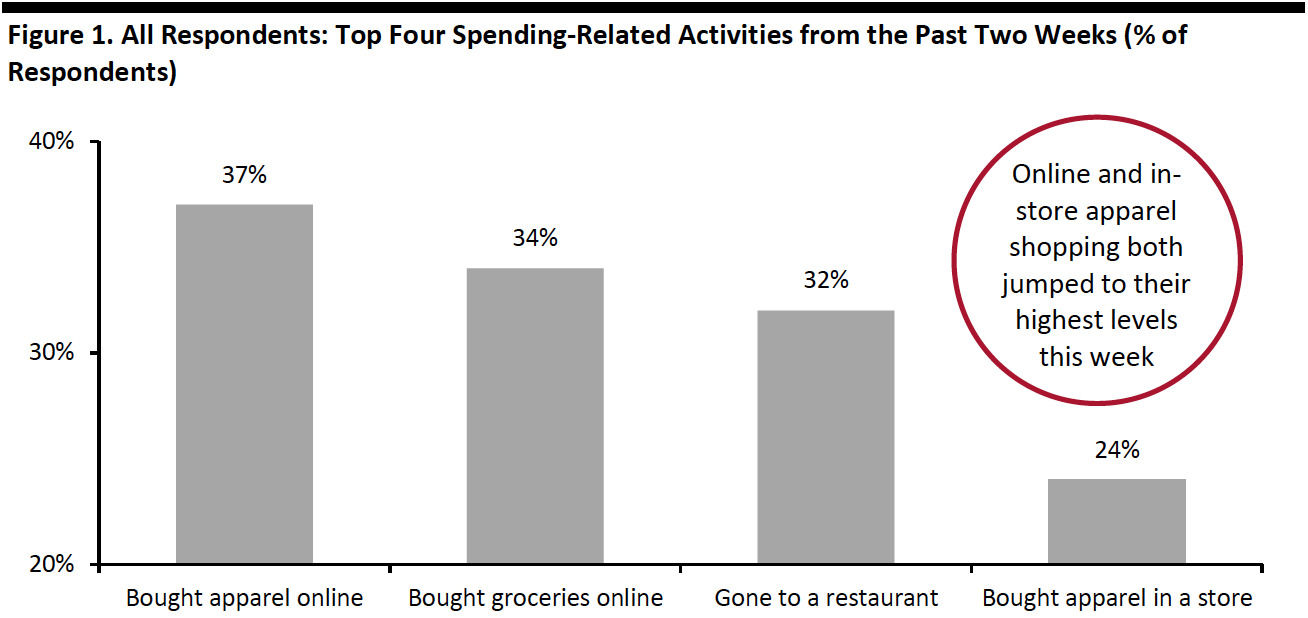
1. Online and In-Store Apparel Shopping Increase to New HighsEach week, we ask consumers what they have done in the past two weeks, with this week’s survey showing that more consumers had bought clothing or footwear, both online and in-store. Some 37% had bought apparel online, with this remaining the top spending activity this week. Some 24% had bought apparel in a store in the past two weeks; this proportion has increased by seven percentage points from what we saw three months ago. Both figures are at the highest levels we have seen since we started asking this question.
Online grocery shopping bounced back after tapering off last week. The proportion of respondents that bought groceries online jumped by five percentage points to around one-third. Its ranking also improved to the second-most-popular spending activity from third last week. This is aligned with the results from a separate question in our survey, on how consumers’ online shopping habits have been impacted by Covid-19, which recorded a week-over-week increase in the proportion of respondents buying more food online than before the crisis.
- See our full report for complete results on consumers’ activities in the past two weeks and their expected activities for the next two weeks.
 Base: US Internet users aged 18+
Source: Coresight Research[/caption] 2. Discretionary Purchases Pick Up
This week, the proportion of respondents that are currently buying more across any category jumped by 10 percentage points to a level we saw two weeks ago, driven by more purchases in essentials, including household products and personal care. The proportion of respondents that are currently buying less also increased slightly this week to 54%.
Painting a similar picture to the data shown above, the proportions of consumers that are buying more in the apparel, beauty, home and electronics categories than pre-crisis all rose slightly this week. The largest increase, of around five percentage points, was in beauty.
The proportions that are purchasing less in most of those categories than pre-crisis remained roughly stable week over week. As a result, the ratios of the proportions of respondents buying less to the proportions buying more in all four categories declined, with the ratios for apparel and home both sliding to a new low this week. The ratio for apparel went down to 2.1, from 2.7 last week and 3.2 two weeks before. The ratio for home stood at 1.3, compared to 1.9 last week.
[caption id="attachment_116195" align="aligncenter" width="700"]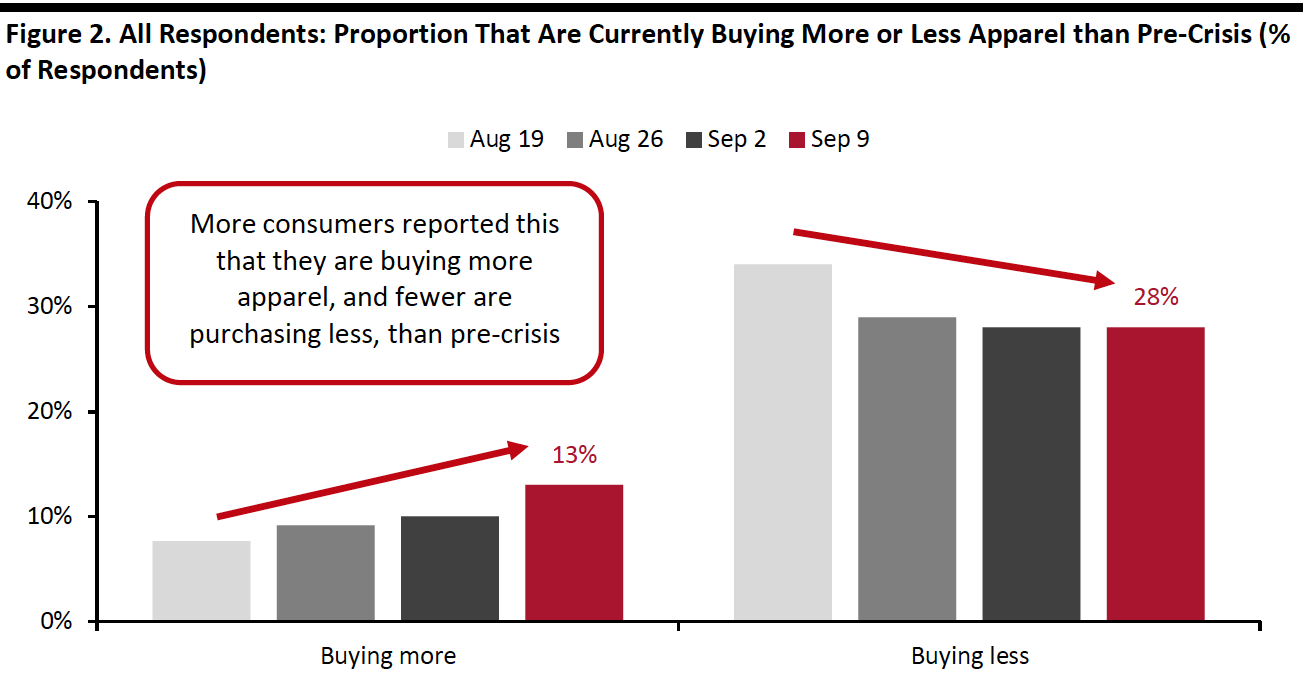 *Buying more of certain categories and buying less of certain categories were not mutually exclusive options; respondents could answer yes to both
Base: US Internet users aged 18+
Source: Coresight Research[/caption] 3. Avoidance of Shopping Centers/Malls Continues To Decline
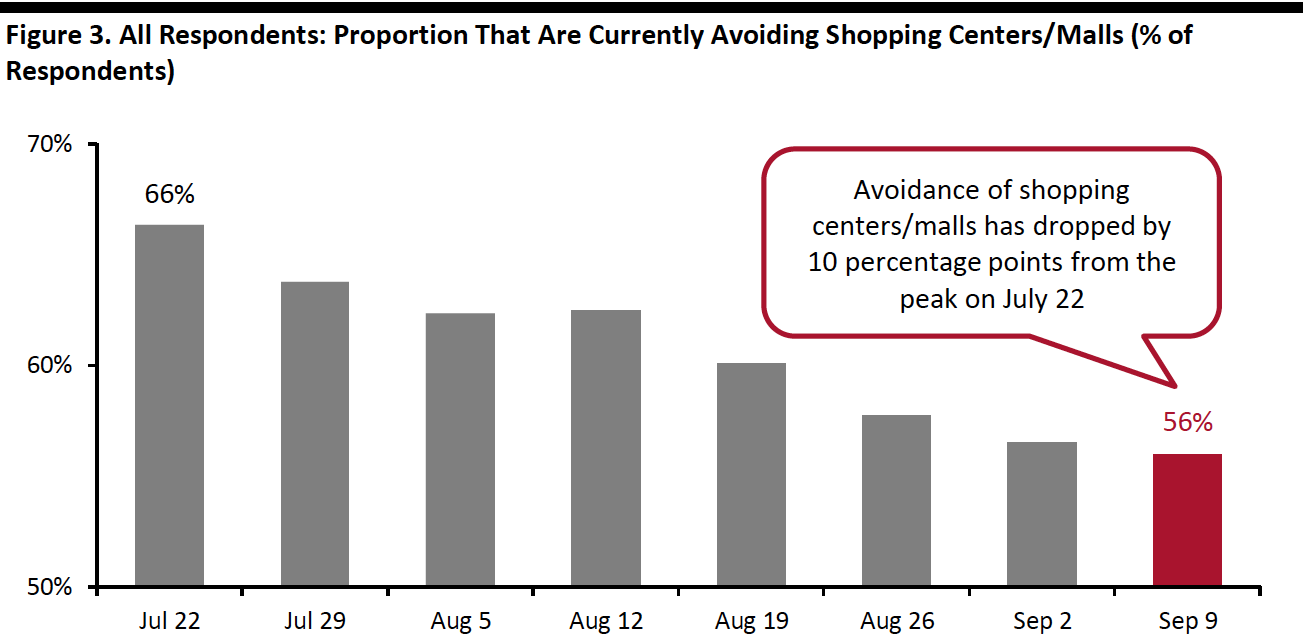
This week, the proportion of respondents saying that they are avoiding any type of public area broadly leveled off—79% are currently avoiding any public place. We saw avoidance rates for most of the 12 options we provided remain fairly stable week over week.
- The proportion of respondents that are currently avoiding shopping centers/malls fell slightly for the fourth consecutive week to 56%—the lowest level we have seen since July. Compared to the peak of two-thirds on July 22, the avoidance rate has dropped by 10 percentage points this week.
- Avoidance of shops in general also reached the lowest level we have seen since July. Around four in 10 consumers are currently avoiding such places. The avoidance rate has fallen 13 percentage points from the highest level we saw on July 22. The gradual declines in avoidance of both shopping centers/malls and shops in general are an encouraging sign for retailers.
 Base: US Internet users aged 18+
Source: Coresight Research[/caption]