albert Chan
What’s the Story?
This report presents the results of Coresight Research’s latest weekly survey of US consumers, including on the impacts of the coronavirus outbreak, undertaken on November 3, 2020. We explore the trends we are seeing from week to week, following prior surveys on October 27, October 20, October 13, October 6, September 29, September 22, September 15, September 9, September 2, August 26, August 19, August 12, August 5, July 29, July 22, July 15, July 8, July 1, June 24, June 17, June 10, June 3, May 27, May 20, May 13, May 6, April 29, April 22, April 15, April 8, April 1, March 25 and March 17–18.
Uptick in Online Shopping for Some Discretionary Categories
This week, we saw upticks in the proportions of respondents that are currently buying more in some discretionary categories online than pre-crisis. Online purchases of beauty, electronics and home products all reached new highs this week, likely reflecting early shopping for holiday gifts.
- Beauty saw the largest week-over-week increase of five percentage points: Some 21.1% are buying more beauty online than pre-crisis, versus 15.8% last week. Compared to the beginning of May, when lockdowns began to ease in some states, the proportion buying more beauty has increased by almost nine percentage points.
- Electronics has seen a near-consistent upward trend, with one-fifth buying more in the category this week. The proportion has jumped 11 percentage points from the week of May 6.
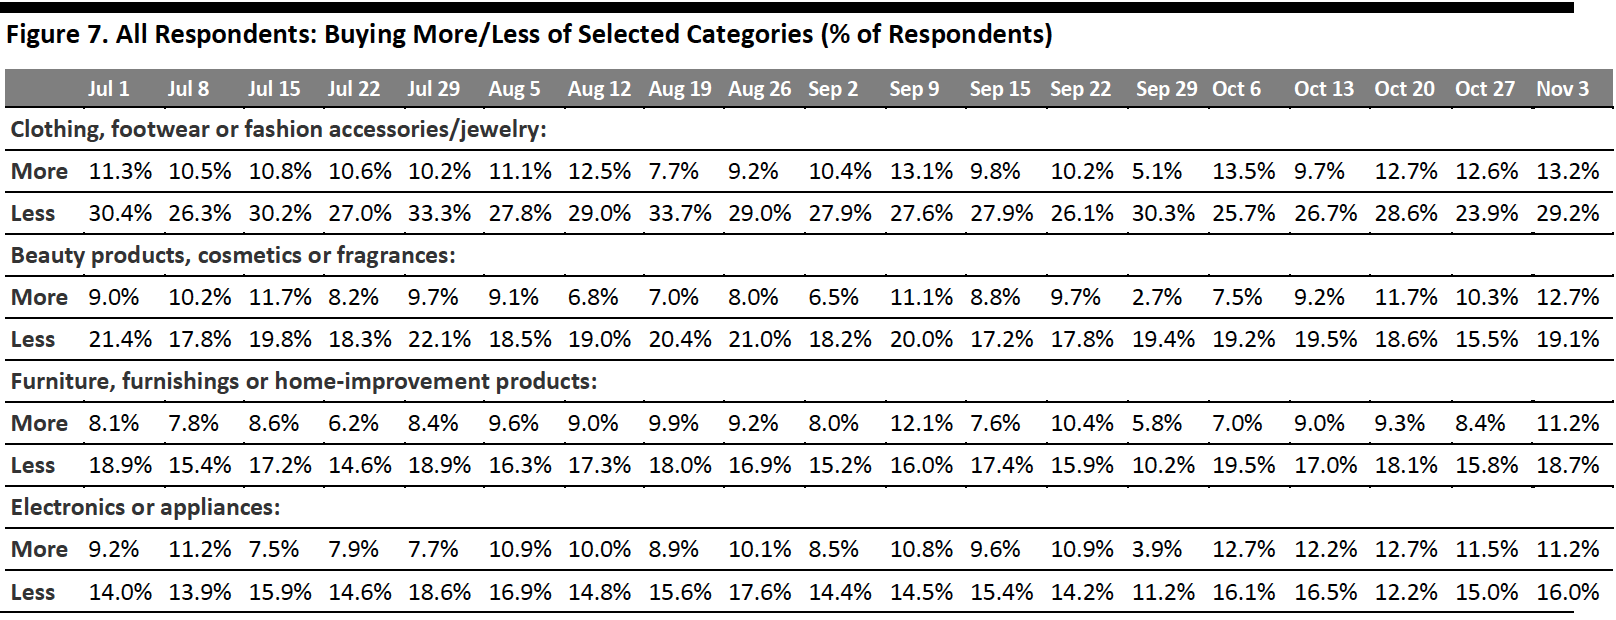
- Clothing, footwear or accessories experienced the largest growth from May to November, of 13 percentage points. Some 29.2% are buying in this category this week—the highest since August—versus 26.0% last week. However, we saw fewer consumers state that they had bought apparel online in the past two weeks, which we discuss in the next section of this report.
In our Holiday 2020: Five Predictions for US Retail report, Coresight Research expects to see an uplift in the clothing and footwear, beauty, home and some electronics and small appliances categories as popular gifts for the holiday.
[caption id="attachment_118963" align="aligncenter" width="700"]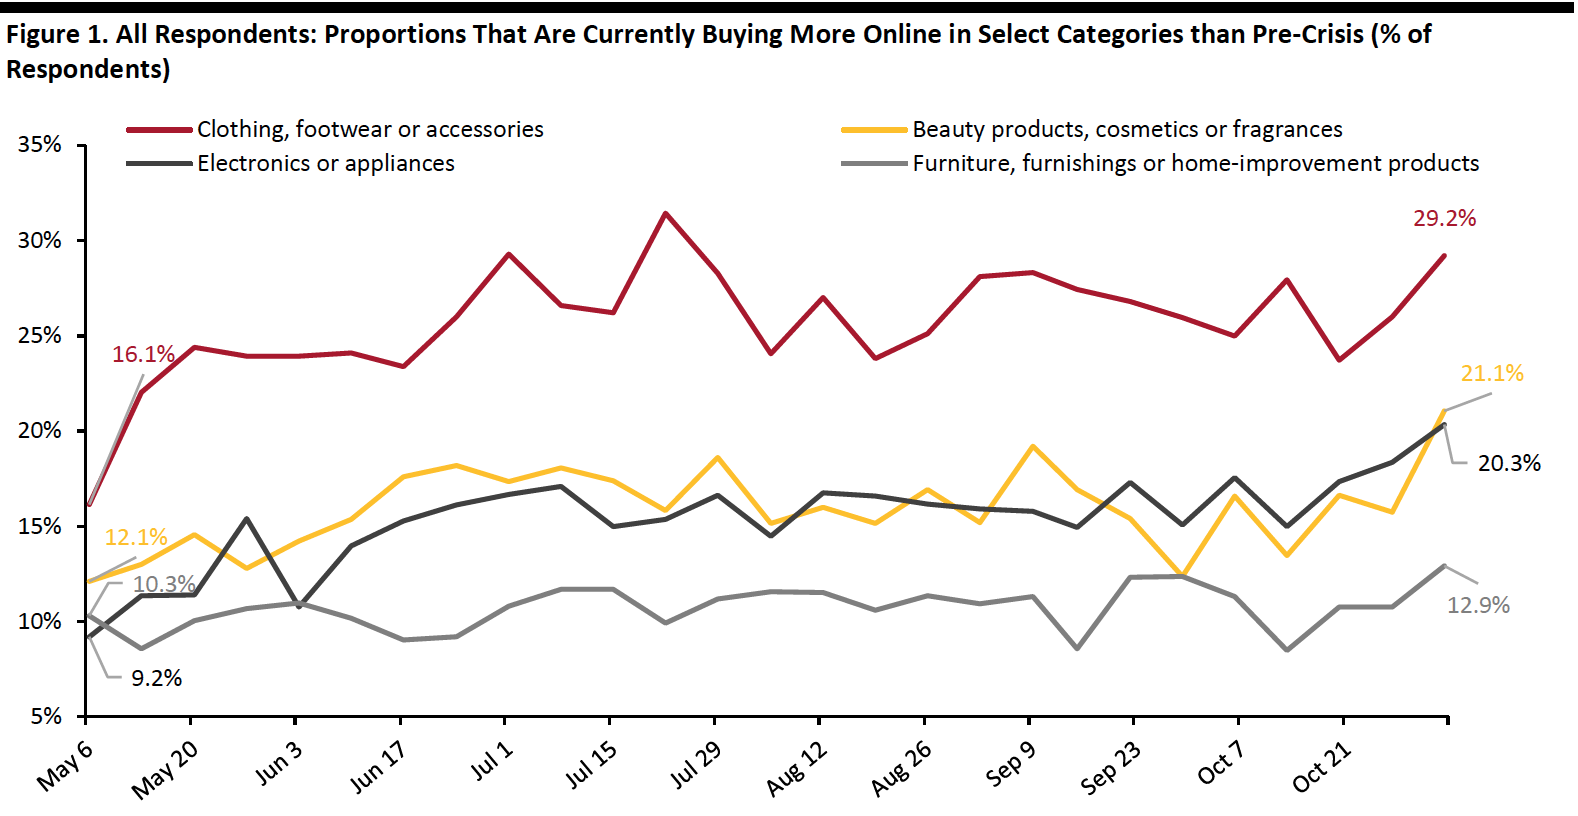 Base: US respondents aged 18+
Source: Coresight Research[/caption]
What Shoppers Are Doing and Where They Are Going
Fewer Consumers Had Visited Food-Service Locations
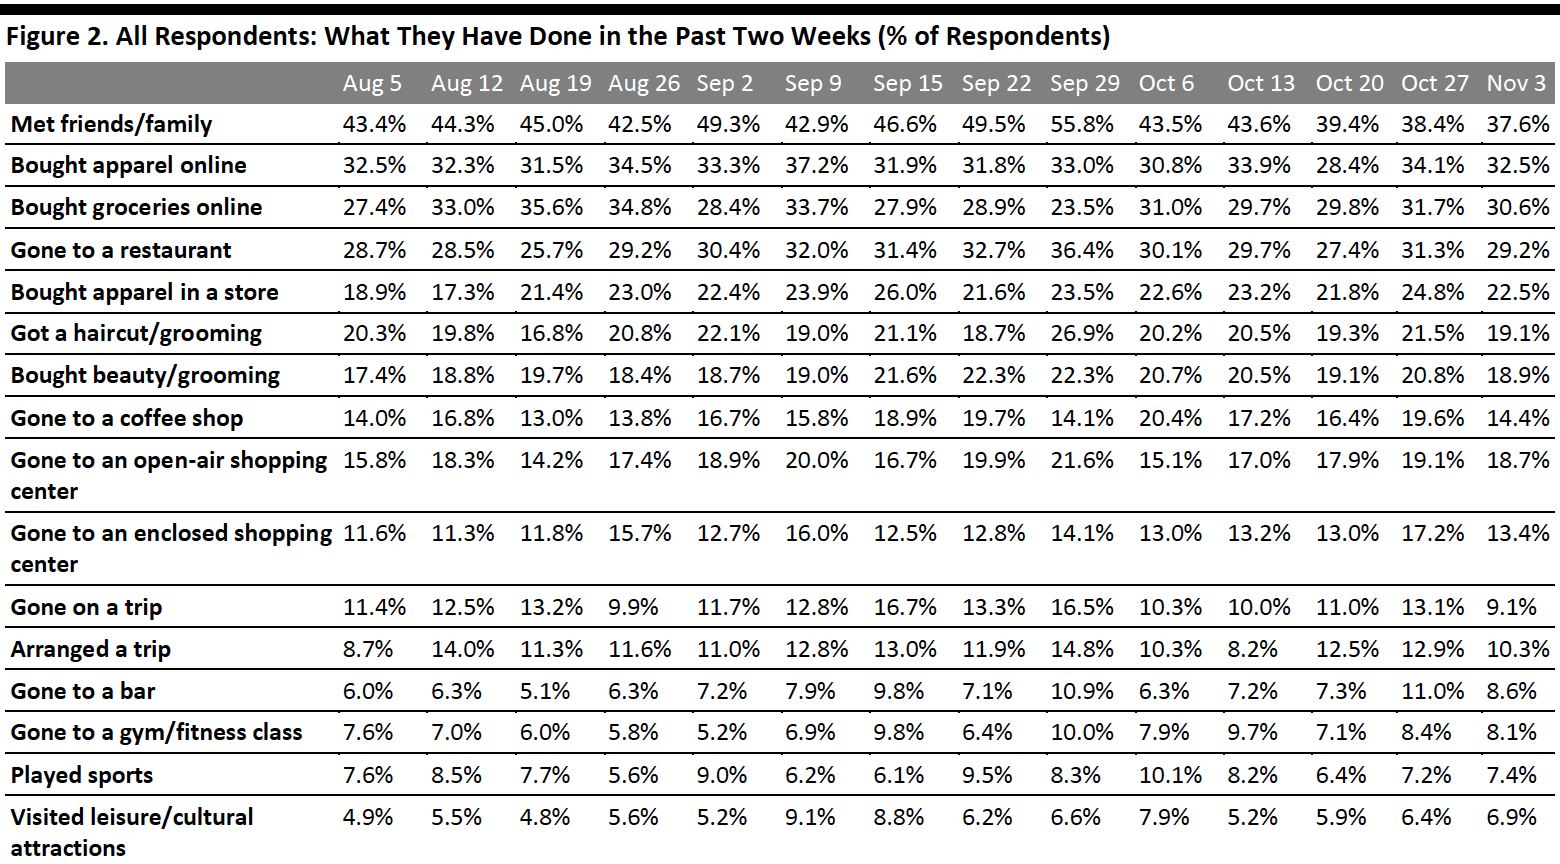
Each week, we ask consumers what they have done in the past two weeks. This week, the proportions of respondents slightly decreased for 11 of the 16 options we provided for recent activities. Most of the week-over-week changes were within the margin of error; however, the directional trends, including over a number of weeks, can prove informative.
- The proportion of respondents that had bought clothing, footwear or accessories online in the past two weeks came at 32.5%, slightly down from 34.1% last week. Discussed in the previous section, a separate survey question found that slightly more consumers are buying more apparel online than before the pandemic, week over week. In-store shopping went down slightly to 22.5%, from around one-quarter last week.
- The proportion of respondents that had visited food-service locations in the past two weeks fell after jumping last week: Some 29.2% had gone to a restaurant, and less than 10% had gone to a bar. In addition, some 14.4% had gone to a coffee shop, down five percentage points from one-fifth last week.
- Some 18.7% had gone to an open-air shopping center, consistent with the proportion last week. The proportion of consumers that had visited an enclosed center dropped to the level two weeks ago after reaching a new high last week—some 13.4% had visited such a location. These metrics remained low as the avoidance rate for shopping centers/malls remained at an elevated level, which we discuss later in this report.
 Respondents could select multiple options
Base: US respondents aged 18+
Source: Coresight Research[/caption]
More Consumers Plan To Buy Grocery Products Online in the Next Two Weeks
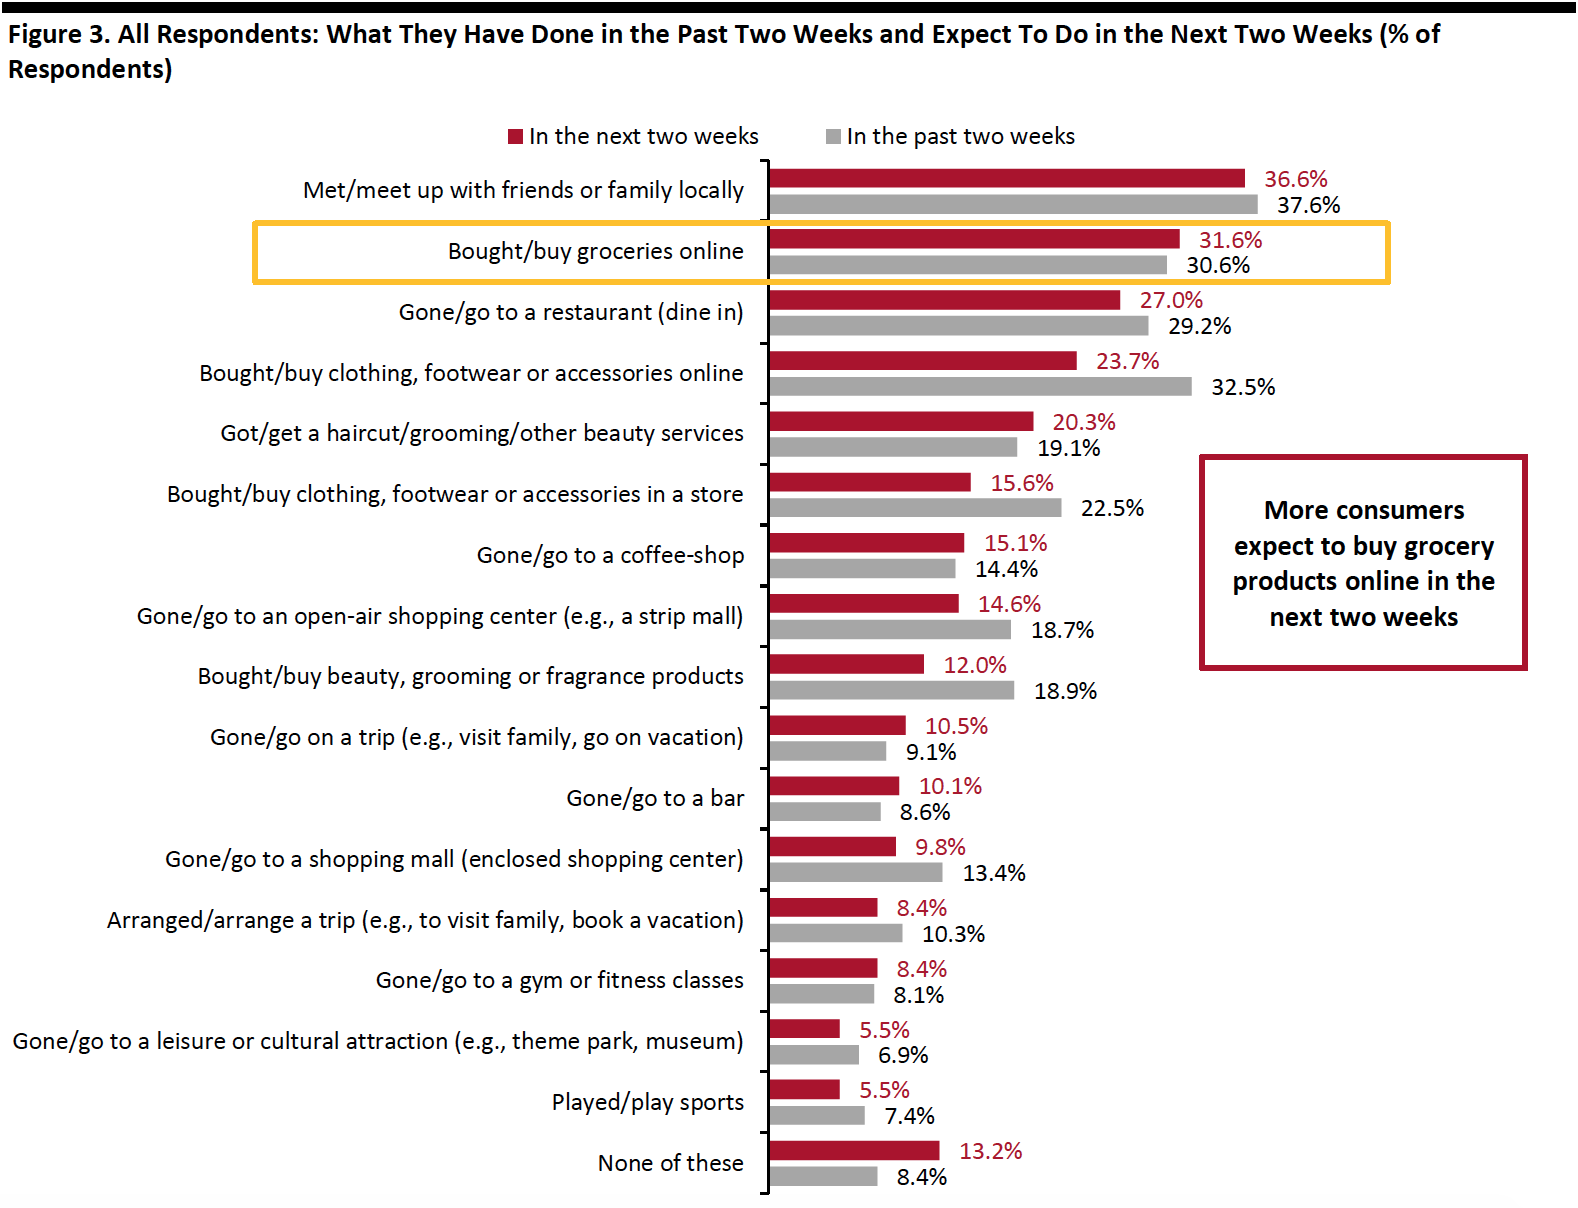
Each week, we also ask consumers what they expect to do in the next two weeks, with a set of options comparable to those for the last two weeks. In Figure 3, we compare these short-term expectations with recent actual behavior.
We saw slightly lower proportions of consumers expecting to do 10 of the 16 options we provided for activities in the next two weeks than actual behavior in the past two weeks.
- Online grocery shopping continued to be the top expected spending-related activity for consumers to do in the next two weeks, with slightly more consumers planning to do so (31.6%), compared to the 30.6% of actual behavior in the past two weeks.
- The proportion of respondents that expect to buy clothing or footwear online stood at 23.7%. Although the level is slightly lower than the expectation last week, it is still high compared to the proportions in previous months. Some 15.6% plan to buy apparel in a store. We expect to see higher proportions in actual behavior of apparel shopping, as the actual behavior of these activities has typically exceeded expected behavior in past survey results.
 Respondents could select multiple options
Base: US respondents aged 18+
Source: Coresight Research[/caption]
Over Eight in 10 Are Currently Avoiding Public Places
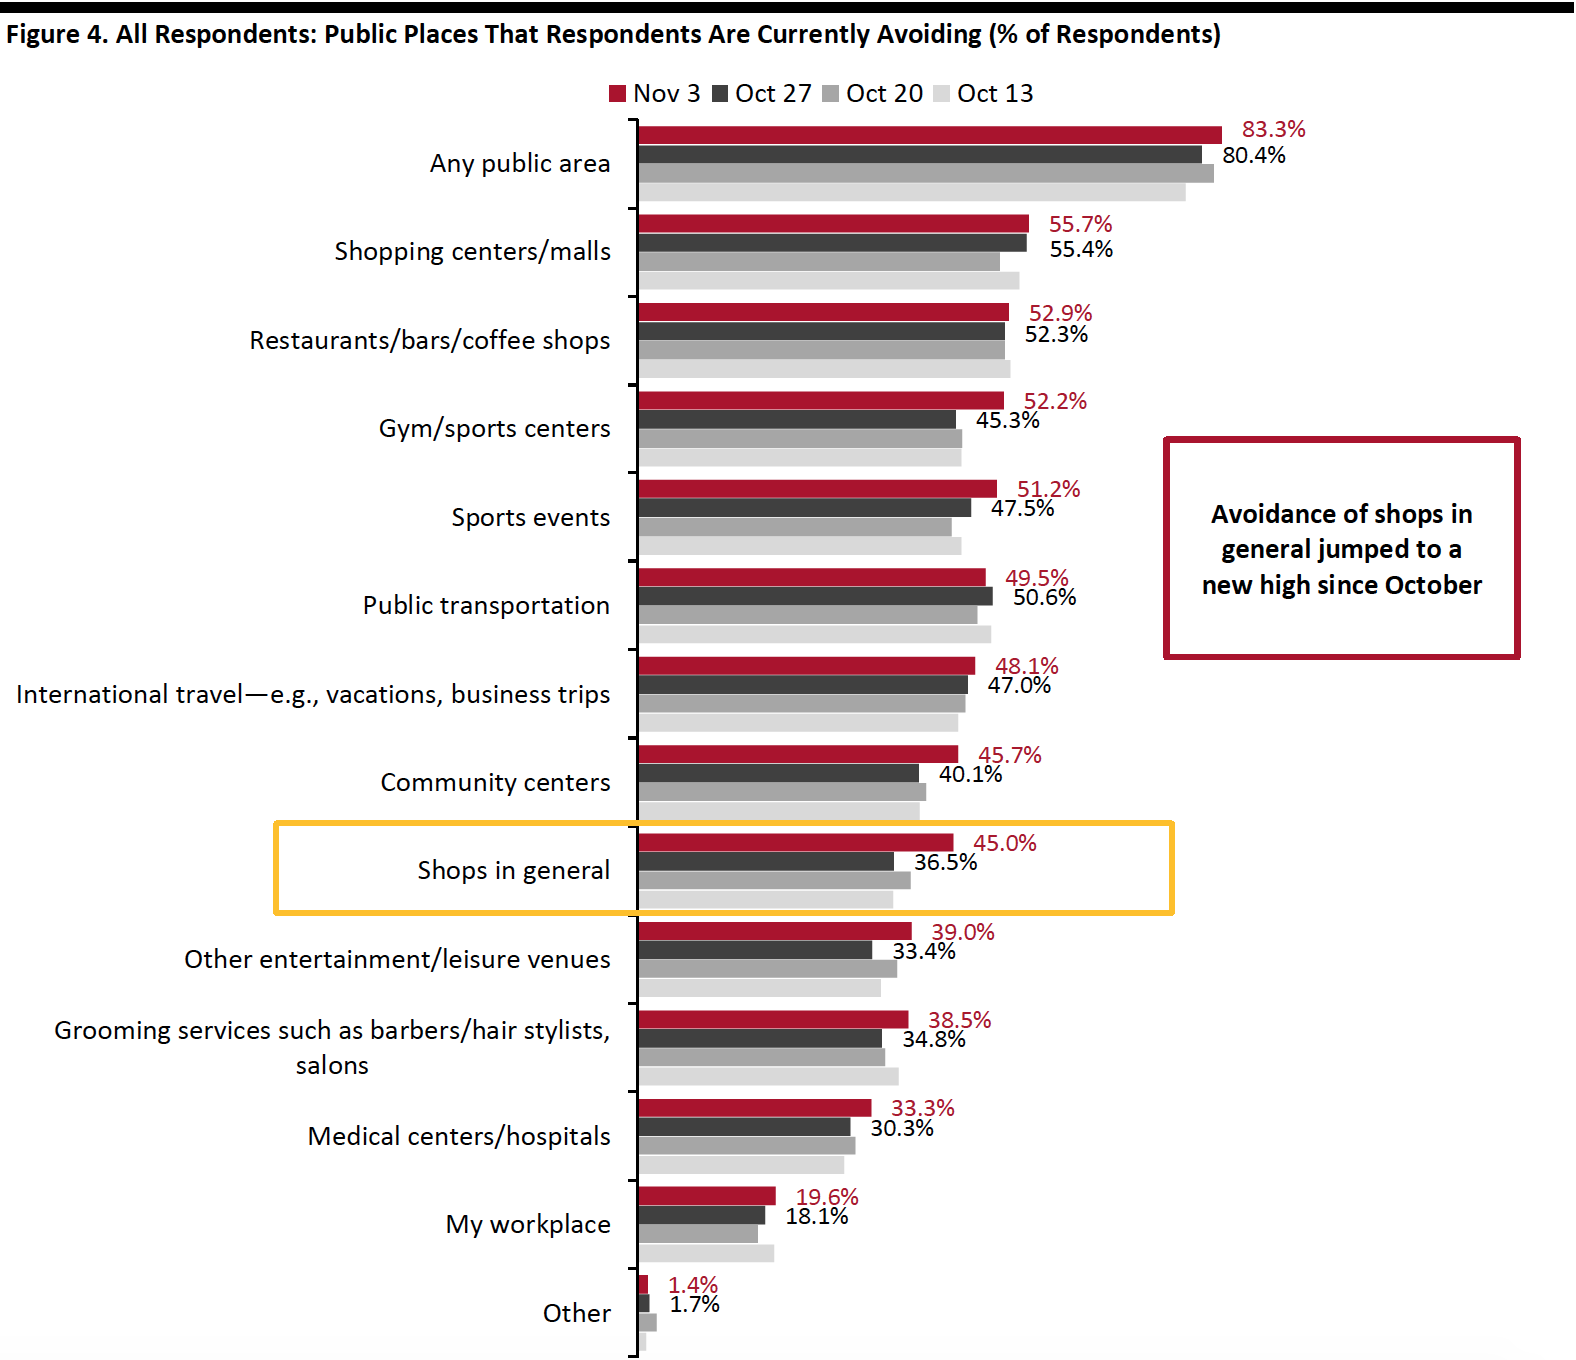
This week, the avoidance rate of any type of public area reached a new high since August 19: Some 83.3% said that they are currently avoiding any public area, versus 80.4% last week. The high avoidance rate could be a result of continued surging Covid-19 cases across the US.
We saw increases in the avoidance rate for nine of the 13 options provided, although some changes were within the margin of error.
- The proportion of respondents that are currently avoiding shopping centers/malls remained fairly stable at 55.7% this week—remaining the most-avoided public place.
- Avoidance of shops in general saw the largest spike this week: Some 45.0% are currently avoiding such places, up almost nine percentage points from 36.5% last week. This is the highest level we have seen since October.
- Gym/sport centers also saw an increase of almost seven percentage points to 52.2%, from 45.3% last week.
 Respondents could select multiple options
Base: US respondents aged 18+
Source: Coresight Research[/caption]
Reviewing Trend Data in Current Purchasing Behavior
What Consumers Are Currently Buying More Of and Less Of
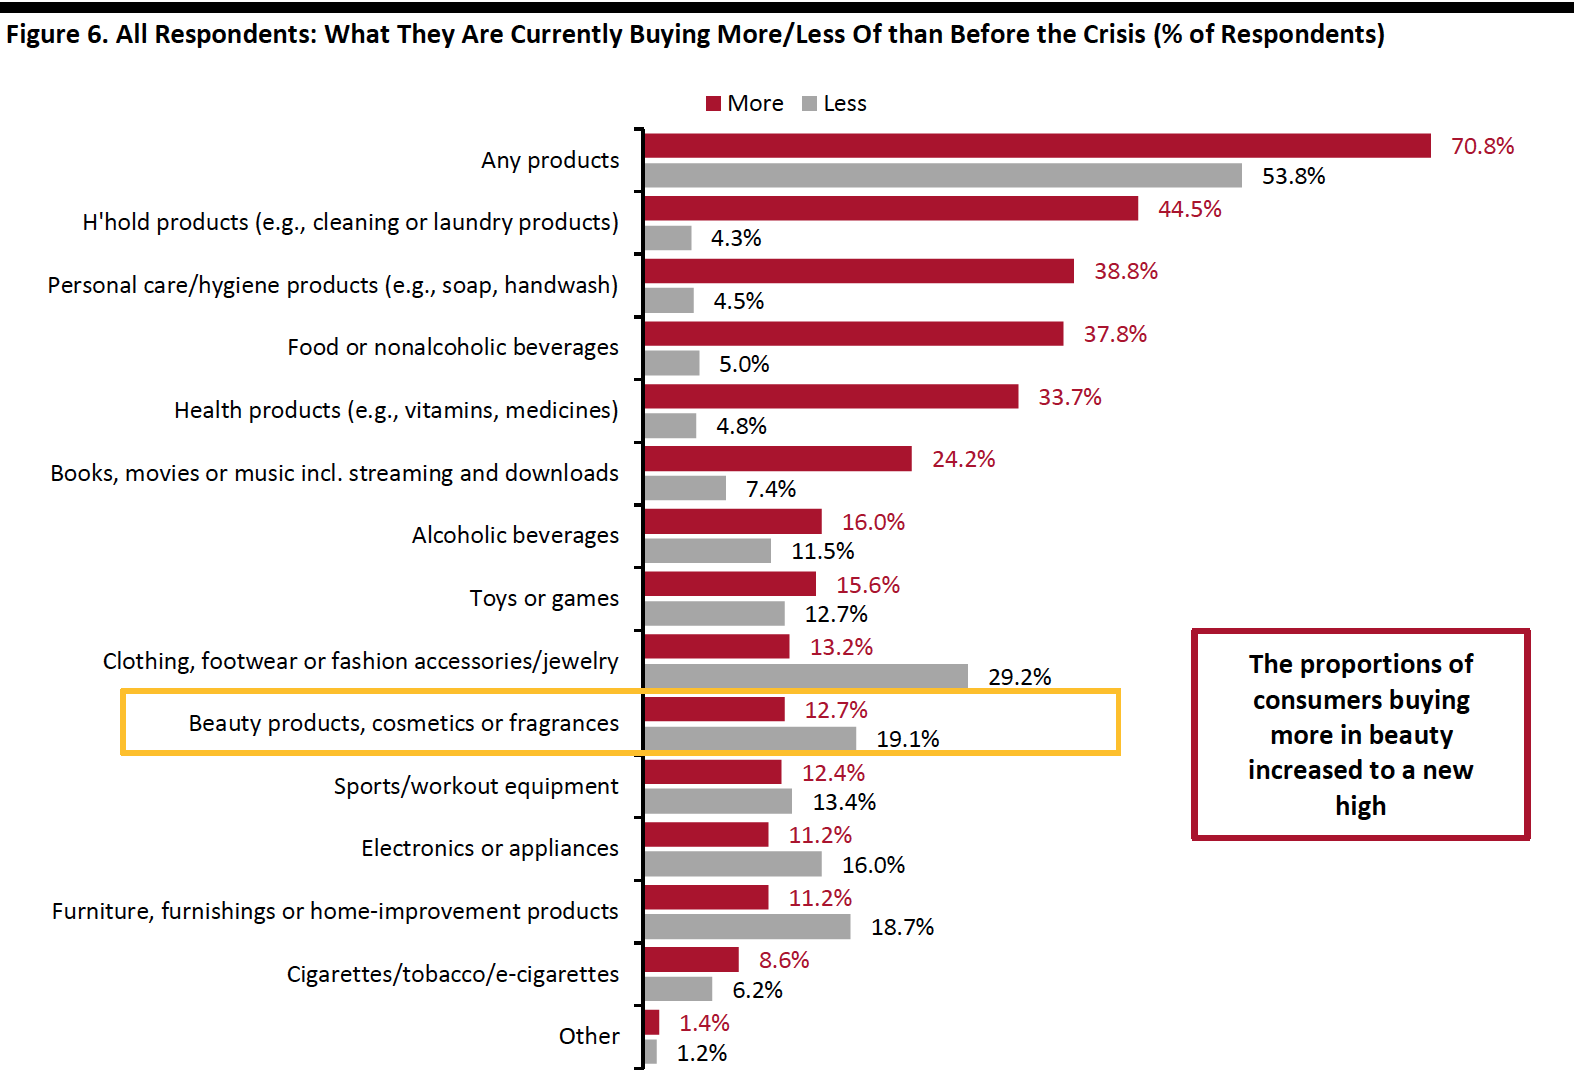
We have seen fluctuation in the proportion of respondents that are currently buying more of any products than before the crisis in recent weeks. This week, some 70.8% are currently buying more, up 10 percentage points from 60.1% last week and roughly the same level as two weeks ago. The proportion of respondents that are currently buying less than pre-crisis also returned to the level from two weeks ago, at 53.8%.
- Buying more of certain categories and buying less of certain categories were not mutually exclusive options, so respondents could answer yes to both.
Buying more: Essentials—including household products, personal care and food—saw the largest upswings week over week and remained the most-purchased categories. The proportions of consumers buying more in household and health products both rebounded to the levels we saw two weeks ago. The proportion of consumers that are buying more beauty products also rose to a new high of 12.7% this week.
Buying less: Discretionary categories—including clothing and footwear, beauty and home—remained the hardest-hit categories, with the highest proportions of consumers currently buying less of such products. All categories tracked in Figure 6 saw week-over-week increases, with some 29.2% currently buying less apparel, up five percentage points from last week.
By age group, we found the highest proportions of those buying more apparel and beauty being young consumers, while this demographic also saw the lowest proportions buying less in both categories. This seems encouraging for apparel and beauty retailers, as young consumers drive a large portion of fashion and beauty spending.
[caption id="attachment_118970" align="aligncenter" width="700"]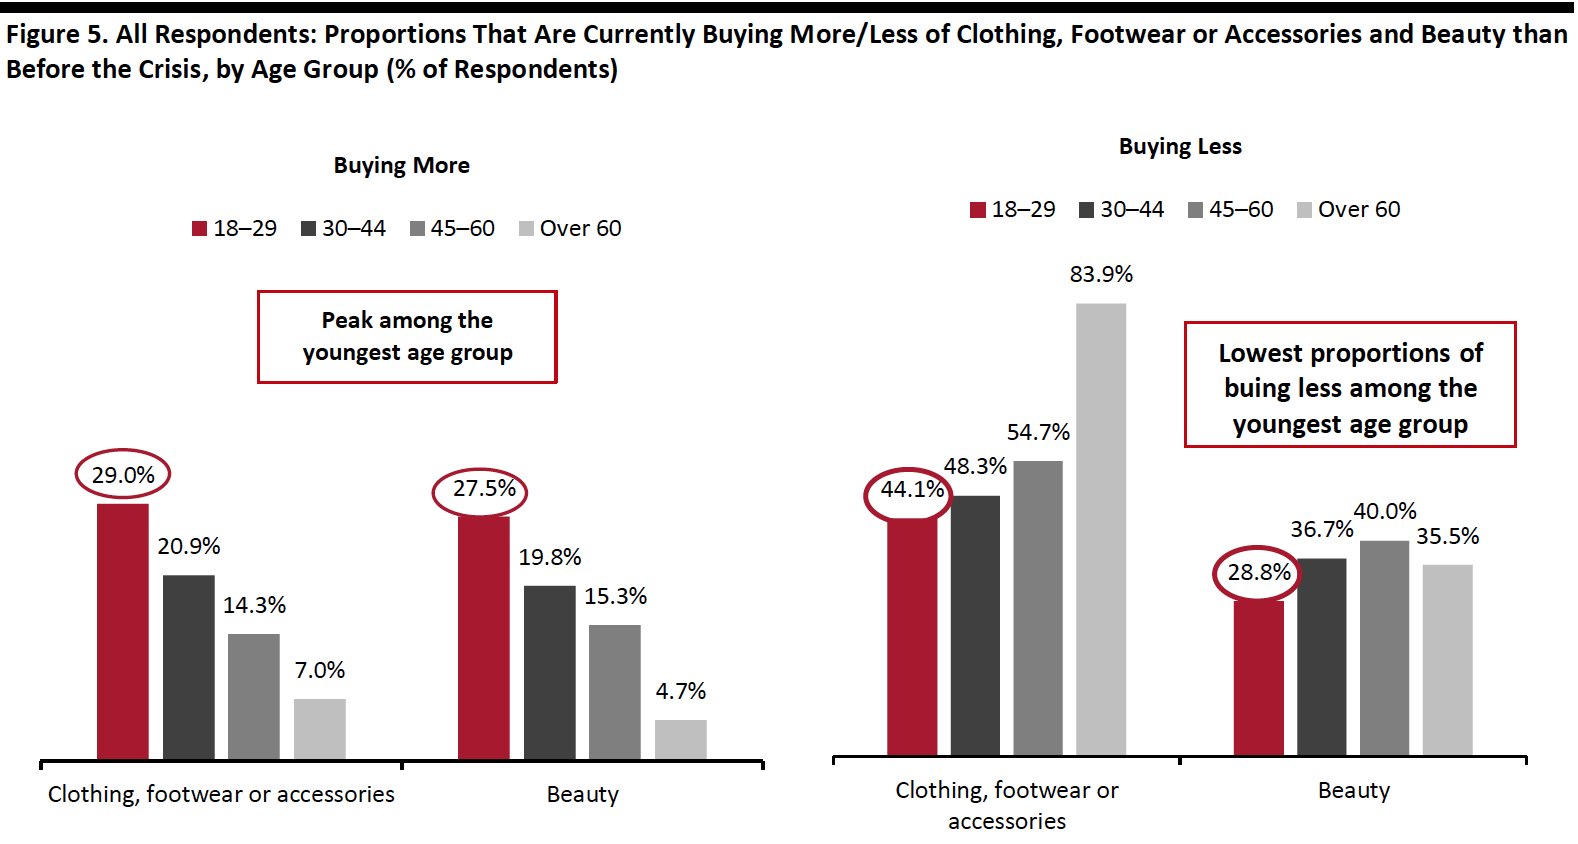 Base: US respondents aged 18+
Source: Coresight Research[/caption]
Ratio of less to more: The ratios of the proportions of respondents buying less to the proportions buying more in apparel and electronics both went up, while home slid.
- The ratio for clothing and footwear jumped to 2.2, from 1.9 last week.
- The ratio for beauty stayed consistent from last week at its lowest level of 1.5, versus 1.6 two weeks before.
- The ratio for electronics stood at 1.4, compared to 1.3 last week.
- The ratio for home fell to 1.7, having been 1.9 in the past three weeks.
 Respondents could select multiple options
Base: US respondents aged 18+
Source: Coresight Research[/caption] [caption id="attachment_118973" align="aligncenter" width="700"]
 Base: US respondents aged 18+
Source: Coresight Research[/caption]
Three-Quarters Are Switching Spending Online
The proportion of consumers buying more online than they used to surged to a new high this week: Some 74.9% are currently doing so, up seven percentage points from 67.5% last week. This level is also higher than the October average of seven in 10. The spike could be due in part to more consumers buying more of any category overall than before the crisis, discussed previously.
[caption id="attachment_118975" align="aligncenter" width="700"]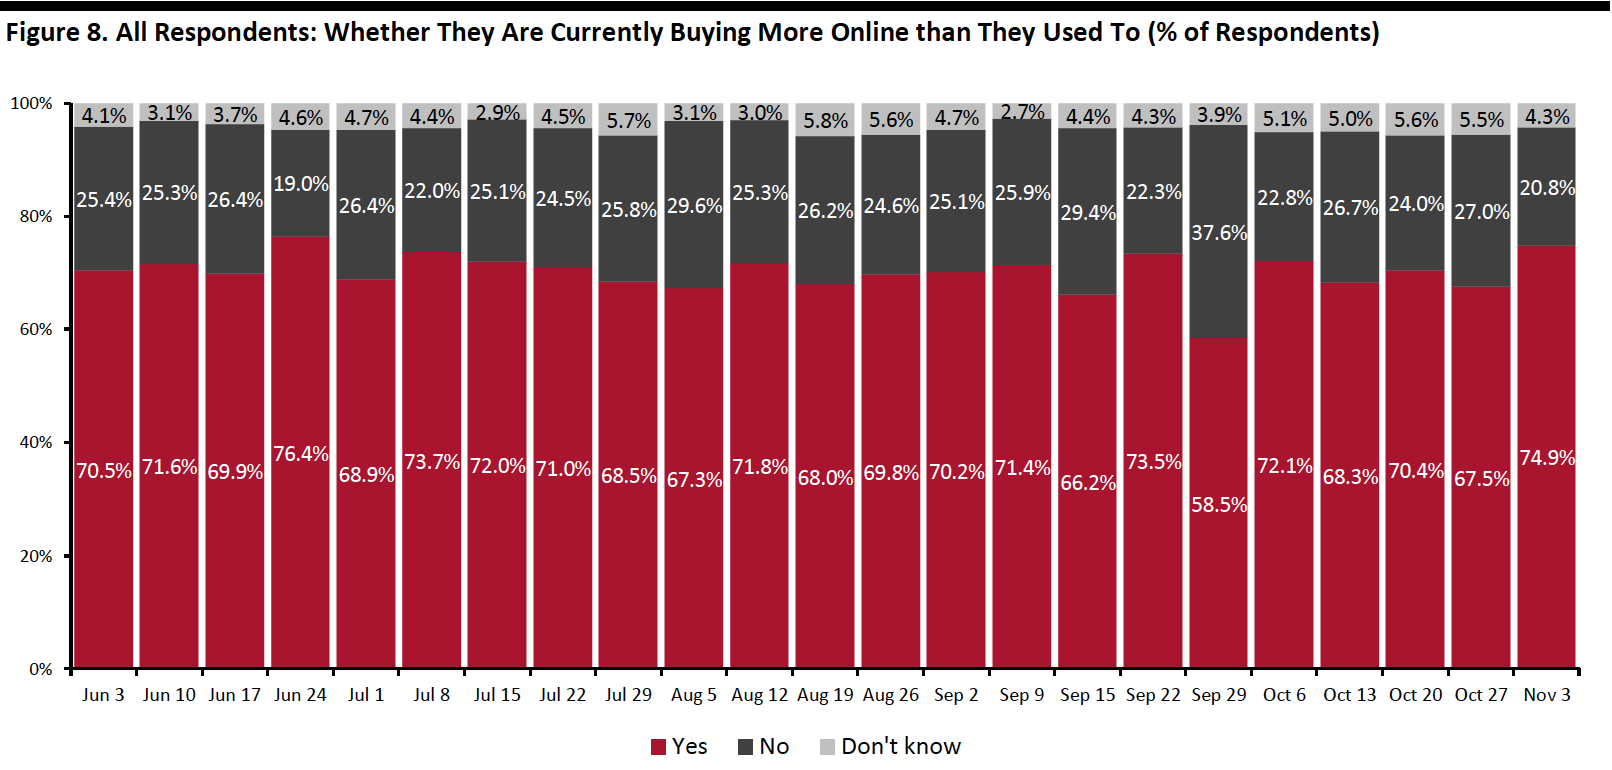 Base: US respondents aged 18+
Source: Coresight Research[/caption]
What Consumers Are Currently Buying More Of Online
Looking at specific categories, almost all of the 13 options we provided saw week-over-week increases in consumers buying more online than pre-crisis, although most of the changes were within the margin of error.
Household products and personal care remained the most-purchased categories online, with over three in 10 buying more of both online than pre-crisis. Food is the only category that saw a slight week-over-week decline, with 22.2% currently buying more food than before the pandemic.
As we discussed upfront, online purchases of beauty, electronics and home all reached new highs since we started asking this question, possibly driven by some holiday purchases.
- The proportion that are currently buying more beauty online jumped by five percentage points, to 21.1% from 15.8% last week.
- One-fifth are buying more electronics online.
- Some 12.9% are buying more home products online than pre-crisis.
The proportion that are buying more apparel online also increased for the second consecutive week, to 29.2%—the highest level we have seen since August.
[caption id="attachment_118977" align="aligncenter" width="700"]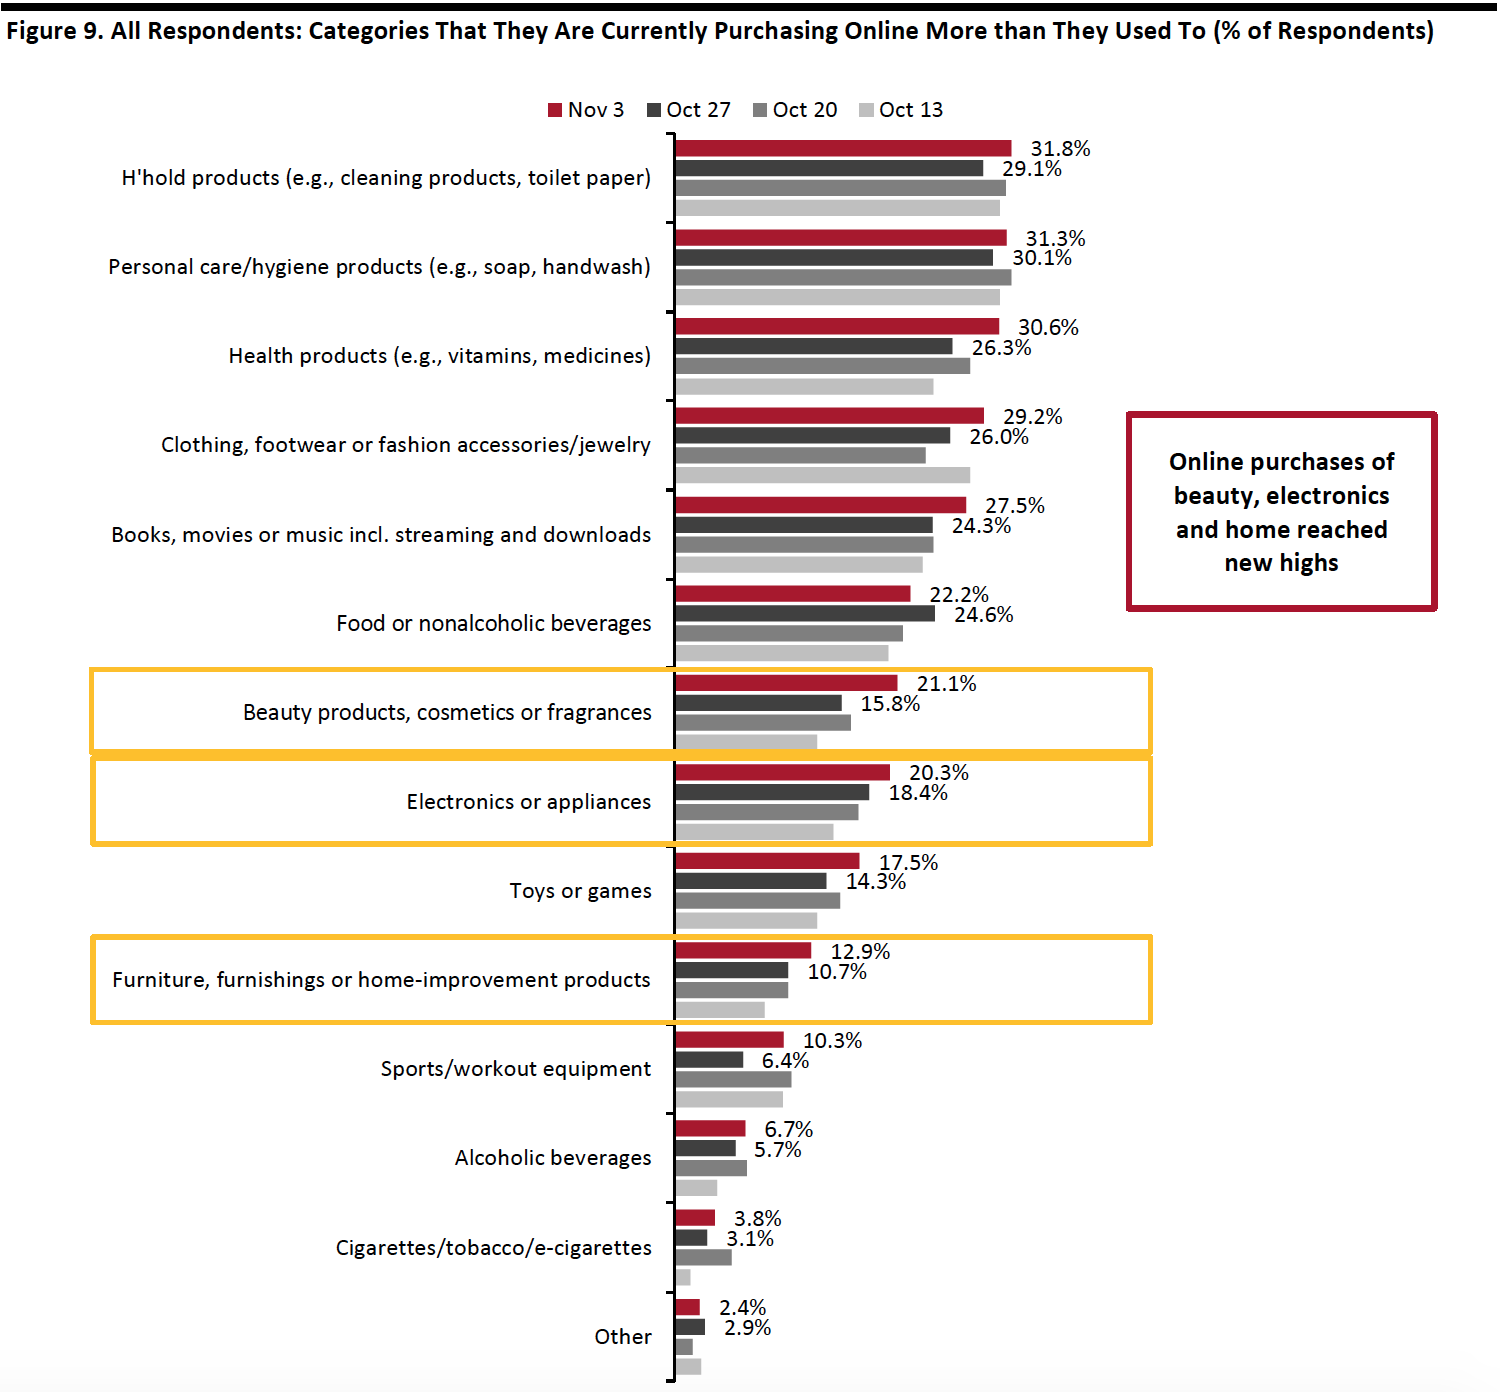 Respondents could select multiple options
Base: US respondents aged 18+
Source: Coresight Research[/caption]
What We Think
This week, we saw the following from our recurring weekly questions:
- Apparel: Although clothing, footwear or accessories remained the most-cut category, the ratio of those buying less to those buying more was low this week, at 2.2. The proportions of consumers that had bought apparel online and in-store have been fluctuating in the past couple of weeks. This week, some 32.5% had bought apparel online in the past two weeks and 22.5% had done so in a store—both slightly lower than last week’s findings (but within the margin of error). However, in a separate survey question, the proportion of respondents that are currently buying more apparel online than pre-crisis jumped to a new high since August, at 29.2%. As we are in the holiday season now, we expect purchases in apparel and some other discretionary categories, such as electronics and beauty, to increase in the upcoming weeks.
- Online Grocery: Compared to last week, slightly fewer consumers had bought groceries online in the past two weeks: Some 30.6% said they had done so. In addition, food is the only category that saw a decline in the proportion of consumers currently buying more online than pre-crisis, from 24.6% last week to 22.2% this week. Our monthly US CPG Sales Tracker has recorded a sequential slowing in year-over-year growth rates for online food sales. Nevertheless, we expect online food sales to increase by 60+%, year over year, during the holiday period.
- E-Commerce: The proportion of consumers that are currently buying more online than they used surged by seven percentage points to three-quarters from 67.5% last week, which could be driven by a higher proportion of consumers that are buying more of any products. We saw week-over-week increases in almost all categories—especially discretionary categories such as beauty, home and electronics, which all reached new highs this week. We expect the level of shopping online to remain elevated as we move further into the holiday season, and we expect holiday-quarter online sales to rise by around one-third year over year. See our Holiday 2020: US Shopper Survey for more data on consumers’ holiday shopping expectations, and the US E-Commerce: Post-Crisis Outlook report for more e-commerce data and analysis.
Methodology
We surveyed respondents online on November 3 (418 respondents), October 27 (419 respondents), October 20 (409 respondents), October 13 (401 respondents), October 6 (416 respondents), September 29 (412 respondents), September 22 (422 respondents), September 15 (408 respondents), September 9 (406 respondents), September 2 (402 respondents), August 26 (414 respondents), August 19 (416 respondents), August 12 (400 respondents), August 5 (449 respondents), July 29 (403 respondents), July 22 (404 respondents), July 15 (454 respondents), July 8 (410 respondents), July 1 (444 respondents), June 24 (411 respondents), June 17 (432 respondents), June 10 (423 respondents), June 3 (464 respondents), May 27 (422 respondents), May 20 (439 respondents), May 13 (431 respondents), May 6 (446 respondents), April 29 (479 respondents), April 22 (418 respondents), April 15 (410 respondents), April 8 (450 respondents), April 1 (477 respondents), March 25 (495 respondents) and March 17–18 (1,152 respondents). The most recent results have a margin of error of +/- 5%, with a 95% confidence interval. Not all charted week-over-week differences may be statistically significant.