albert Chan
What’s the Story?
This report presents the results of Coresight Research’s latest weekly survey of US consumers, including on the impacts of the coronavirus outbreak, undertaken on October 27, 2020. We explore the trends we are seeing from week to week, following prior surveys on October 20, October 13, October 6, September 29, September 22, September 15, September 9, September 2, August 26, August 19, August 12, August 5, July 29, July 22, July 15, July 8, July 1, June 24, June 17, June 10, June 3, May 27, May 20, May 13, May 6, April 29, April 22, April 15, April 8, April 1, March 25 and March 17–18.
Shoppers’ Plans for Thanksgiving and Black Friday
This week, we asked consumers about their shopping plans for Thanksgiving and Black Friday in the wake of coronavirus pandemic. We asked:
- Whether they expect to do any shopping activities, including browsing or buying on Thanksgiving or Black Friday.
- For those who said they would shop (in-store or online) on either or both of Thanksgiving and Black Friday, whether they expect to use any online order pickup services.
- For those who said they would shop in-store, what product categories they expect to browse or purchase.
- For those who said they would shop online on either or both Thanksgiving and Black Friday, what product categories they expect to browse or purchase.
Consumers Prefer To Shop Online for Thanksgiving and Black Friday
With a recent resurgence of coronavirus cases and the implementation of social-distancing measures in stores, high proportions of consumers expect to turn to e-commerce for Thanksgiving and Black Friday shopping: Some 43.7% said they expect to shop online on Thanksgiving, and 55.9% plan to do so on Black Friday. Coresight Research expects total online retail sales during the holiday period to rise by one-third year over year.
The popularity of Thanksgiving and Black Friday shopping is fading. Some 24.3% indicated that they would not shop at all on Black Friday, and that proportion is even higher (31.0%) for Thanksgiving Day. One reason for this could be the pull-forward of holiday shopping this year: Promotional events such as the new 10.10 Shopping Festival, Amazon’s Prime Day and Walmart’s “The Big Save” we held in early October.
By age, our survey found that consumers that said they would not shop at all on Thanksgiving or Black Friday both peaked among those aged over 60.
[caption id="attachment_118553" align="aligncenter" width="700"]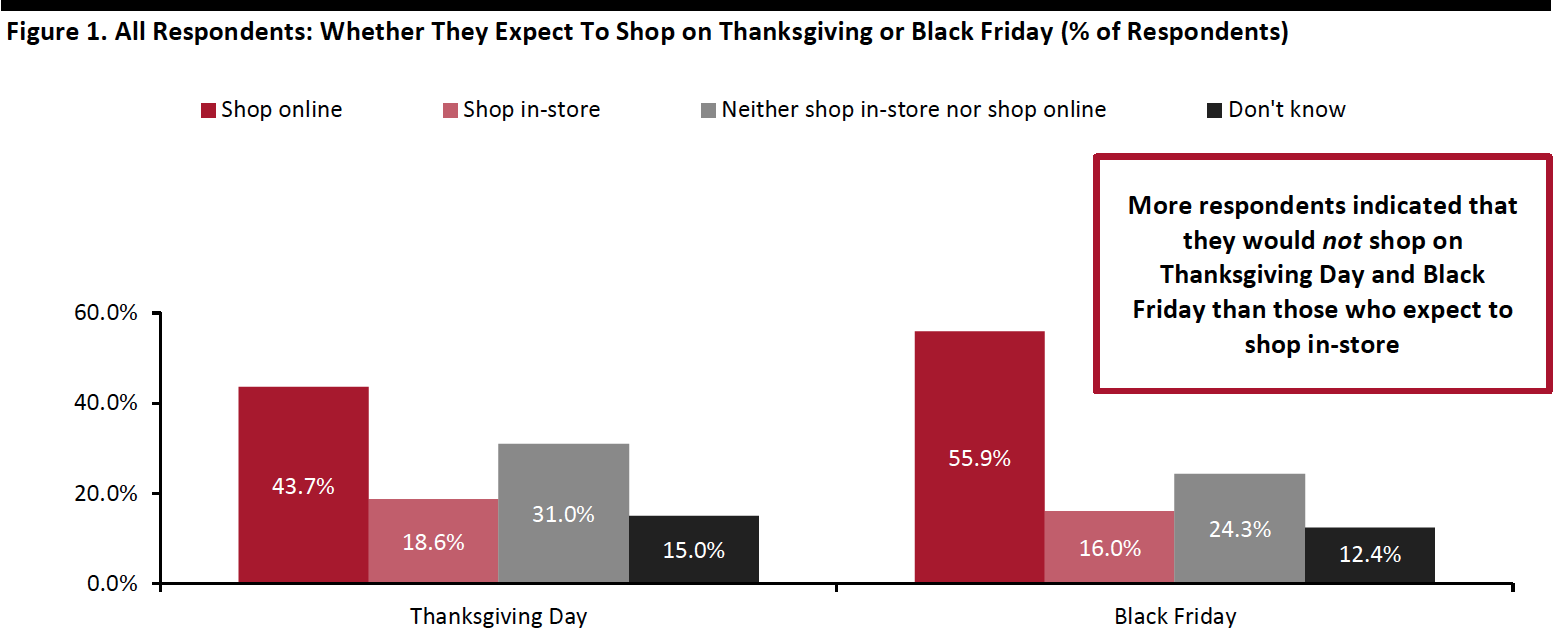 Base: 419 US respondents aged 18+
“Shopping” is defined as browsing or buying. Respondents could select both shop online and shop in-store.
Source: Coresight Research[/caption]
What Pickup Services Shoppers Expect To Use
Curbside pickup is expected to be the most-used collection service. For those who said they would shop on either or both Thanksgiving and Black Friday, three in 10 plan to use curbside pickup, although 26.5% do not expect to use any pickup services.
Locker pickup remains a niche service, despite increased adoption by retailers: Only 9.2% said they would use the service for Thanksgiving or Black Friday purchases.
[caption id="attachment_118554" align="aligncenter" width="550"]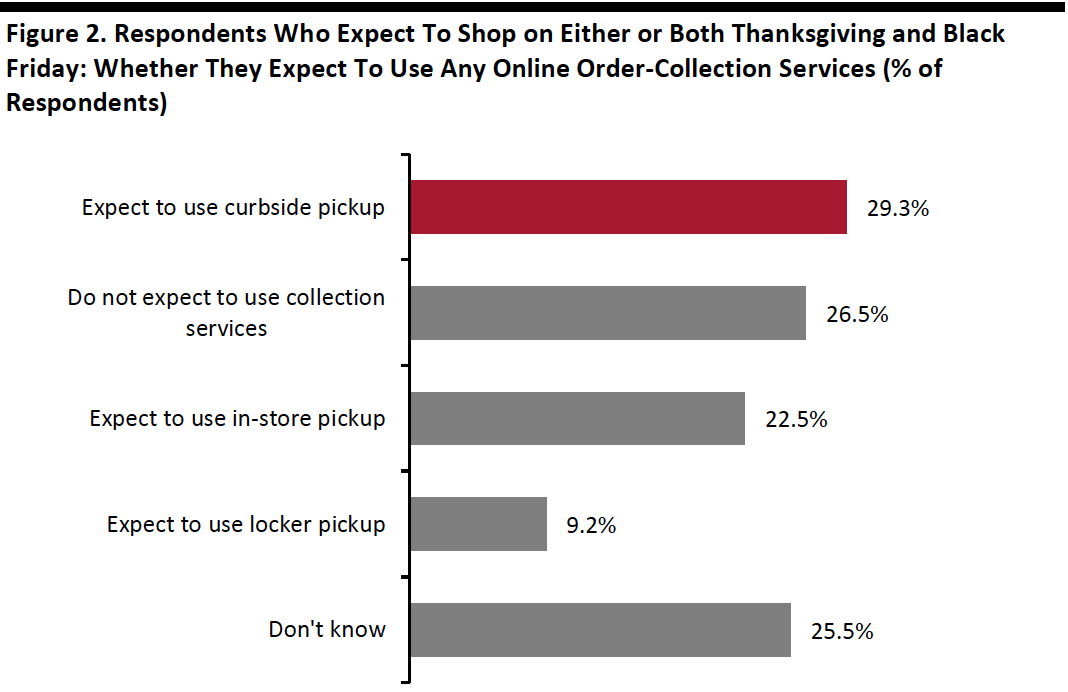 Base: 294 US respondents aged 18+ who expect to shop on either or both Thanksgiving and Black Friday
Source: Coresight Research[/caption]
What Product Categories Shoppers Expect To Buy
Clothing, footwear or accessories and electronics are two of the most popular products to shop, whether in-store or online, on either or both Thanksgiving and Black Friday: Clothing takes the top spot for in-store shopping, and electronics is the most popular category for online shopping. This is also consistent with a separate finding in our Holiday 2020: US Shopper Survey, in which we saw electronics and apparel remain the top gifting categories for the holidays this year.
Grocery ranks the third-most-expected products to purchase in-store for either or both Thanksgiving and Black Friday, but this category ranks lower for online shopping.
[caption id="attachment_118555" align="aligncenter" width="700"]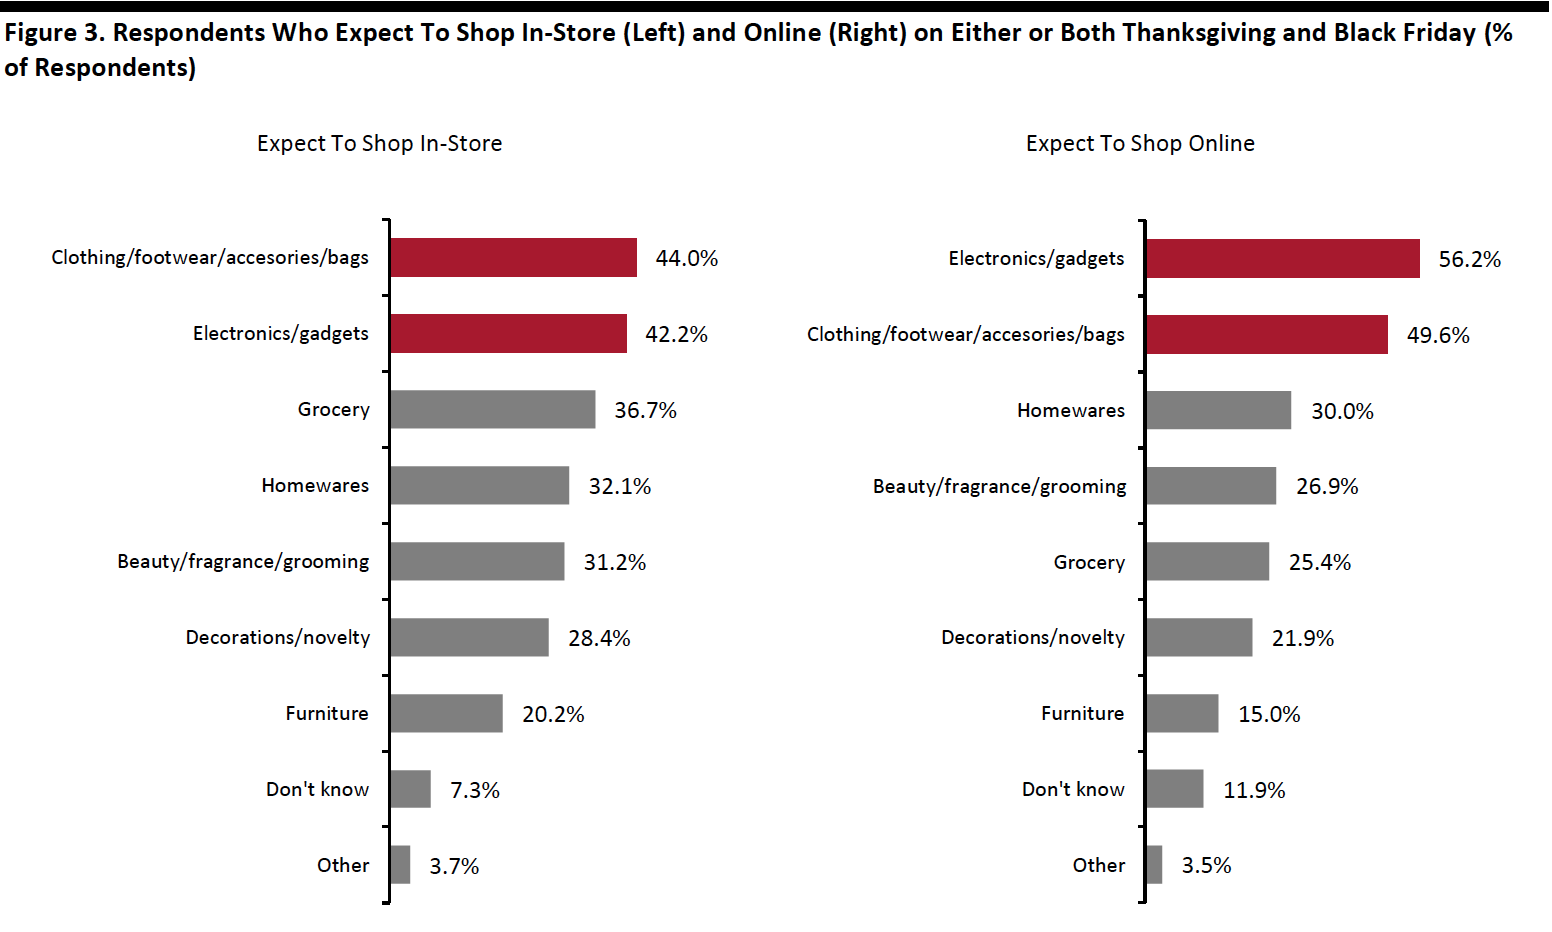 Base: 109 US respondents aged 18+ who expect to shop in-store on either or both Thanksgiving and Black Friday (left); and 260 US respondents aged 18+ who expect to shop online on either or both Thanksgiving and Black Friday (right)
Source: Coresight Research[/caption]
What Shoppers Are Doing and Where They Are Going
Online Apparel Shopping Bounces Back
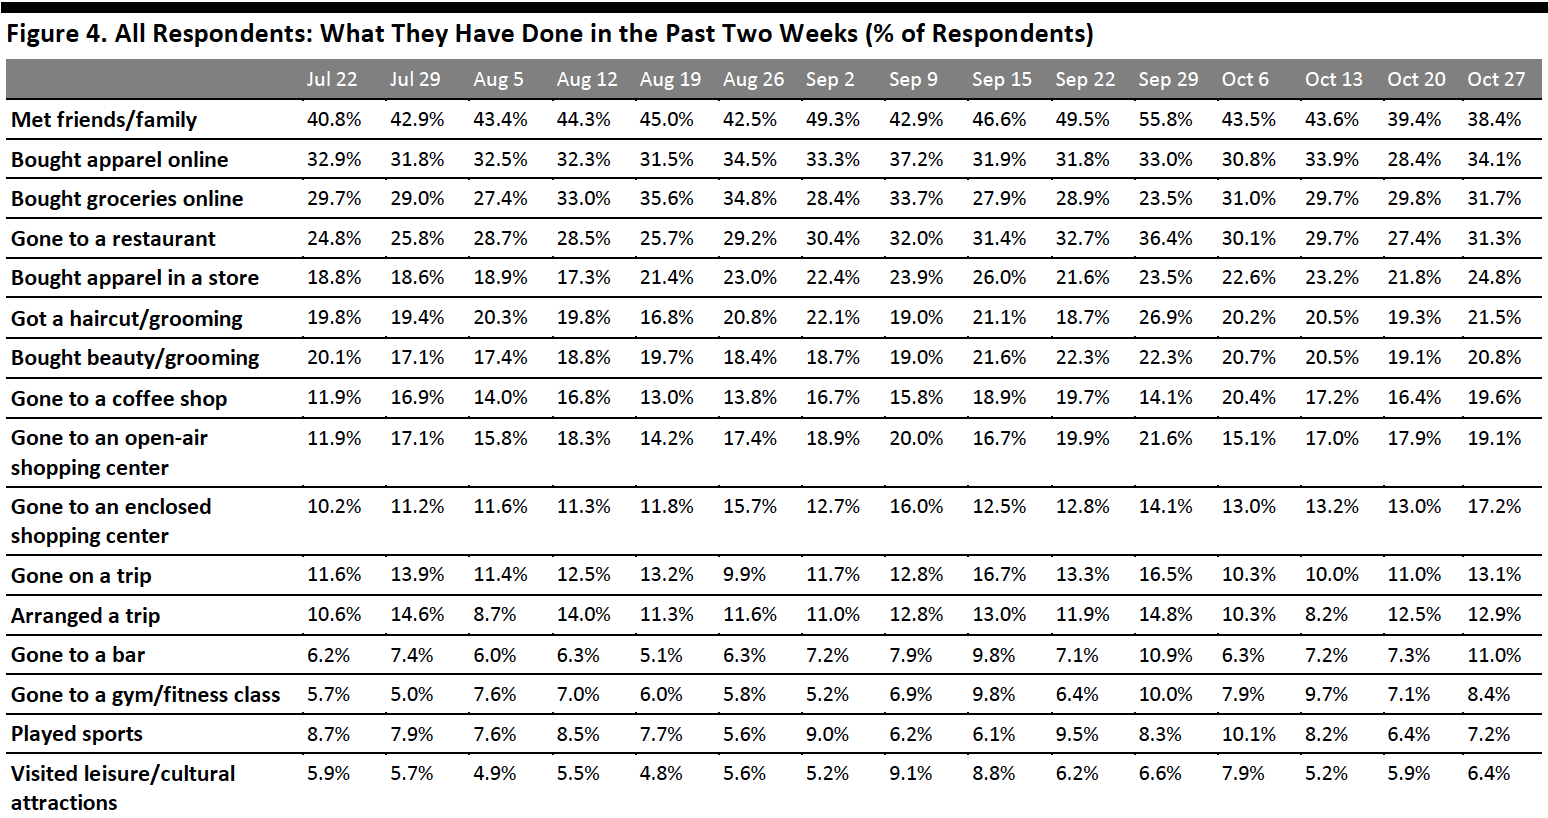
Each week, we ask consumers what they have done in the past two weeks. This week, the proportion of respondents slightly increased for 12 of the 16 options we provided for recent activities. Most of the week-over-week changes were within the margin of error; however, the directional trends, including over a number of weeks, can prove informative.
- Online apparel shopping bounced back after tapering off last week: The proportion of respondents that had bought clothing, footwear or accessories online in the past two weeks jumped six percentage points to 34.1% from 28.4% last week. This is also the highest level we have seen in the past month. In-store shopping also jumped slightly to 24.8%, compared to 21.8% last week. As we enter the holiday season, we are likely to see these metrics increase in the coming weeks.
- Some 31.7% of respondents said they had bought groceries online, versus 29.8% last week. In a separate survey question in this report, the proportion of consumers that are buying more food online than before the pandemic also increased slightly this week.
- More consumers have visited food-service locations in the past two weeks: Some 31.3% had gone to a restaurant, and one-fifth had gone to a coffee shop. In addition, some 11.0% had gone to a bar—the highest level since we started asking the question.
- Some 19.1% had gone to an open-air shopping center, versus 17.9% last week. The proportion of consumers that had visited an enclosed center reached a new high this week—17.2% had done so. These metrics remained low as we continue to see a high avoidance rate for shopping centers/malls, which we discuss later in this report.
 Respondents could select multiple options
Base: US respondents aged 18+
Source: Coresight Research[/caption]
Online Grocery Shopping Remains the Top Spending Activity for the Next Two Weeks
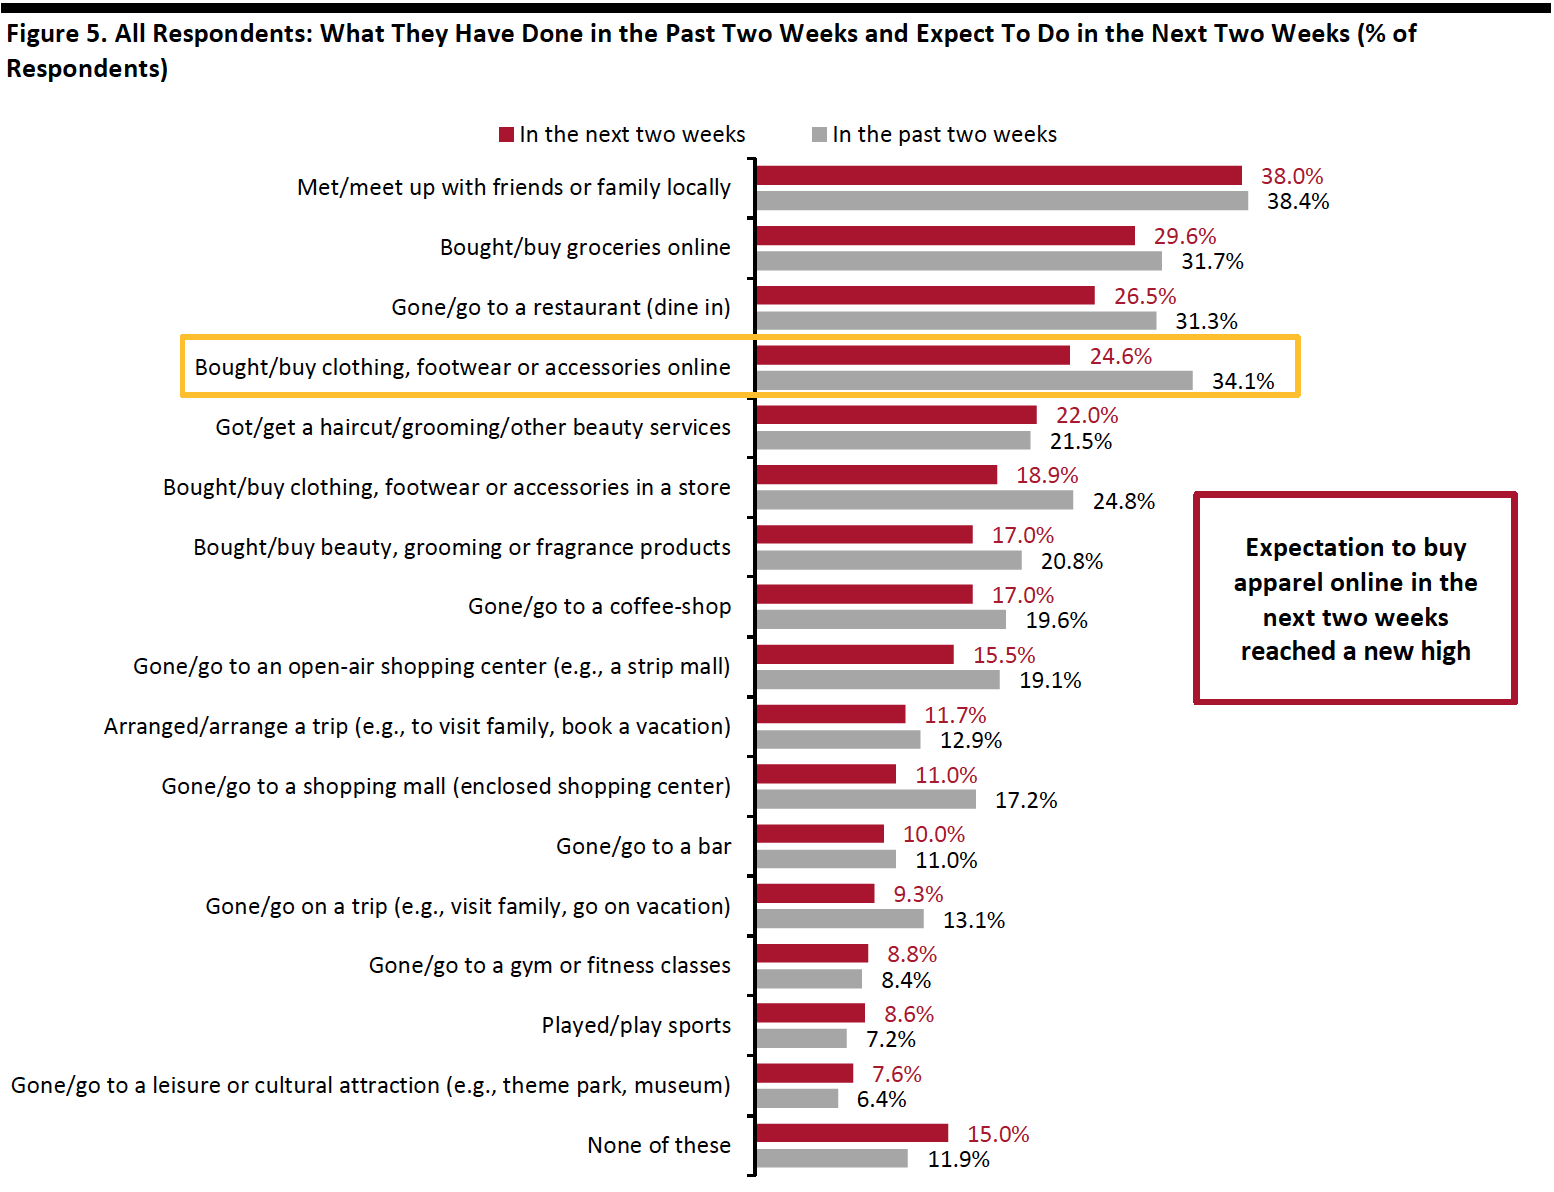
Each week, we also ask consumers what they expect to do in the next two weeks, with a set of options comparable to those for the last two weeks. In Figure 5, we compare these short-term expectations with recent actual behavior.
We saw slightly lower proportions of consumers expecting to do 11 of the 16 options we provided for activities in the next two weeks than actual behavior in the past two weeks.
- Online grocery shopping remained the top expected spending-related activity for consumers to do in the next two weeks, with 29.6% planning to do so, a little lower than the 31.6% of actual behavior in the past two weeks.
- The proportion of respondents that expect to buy clothing or footwear online stood at 24.6%—the highest expected level we have seen since June. Some 18.9% plan to buy apparel in a store. We expect to see higher proportions in actual behavior of apparel shopping, as the actual behavior of these activities has typically exceeded expected behavior in past survey results.
 Respondents could select multiple options
Base: US respondents aged 18+
Source: Coresight Research[/caption]
Eight in 10 Are Currently Avoiding Public Places
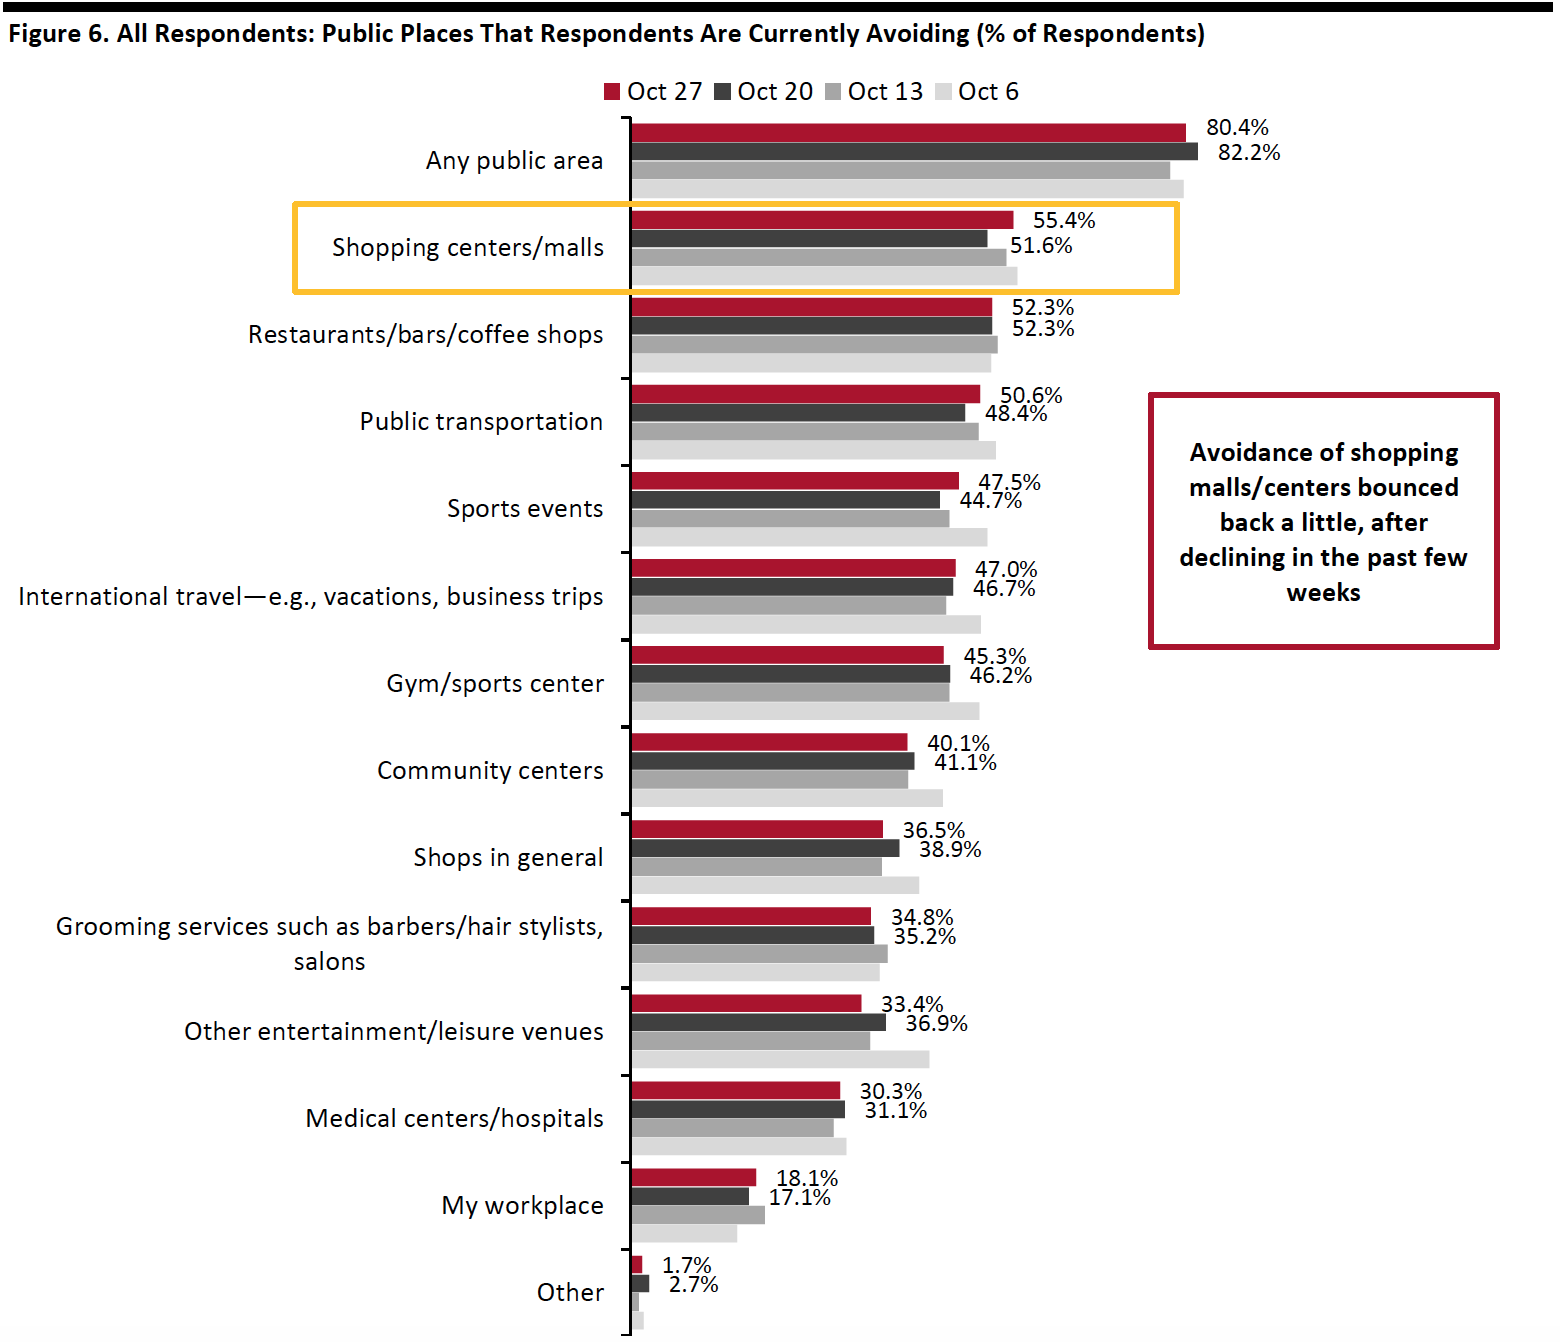
We have seen fluctuations in the avoidance of public places in the past couple of weeks. This week, the proportion of respondents saying that they are avoiding any type of public area returned to the level we saw in the first week of October at 80.4%, versus 82.2% last week.
We saw the avoidance rate for most of the options remain fairly stable, and changes in a few options were all were within the margin of error.
- The proportion of respondents that are currently avoiding shopping centers/malls rebounded a little after falling for four consecutive weeks to a new low last week. Some 55.4% are currently avoiding such places, compared to 51.6% last week. Shopping centers also returned as the most-avoided public places this week. On a brighter note, the avoidance rate for shopping malls/centers has stayed below 60% since mid-August.
- Avoidance of shops in general fell slightly to the level we saw two weeks ago: Some 36.5% are currently avoiding such places, versus 38.9% last week.
 Respondents could select multiple options
Base: US respondents aged 18+
Source: Coresight Research[/caption]
Reviewing Trend Data in Current Purchasing Behavior
What Consumers Are Currently Buying More Of and Less Of
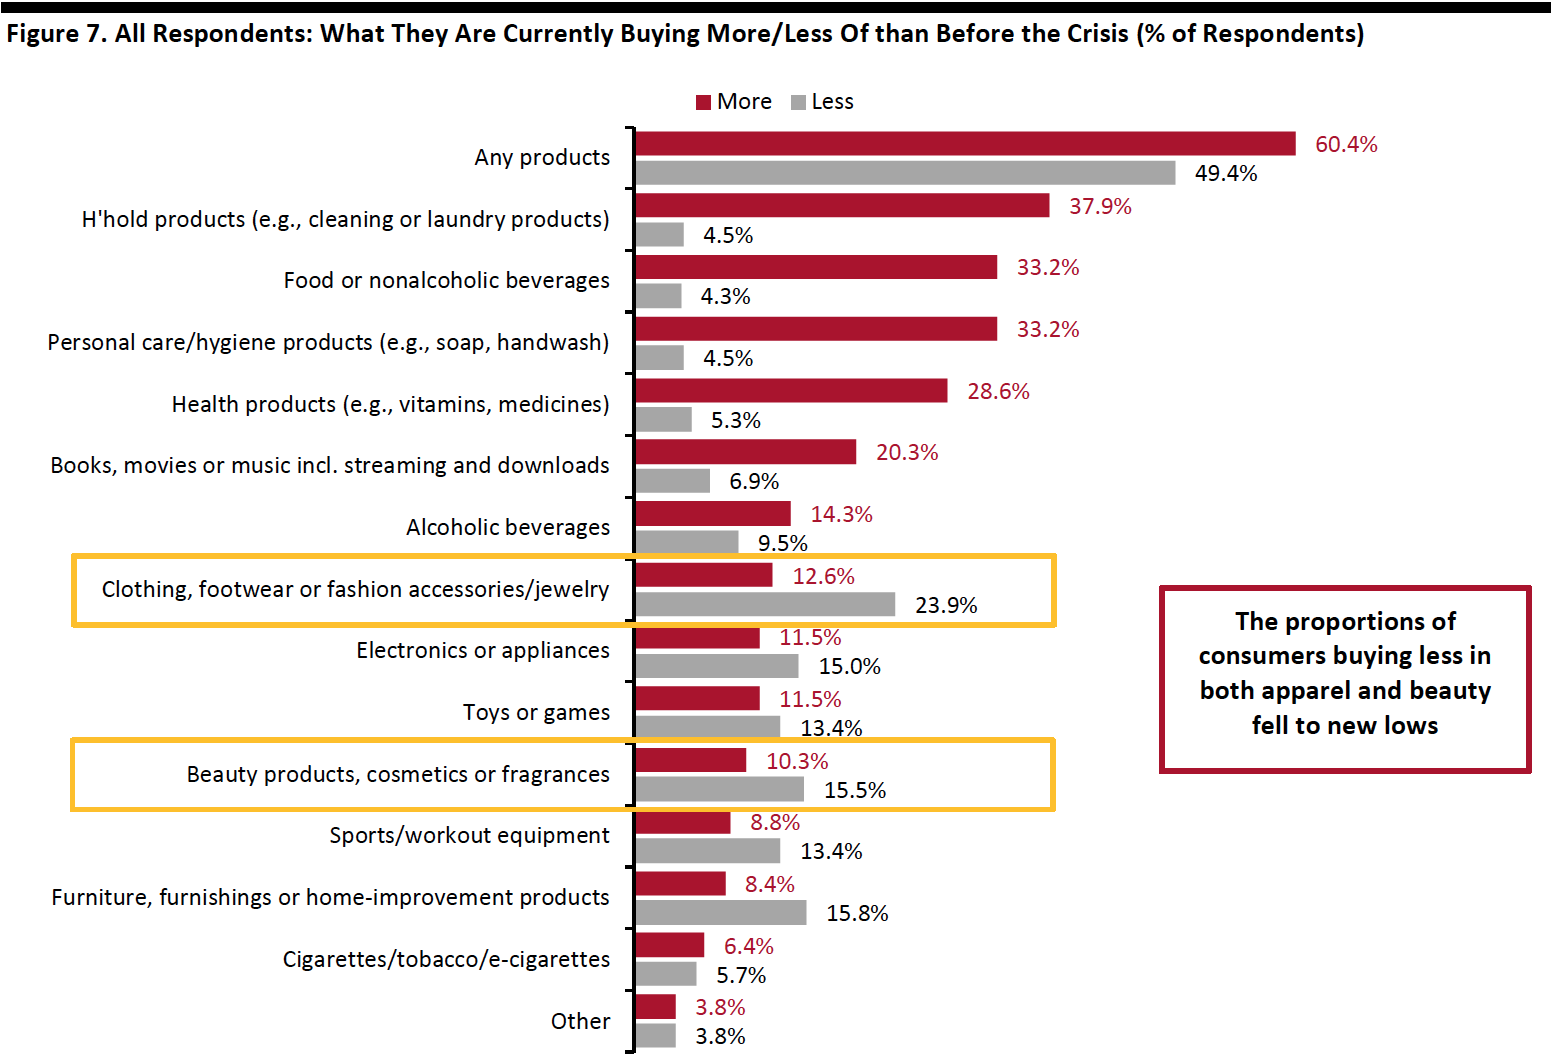
This week, the proportion of respondents that are currently buying more of any products than before the crisis declined by almost 12 percentage points, to 60.1%, from 71.9% last week. The proportion of respondents that are currently buying less than pre-crisis also went down slightly to the level two weeks ago, at 49.4%.
- Buying more of certain categories and buying less of certain categories were not mutually exclusive options, so respondents could answer yes to both.
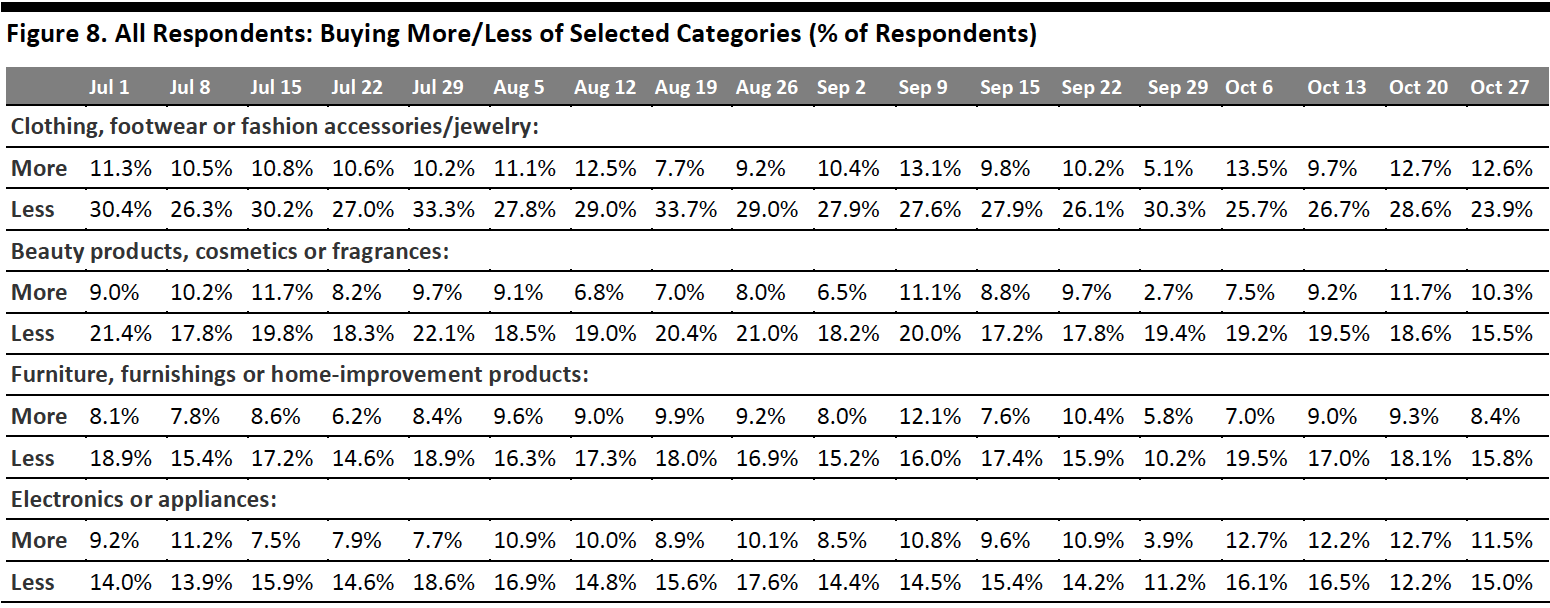
Buying more: Essentials, including household products, personal care and food, continue to be the most-purchased categories, although all three saw slight declines week over week. Household products experienced the largest decline of eight percentage points, to 37.9% from 45.7% last week.
Buying less: Discretionary categories—including clothing and footwear, beauty and home—remained the hardest-hit categories, with the highest proportions of consumers currently buying less of such products. However, some of these categories saw week-over-week improvements, with some 23.9% currently buying less apparel, down five percentage points from last week and the lowest level we have seen since March. The proportion of consumers currently buying less in beauty also reached a record low of 15.5%.
Ratio of less to more: The ratios of the proportions of respondents buying less to the proportions buying more in apparel and beauty both went down, while electronics jumped a little.
- The ratio for clothing and footwear fell to 1.9, from 2.3 last week and 2.7 two weeks ago.
- The ratio for beauty fell to its lowest this week, at 1.5, versus 1.6 last week and 2.1 two weeks before.
- The ratio for electronics went up a little to the ratio from two weeks ago at 1.3, after seeing the proportion that are buying more in electronics than pre-crisis exceeded those that are buying less last week.
- The ratio for home has stayed consistent for the third weeks now at 1.9.
 Respondents could select multiple options
Base: US respondents aged 18+
Source: Coresight Research[/caption] [caption id="attachment_118560" align="aligncenter" width="700"]
 Base: US respondents aged 18+
Source: Coresight Research[/caption]
More Than Two-Thirds Are Switching Spending Online
The proportion of consumers buying more online than they used to stood at 67.5%, compared to 70.4% last week, despite the decline in the proportion of consumers that are buying more of certain categories. The metric has remained relatively stable in the month of October at around seven in 10 on average, around the level we saw in July and August.
[caption id="attachment_118561" align="aligncenter" width="700"]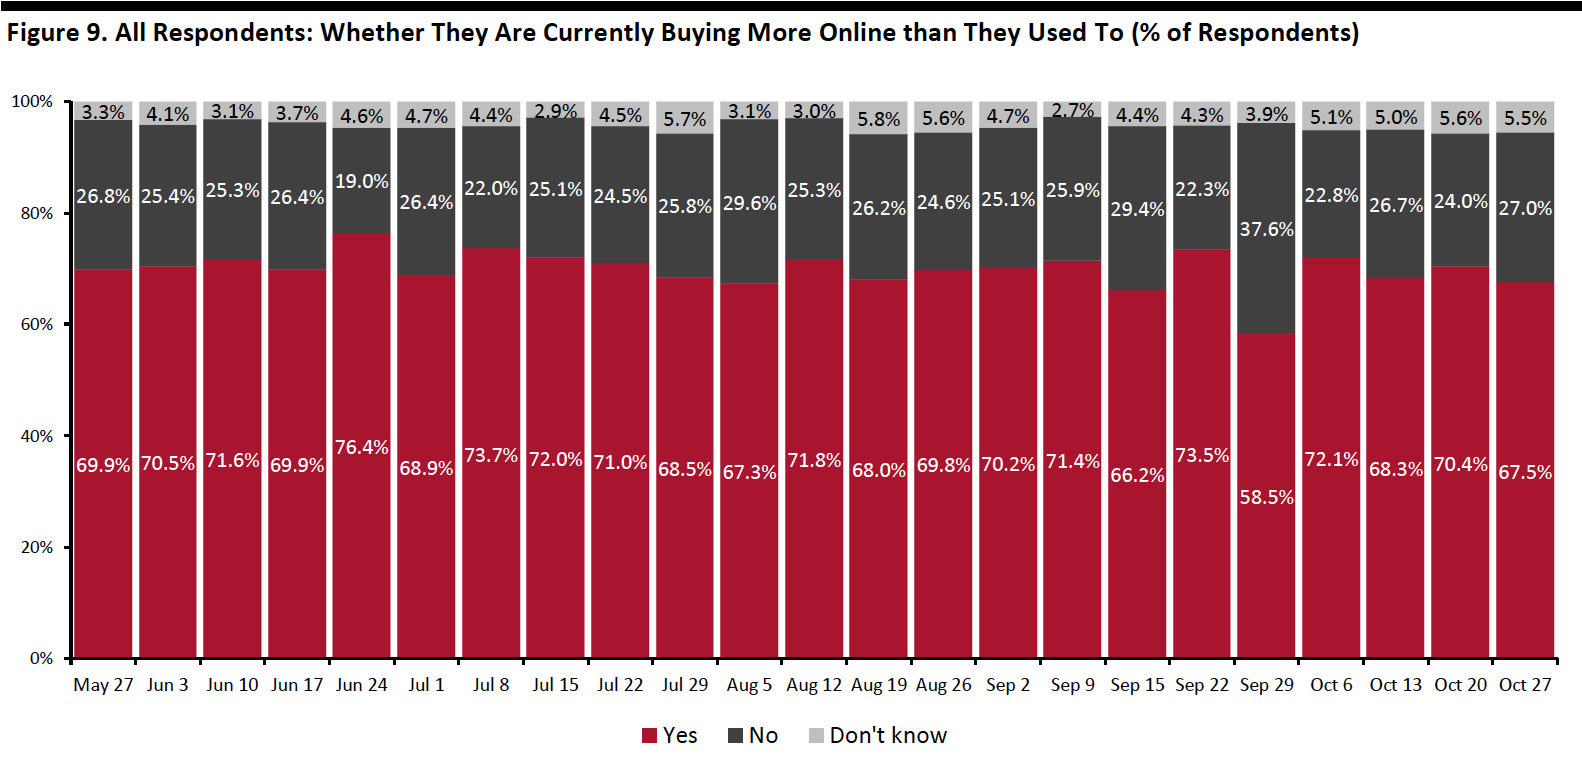 Base: US respondents aged 18+
Source: Coresight Research[/caption]
What Consumers Are Currently Buying More Of Online
Looking at specific categories, seven of the 13 options we provided saw week-over-week decreases in consumers buying more online than pre-crisis, although all of the changes were within the margin of error.
Household products and personal care remained the most-purchased categories online, with roughly three in 10 buying more of both online than pre-crisis. Online purchases of food increased for the second consecutive week, to one-quarter this week, up almost five percentage points from two weeks ago.
The proportion that are currently buying more clothing, footwear or accessories online jumped back a little to the level we saw a month ago, at 26.0%. This week, online purchases of electronics reached a new high since July—18.4% are currently buying more of such products then before the pandemic.
[caption id="attachment_118562" align="aligncenter" width="700"]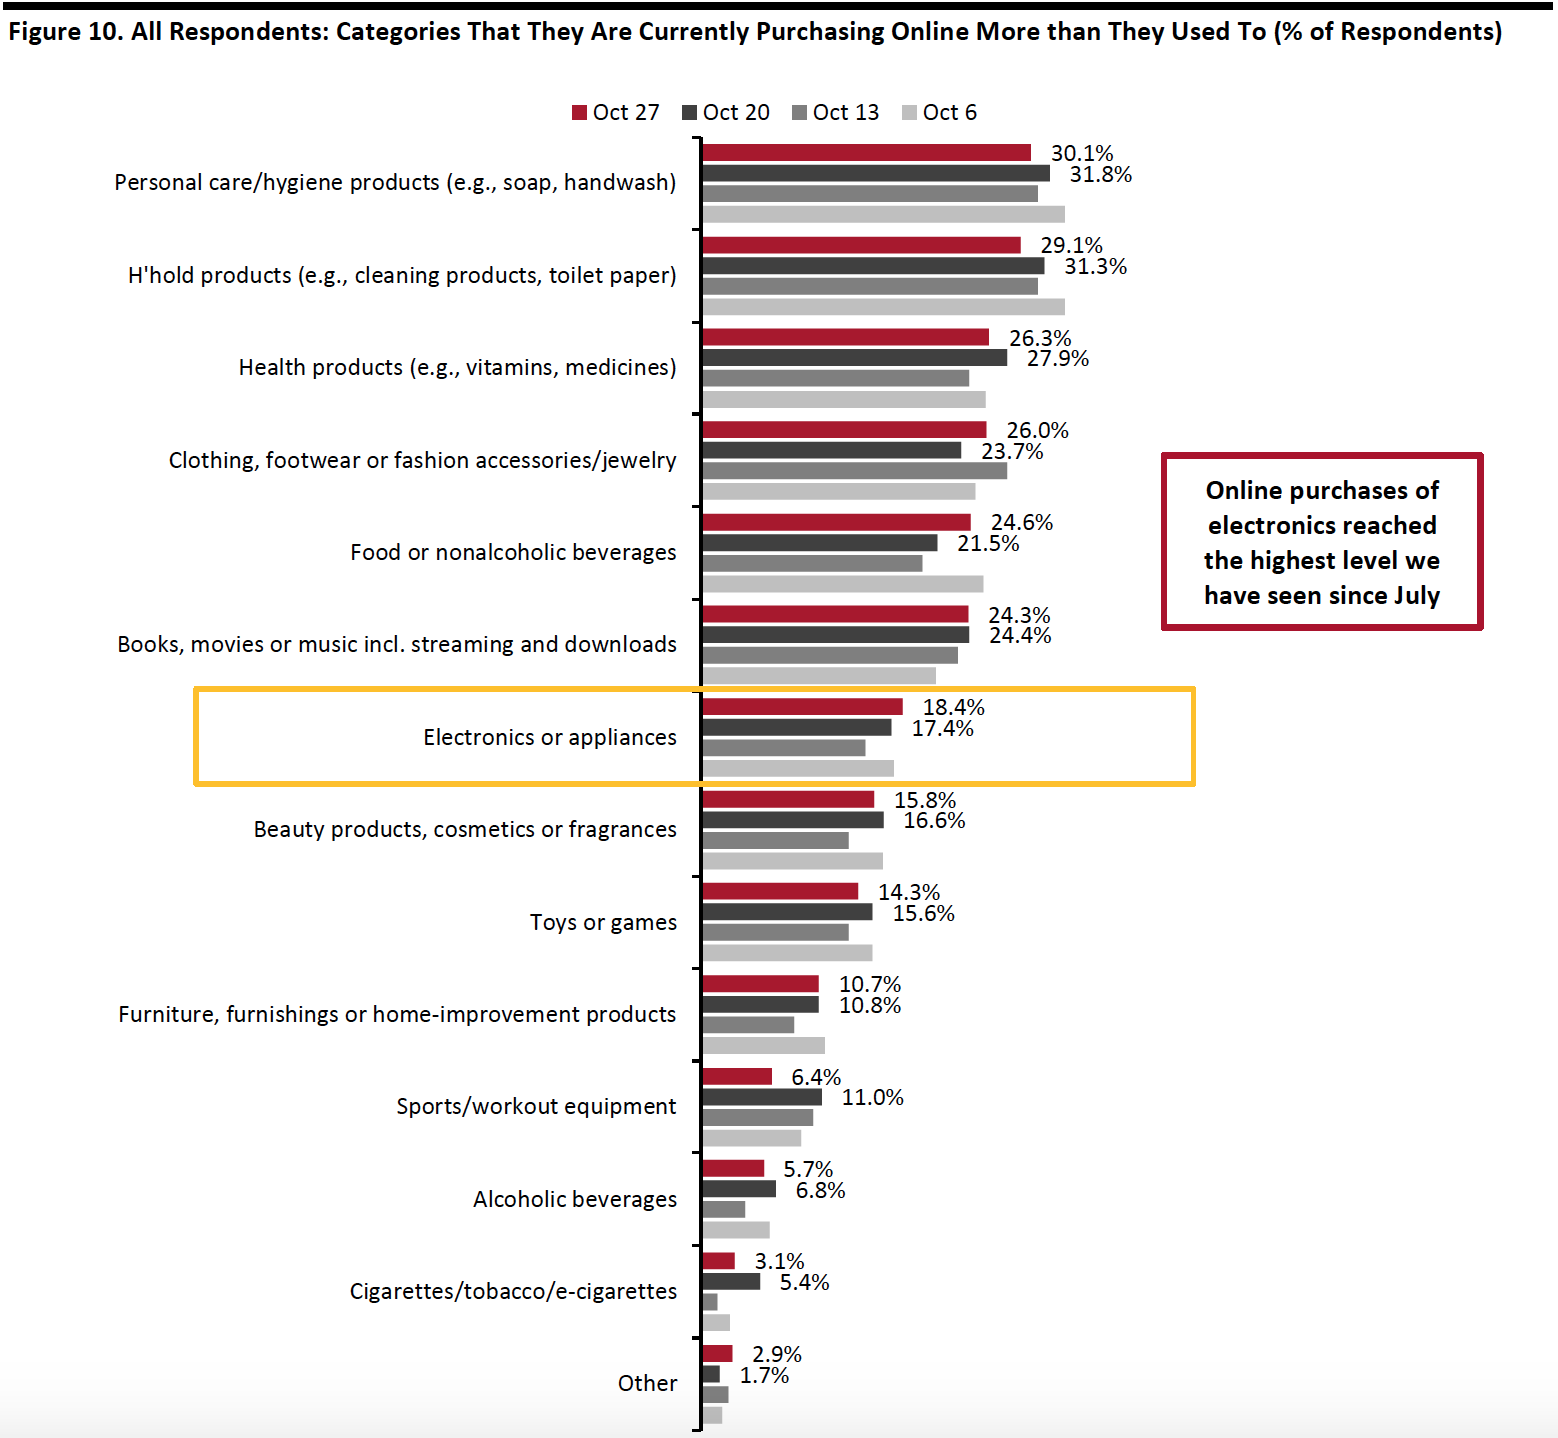 Respondents could select multiple options
Base: US respondents aged 18+
Source: Coresight Research[/caption]
What We Think
Our survey results reflect that a greater share of consumers plan to shop online for Thanksgiving and Black Friday than in-store in the midst of pandemic this year. Brands and retailers should prepare for a spike in e-commerce, such as by ramping up logistics and providing additional fulfillment options—including curbside pickup, which is the most popular collection service that shoppers expect to use, according to our survey.
With fewer consumers planning to shop in-store on Thanksgiving and Black Friday, brands and retailers should also determine whether to close or open their stores. We already have seen major retailers announcing plans to close their stores on Thanksgiving Day. Those that plan to stay open need to implement the necessary safety precautions.
Clothing, footwear or accessories and electronics are two of the most popular product categories that consumers plan to shop, whether in-store or online, on either or both Thanksgiving and Black Friday. This further reinforces our expectation of improvement in both categories during the holiday season.
This week, we saw the following from our recurring weekly questions:
- Apparel: Clothing and footwear remained the most-cut category. However, the proportion that are currently buying less in apparel than pre-crisis fell to 23.9%, the lowest level we have seen since March. Apparel shopping both online and in-store bounced back this week: Some 34.1% had bought apparel online, up six percentage points from 28.4% last week; and 24.8% had bought apparel in a store. In addition, the proportion of respondents that are currently buying more clothing, footwear or accessories online rebounded a little to 26.0%, versus 23.7% last week. Consumers’ expectations to buy clothing and footwear online in the next two weeks also reached a new high of 24.6%.
- Online Grocery: Online grocery shopping returned as a popular activity this week: Some 31.7% of respondents said they had bought groceries online. Also, one-fifth are currently buying more food online than before the pandemic, compared to 21.5% last week. For more data on the trajectory of grocery e-commerce, see our latest monthly US CPG Sales Tracker report.
- E-Commerce: The proportion of consumers that are currently buying more online than they used stood at 67.5%, versus 70.4% last week, despite a 12-percentage-point week-over-week decline in the proportion that are buying more of any products. We expect the level of shopping online to remain elevated as we move further into the holiday season, and we expect holiday-quarter sales to rise by around one-third year over year. See our Holiday 2020: US Shopper Survey for more data on consumers’ holiday shopping expectations, and the US E-Commerce: Post-Crisis Outlook report for more e-commerce data and analysis.
Methodology
We surveyed respondents online on October 27 (419 respondents), October 20 (409 respondents), October 13 (401 respondents), October 6 (416 respondents), September 29 (412 respondents), September 22 (422 respondents), September 15 (408 respondents), September 9 (406 respondents), September 2 (402 respondents), August 26 (414 respondents), August 19 (416 respondents), August 12 (400 respondents), August 5 (449 respondents), July 29 (403 respondents), July 22 (404 respondents), July 15 (454 respondents), July 8 (410 respondents), July 1 (444 respondents), June 24 (411 respondents), June 17 (432 respondents), June 10 (423 respondents), June 3 (464 respondents), May 27 (422 respondents), May 20 (439 respondents), May 13 (431 respondents), May 6 (446 respondents), April 29 (479 respondents), April 22 (418 respondents), April 15 (410 respondents), April 8 (450 respondents), April 1 (477 respondents), March 25 (495 respondents) and March 17–18 (1,152 respondents). The most recent results have a margin of error of +/- 5%, with a 95% confidence interval. Not all charted week-over-week differences may be statistically significant.