albert Chan
What’s the Story?
This report presents the results of Coresight Research’s latest weekly survey of US consumers, including on the impacts of the coronavirus outbreak, undertaken on October 13, 2020. We explore the trends we are seeing from week to week, following prior surveys on October 6, September 29, September 22, September 15, September 9, September 2, August 26, August 19, August 12, August 5, July 29, July 22, July 15, July 8, July 1, June 24, June 17, June 10, June 3, May 27, May 20, May 13, May 6, April 29, April 22, April 15, April 8, April 1, March 25 and March 17–18.
Holiday Season Shopping Update
This week, we again asked consumers about their expected shopping behaviors for the holiday season 2020, and we trend the findings with those from mid-July, mid-August and mid-September. We asked respondents:
- About their expected overall holiday season spending—including gifts and expenses related to traveling and dining out—this year compared to 2019.
- For those who expect to spend less this holiday season, what categories they plan to spend less on—from 15 options (as well as “other” and “don’t know”).
- Whether they agreed with any or all of 10 attitudinal and behavioral statements related to holiday-season shopping.
Half of Respondents Expect To Spend Less
We continue to see plans by the majority of consumers to cut their total spending this holiday season: In total, some 52.2% expect their total holiday spending to be less than last year, with 31.2% planning to spend a lot less and 21.0% expecting to spend slightly less.
Overall expectations were fairly consistent from the results in September. The biggest change has been in those who “don’t know” how their spending will turn out, which has increased by almost five percentage points from one month ago.
We asked respondents to think about their holiday spending overall—including retail purchases such as gifts, as well as spending driven by parties, social events and getaways.
[caption id="attachment_117793" align="aligncenter" width="700"]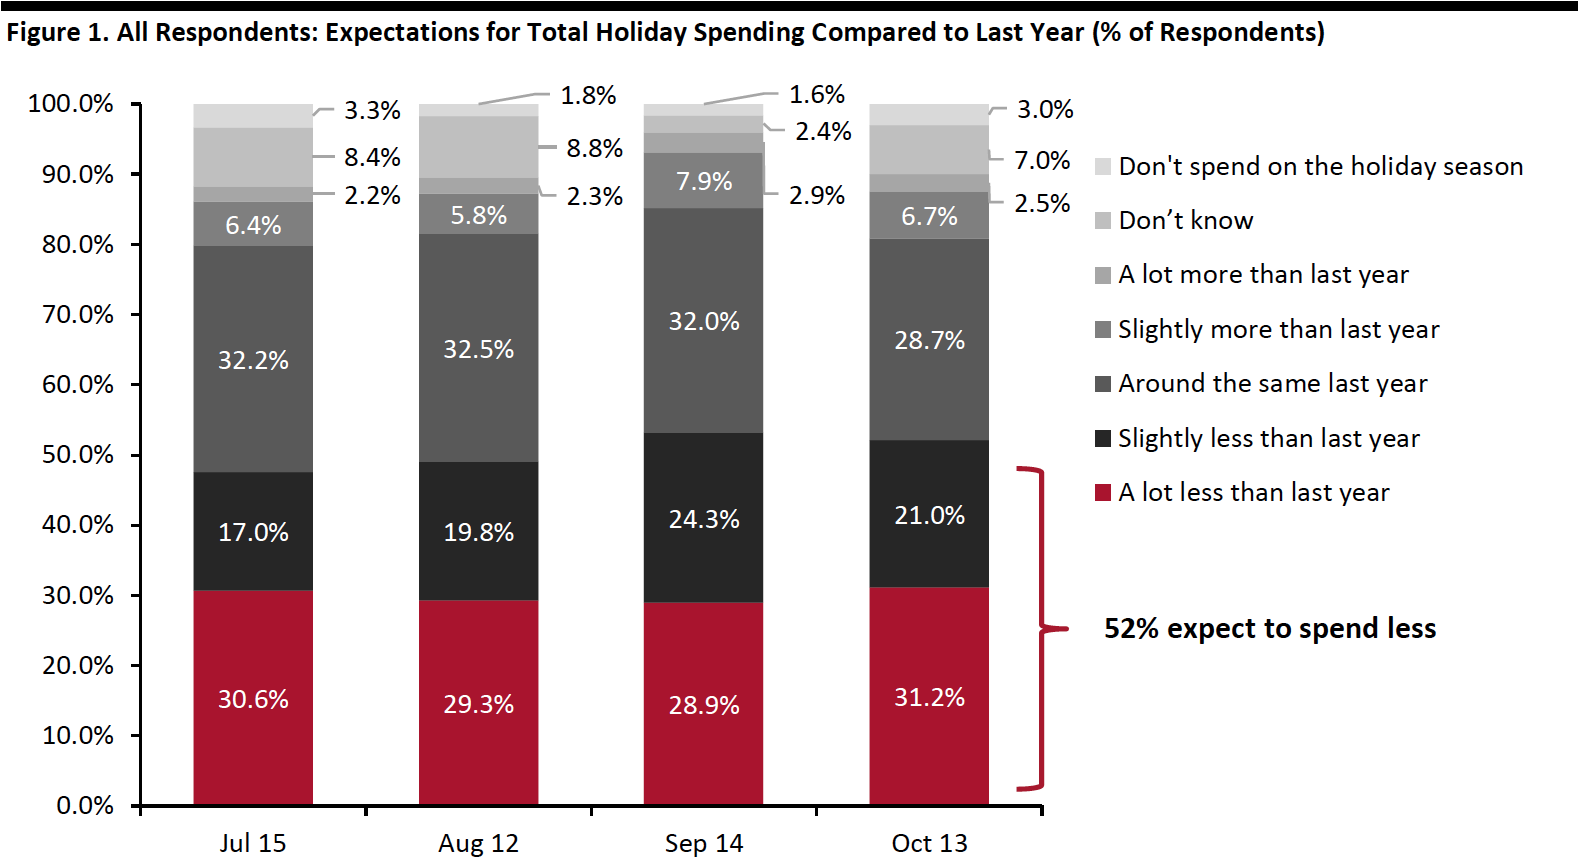 Base: US respondents aged 18+ (401 in October, 1,134 in September, 401 in August, 454 in July)
Source: Coresight Research[/caption]
For those who expect to spend less for the holiday season:
- Nonretail services are set to be hit the hardest. Some 45.0% said they will spend less on dining out or going to bars/nightclubs, and 41.2% expect to spend less on days out or vacations compared to last year.
- Seasonal decorations remained the top product category that consumers plan to spend less on for holiday 2020, at a stable proportion of 37%. Clothing and footwear recorded the largest sequential decline in expectations to spend less—some 23.0% expect to spend less on this category, down 11 percentage points from last month and the lowest level we have seen since we began asking this question. In addition, home/kitchen products and beauty/fragrance products both saw a month-over-month decrease of around seven percentage points in consumers expecting to spend less than last year.
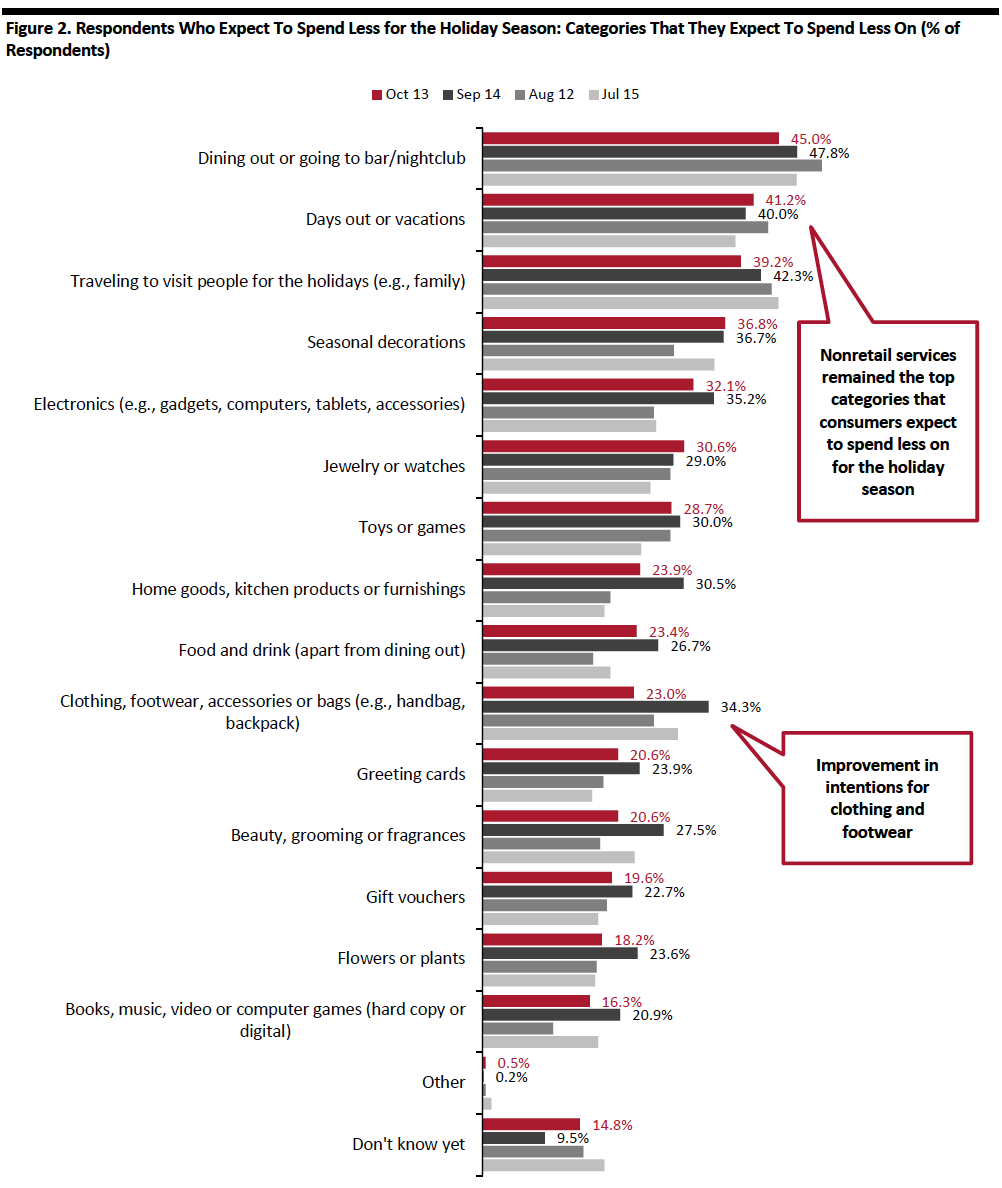 Respondents could select multiple options
Base: US respondents aged 18+ who expect to spend less on the 2020 holiday season than they did last year (209 in October, 603 in September, 196 in August, 216 in July)
Source: Coresight Research[/caption]
Over One-Quarter of Holiday Shoppers Expect To Shop Early
The new 10.10 Shopping Festival and Amazon’s Prime Day heralded the earliest start to the holiday season in an unpredictable shopping year. Some 23.9% of holiday shoppers said they expect to do their holiday shopping during Prime Day, which was much lower than in prior months. Our survey ran on the first day of Prime Day (October 13) and we noted this timing to respondents, so the numbers likely to be a more accurate reflection of what shoppers actually did versus prior months’ expectations. Big-box retailers including Target and Walmart also started their own promotional events in the same week, potentially capturing some of the share.
The latest Prime Day figure is very slightly lower than those who plan to buy on Cyber Monday (24.7%), although still ahead of Black Friday (18.8%).
Some 26.2% holiday shoppers said they expect to start holiday shopping earlier than usual this year, versus only 8.0% expecting to start later. The 18-percentage-point difference is a positive sign for retailers, as early holiday sales could help ease the pressures on e-commerce fulfillment by extending the season.
[caption id="attachment_117795" align="aligncenter" width="700"]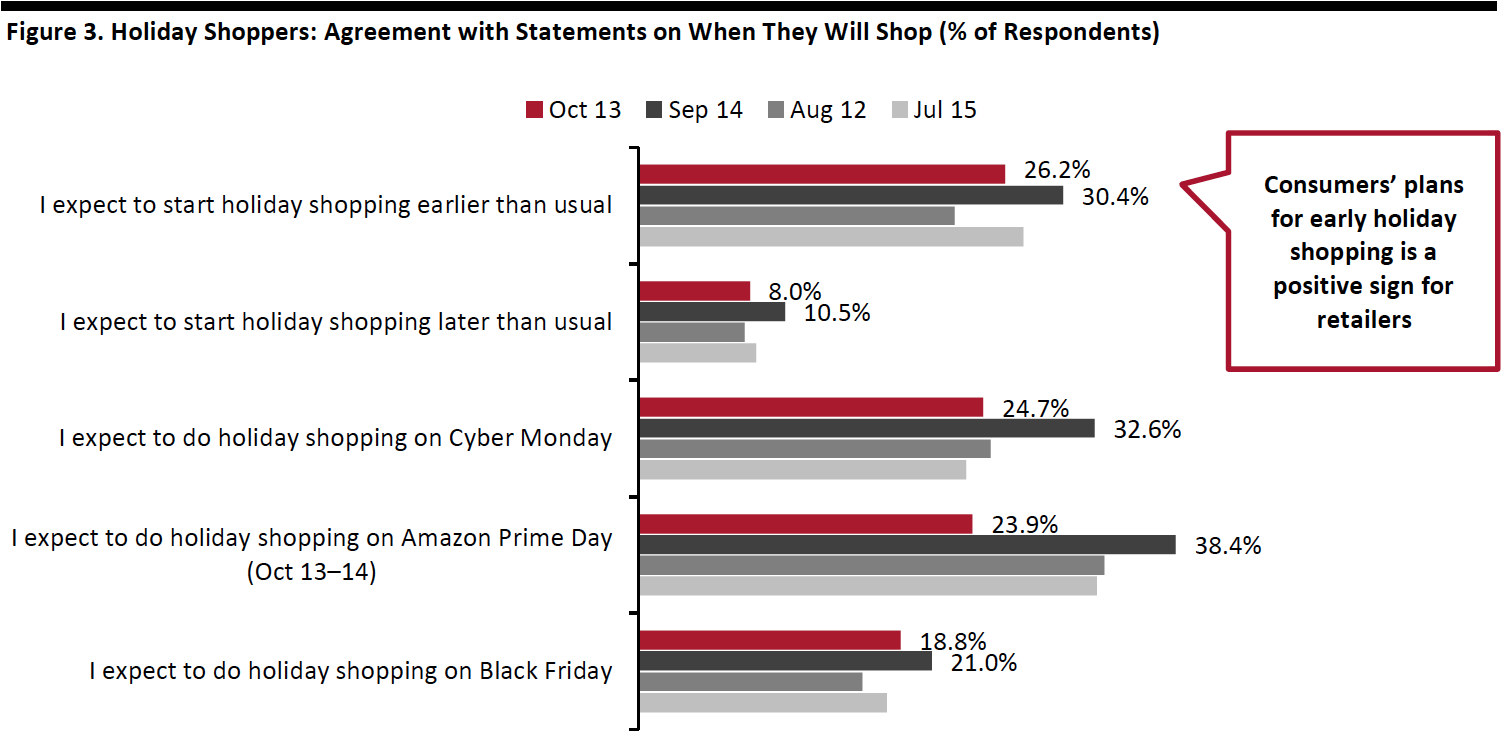 Base: US respondents aged 18+ who expect to spend on the holidays (389 in October, 1,116 in September, 393 in August, 439 in July)
Source: Coresight Research[/caption]
Three in 10 Plan To Consolidate Their Holiday Shopping Trips
Some 29.3% of holiday shoppers expect to shop from fewer stores to reduce their trips to brick-and-mortar stores. The consolidation of shopping trips could benefit retailers that offer a variety of product categories and brands, such as mass merchandisers and warehouse clubs.
One-quarter of holiday shoppers plan to switch some or all of their holiday spending from stores to e-commerce, versus one-third a month ago. This decline is hard to explain given that a substantial and stable 68.3% of respondents told us that they are currently buying more online than they used to (see later in this report). However, the relatively low overall percentage for switching holiday shopping online may reflect the already high e-commerce participation rates for online shopping during the holiday season. The total of 24.9% switching holiday shopping online is roughly in line with the proportion that expect to shop more online in the long term (which we discuss later in this report).
Some 22.1% of holiday shoppers expect to use curbside pickup services for some of their online purchases, and one-fifth plan to use in-store pickup services.
[caption id="attachment_117796" align="aligncenter" width="700"]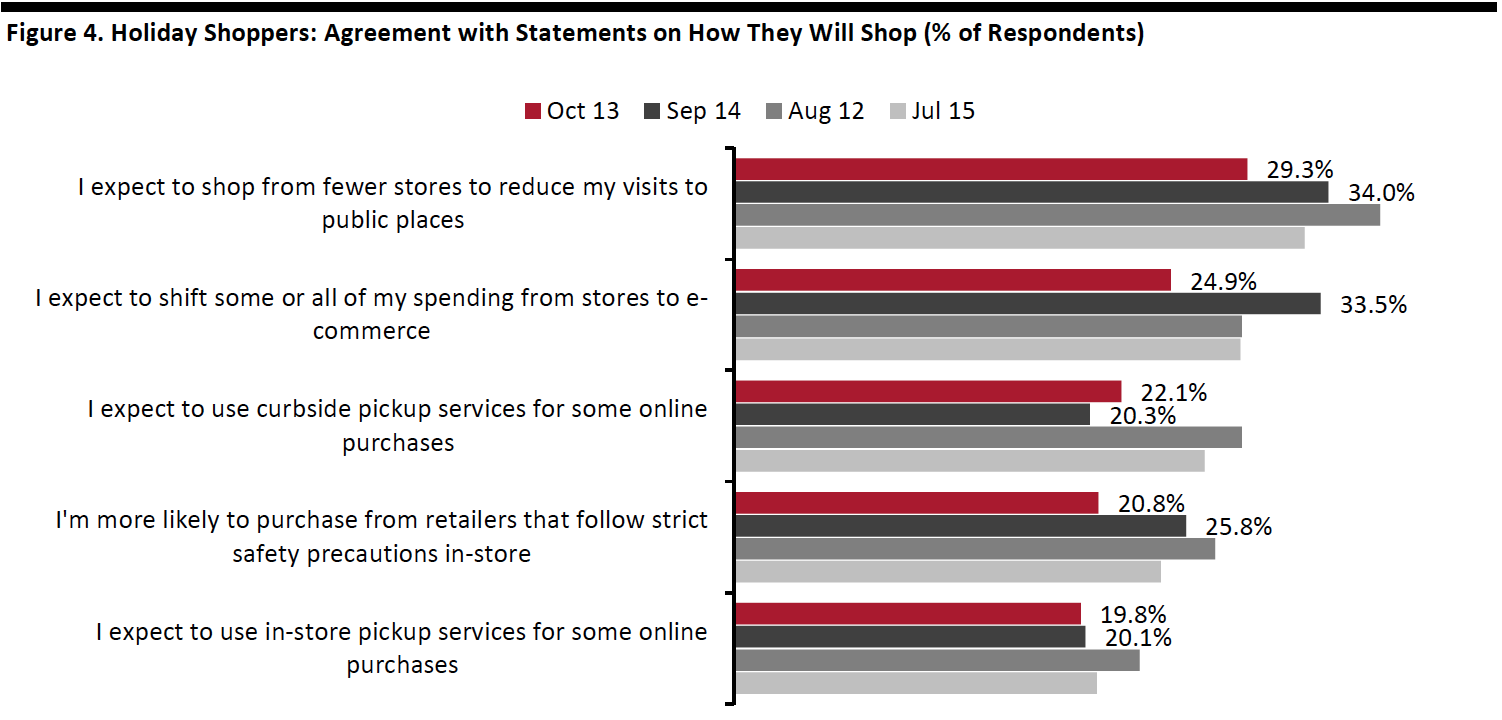 Base: US respondents aged 18+ who expect to spend on the holidays (389 in October, 1,116 in September, 393 in August, 439 in July)
Source: Coresight Research[/caption]
What Shoppers Are Doing and Where They Are Going
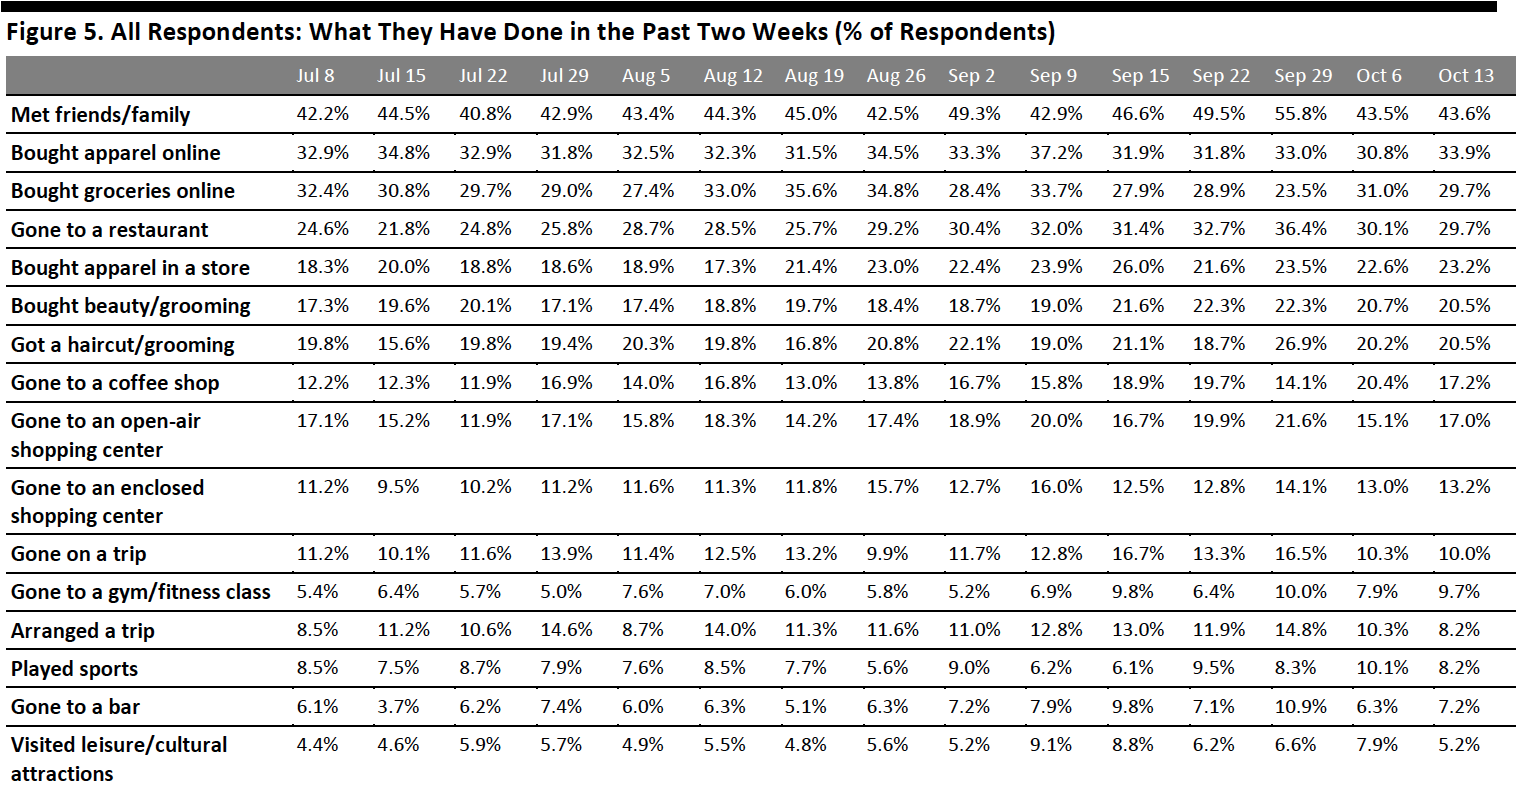
Online Apparel Shopping Returned as the Top Spending Activity
Each week, we ask consumers what they have done in the past two weeks. This week, the proportion of respondents remained fairly stable for half of the 16 options we provided for recent activity options. All of the week-over-week changes were within the margin of error; however, the directional trends, including over a number of weeks, can prove informative.
- The proportion of respondents that had bought clothing and footwear online in the past two weeks returned back to the level we saw two weeks ago—at 33.9%, versus 30.8% last week. It was the most popular of the spending activity options. The proportion that had bought apparel in a store has stayed consistent at around 23% for three consecutive weeks. As we move into the holiday season, we would expect these metrics to increase in the coming weeks.
- Some 29.7% of respondents said they had bought groceries online in the past week, broadly level with last week. However, a separate survey question found that the proportion of consumers that are buying more food online than before the pandemic fell by almost six-percentage points week over week, discussed later in this report.
- The proportion of respondents that had visited an open-air shopping center climbed slightly, to 17.0%, after declining by almost seven percentage points last week. However, the proportion is still below the highest level of 21.6% that we saw two weeks ago. The proportion of respondents that had visited an enclosed shopping center leveled off at 13.2% this week.
 Respondents could select multiple options
Base: US Internet users aged 18+
Source: Coresight Research[/caption]
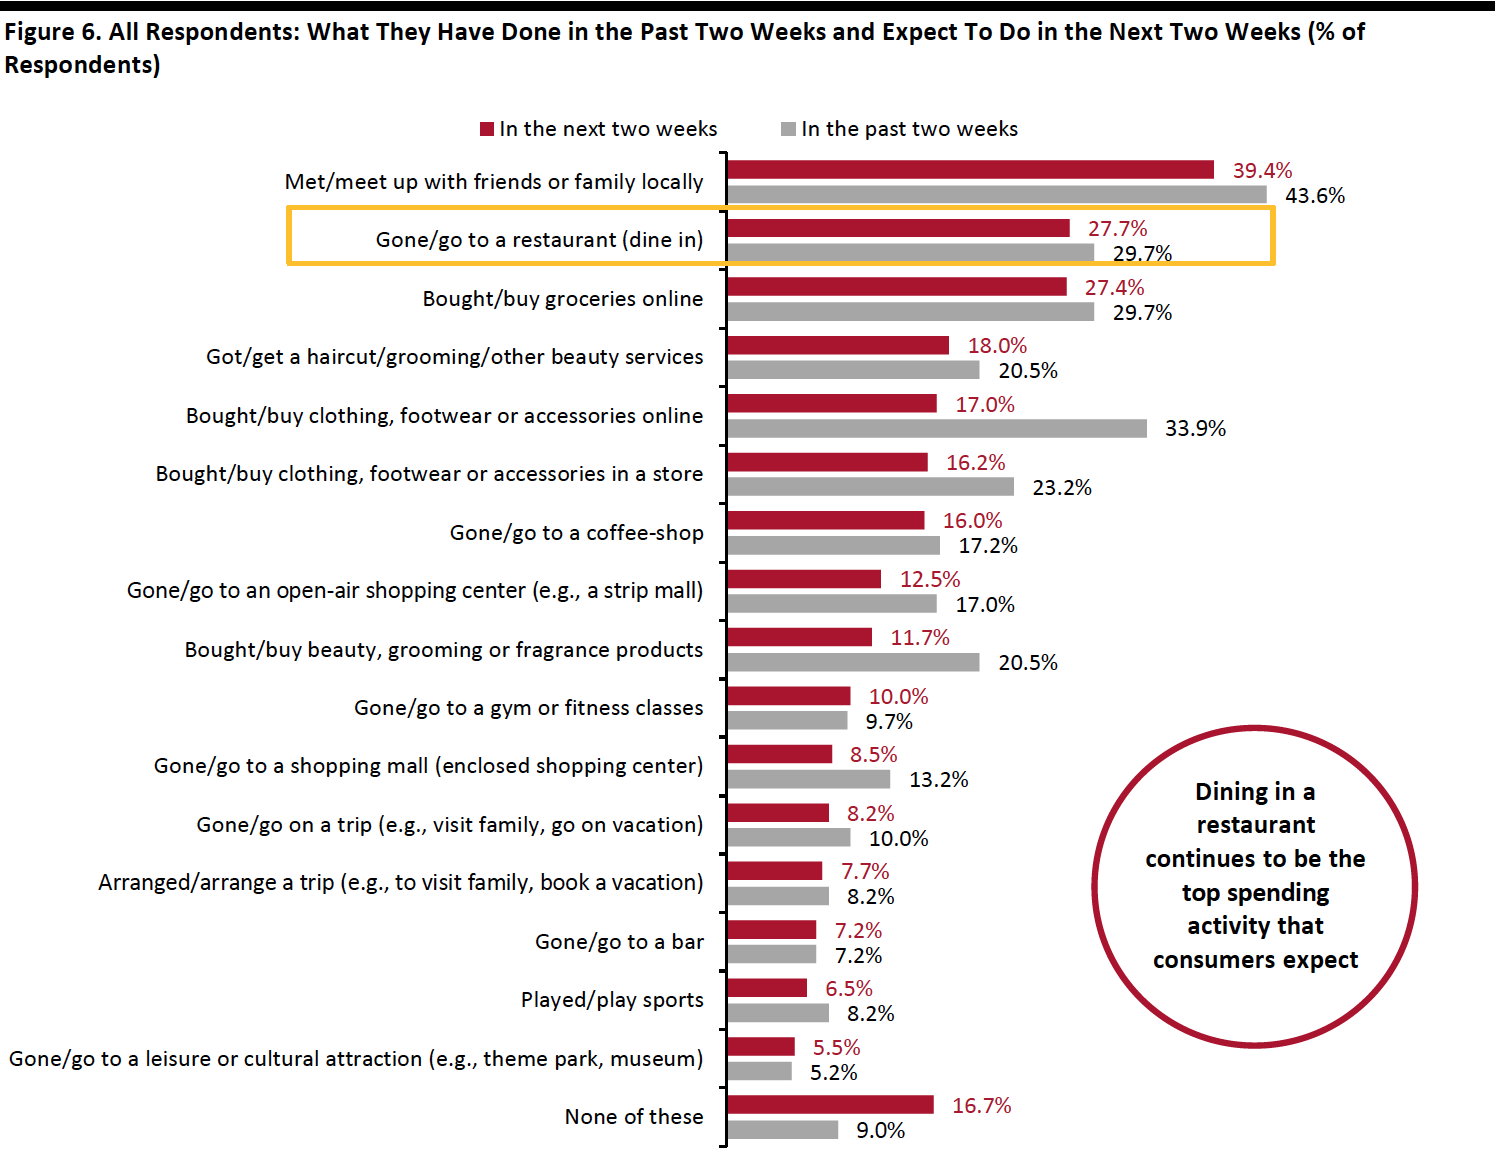
Dining in a Restaurant Continues To Be the Top Spending Activity for the Next Two Weeks
Each week, we ask consumers what they expect to do in the next two weeks, with a set of options comparable to those for the last two weeks. In the chart below, we compare these short-term expectations with recent actual behavior.
We saw slightly lower proportions of consumers expecting to do 12 of the 16 options we provided for activities in the next two weeks than actual behavior in the past two weeks.
- Dining in a restaurant remained the top expected spending-related activity for consumers to do in the next two weeks, with 27.7% planning to do so, although this was a little lower than the 29.7% of actual behavior in the past two weeks. We also saw slightly fewer consumers planning to go to coffee shops than recent actual behavior of this activity.
- The proportion of respondents that expect to buy clothing or footwear online stood at 16.9%—very close to the 16.2% that plan to do so in a store. Some 11.7% of consumers expect to purchase beauty products. We are likely to see higher proportions in actual behavior of these shopping activities, as the actual behavior of those activities has typically exceeded expected behavior in past survey results.
 Respondents could select multiple options
Base: US respondents aged 18+
Source: Coresight Research[/caption]
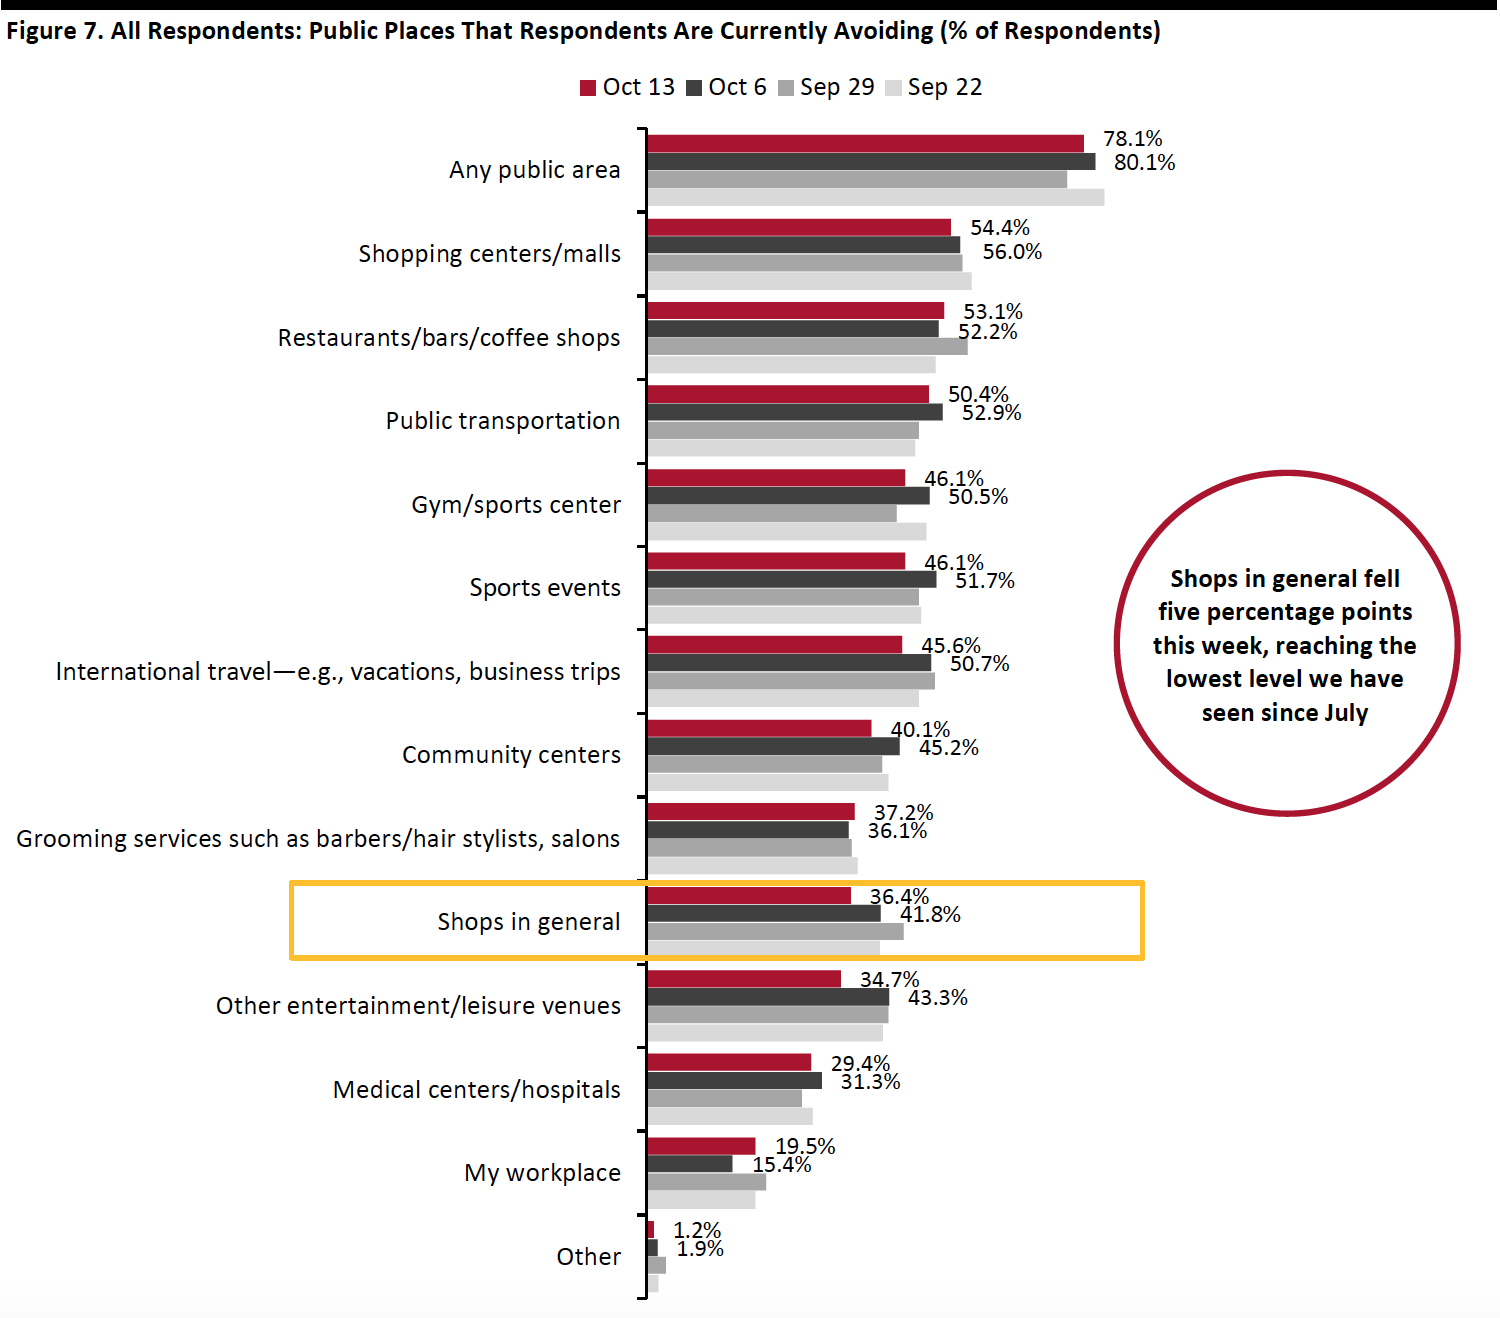
Almost Eight in 10 Are Currently Avoiding Public Places
This week, the proportion of respondents saying that they are avoiding any type of public area stood at 78.1%, versus eight in 10 last week.
Encouragingly, we saw decreases in avoidance for 10 of the 12 options provided, although most of the changes were within the margin of error.
- The proportion of respondents that are currently avoiding shopping centers/malls fell for the third consecutive week (changes were within the margin of error). Some 54.4% are currently avoiding such places, compared to 56.0% last week. Although still relatively high, the avoidance rate has remained under 60% since the week of August 26.
- Avoidance of shops in general also reached the lowest level we have seen since July. Some 36.4% are currently avoiding such places, down five percentage points from 41.8% last week. The avoidance rate has fallen 17 percentage points from the highest level of 53.5% on July 22.
- Entertainment and leisure venues saw the largest decrease in avoidance this week, of almost nine percentage points: Some 34.7% of respondents are currently avoiding these places—the lowest level we have seen since July.
 Respondents could select multiple options
Base: US respondents aged 18+
Source: Coresight Research[/caption]
Reviewing Trend Data in Current Purchasing Behavior
What Consumers Are Currently Buying More Of and Less Of
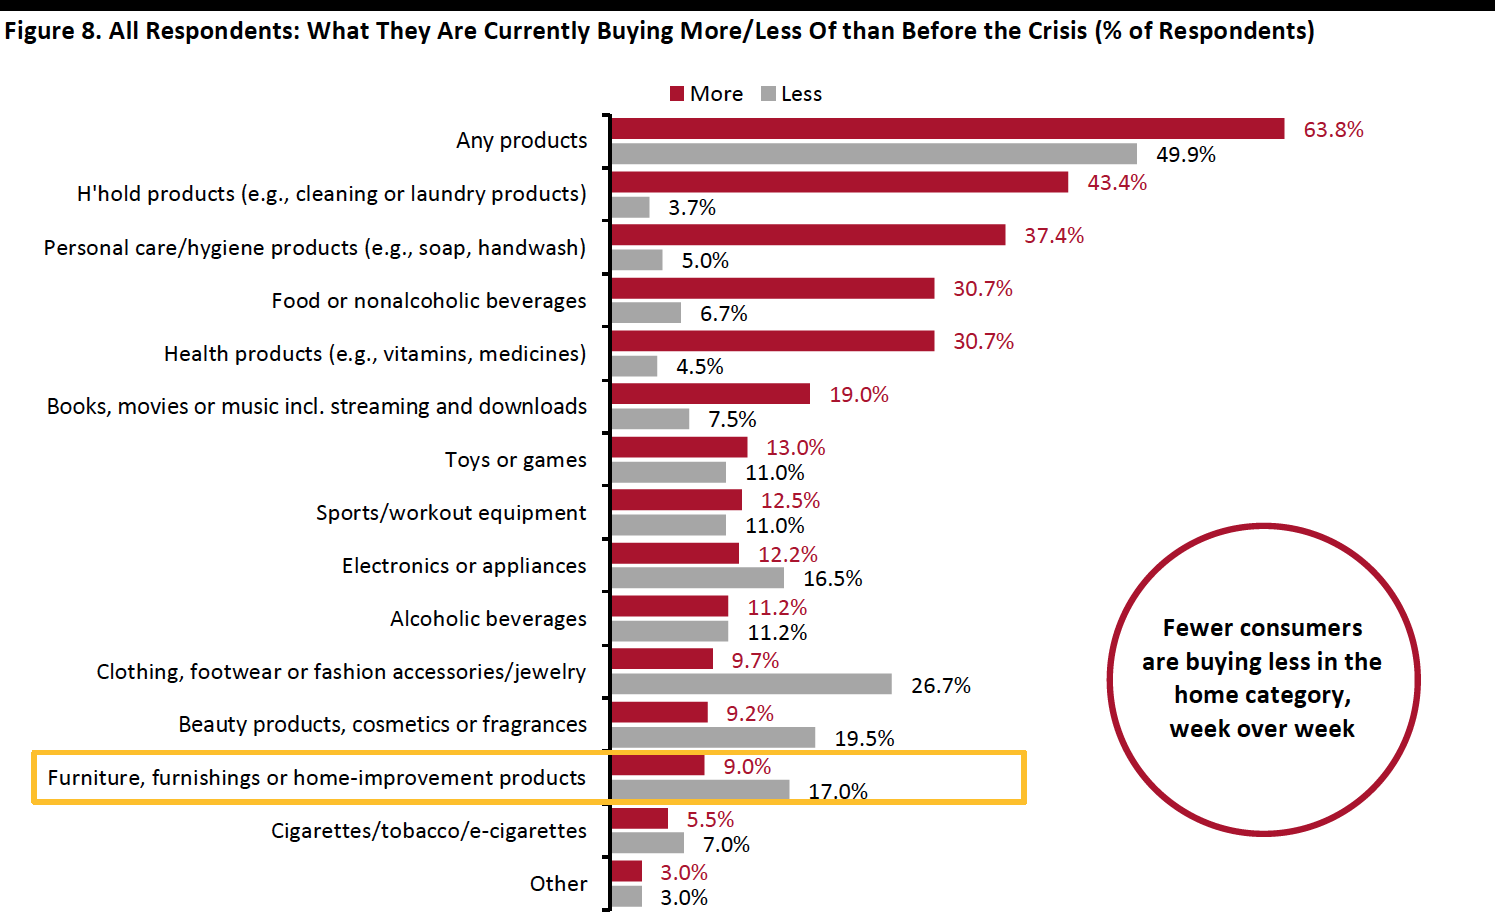
This week, the proportion of respondents that are currently buying more of any products than before the crisis decreased slightly, to 63.8% from 67.3% last week. The proportion of respondents that are currently buying less than pre-crisis broadly leveled off, at 49.9% this week.
- Buying more of certain categories and buying less of certain categories were not mutually exclusive options, so respondents could answer yes to both.
Buying more: Essentials, including household products, personal care and food, continue to be the most-purchased categories. Alcoholic beverages saw the largest week-over-week decrease, of almost nine percentage points, in consumers that are currently buying more.
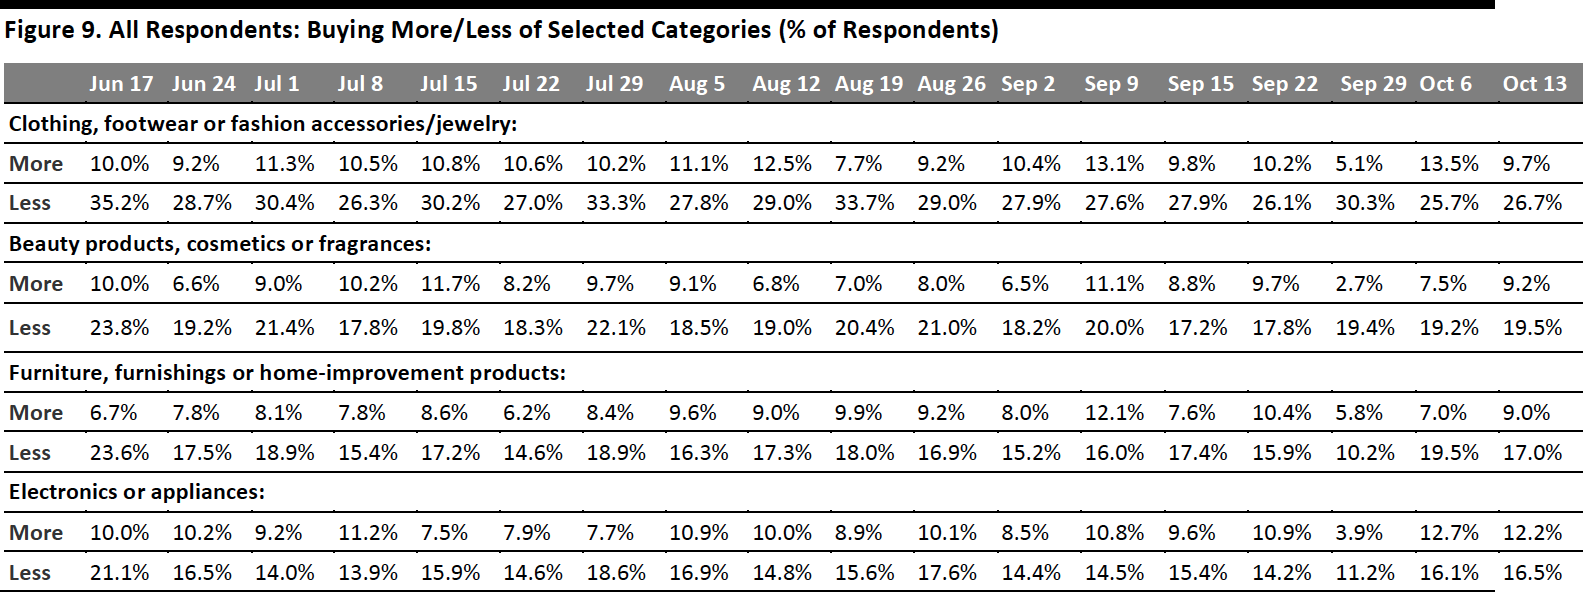
Buying less: Discretionary categories—including clothing and footwear, beauty and home—remained the most-cut categories, with the highest proportions of consumers currently buying less of such products. Some 26.7% are currently buying less apparel. Home is the only discretionary category tracked in Figure 9 that saw a week-over-week decline: Some 17.0% are currently buying less in the home category, compared to around one-fifth last week.
Ratio of less to more: The ratios of the proportions of respondents buying less to the proportions buying more in beauty and home both went down this week, while the ratio of clothing and footwear increased.
- The ratio for home decreased to 1.9, compared to 2.8 last week.
- The ratio for beauty continued to fell this week to 2.1, versus 2.6 last week.
- The ratio for electronics stayed consistent week over week at 1.3.
- The ratio for clothing and footwear raised to 2.7, from the lowest level of 1.9 last week.
 Respondents could select multiple options
Base: US respondents aged 18+
Source: Coresight Research[/caption] [caption id="attachment_117801" align="aligncenter" width="700"]
 Base: US respondents aged 18+
Source: Coresight Research[/caption]
Almost Seven in 10 Are Switching Spending Online
We have seen the proportion of consumers buying more online than they used to fluctuating in the past couple of weeks. This week, the proportion returned to the level we saw a month ago, at 68.3%.
[caption id="attachment_117802" align="aligncenter" width="700"]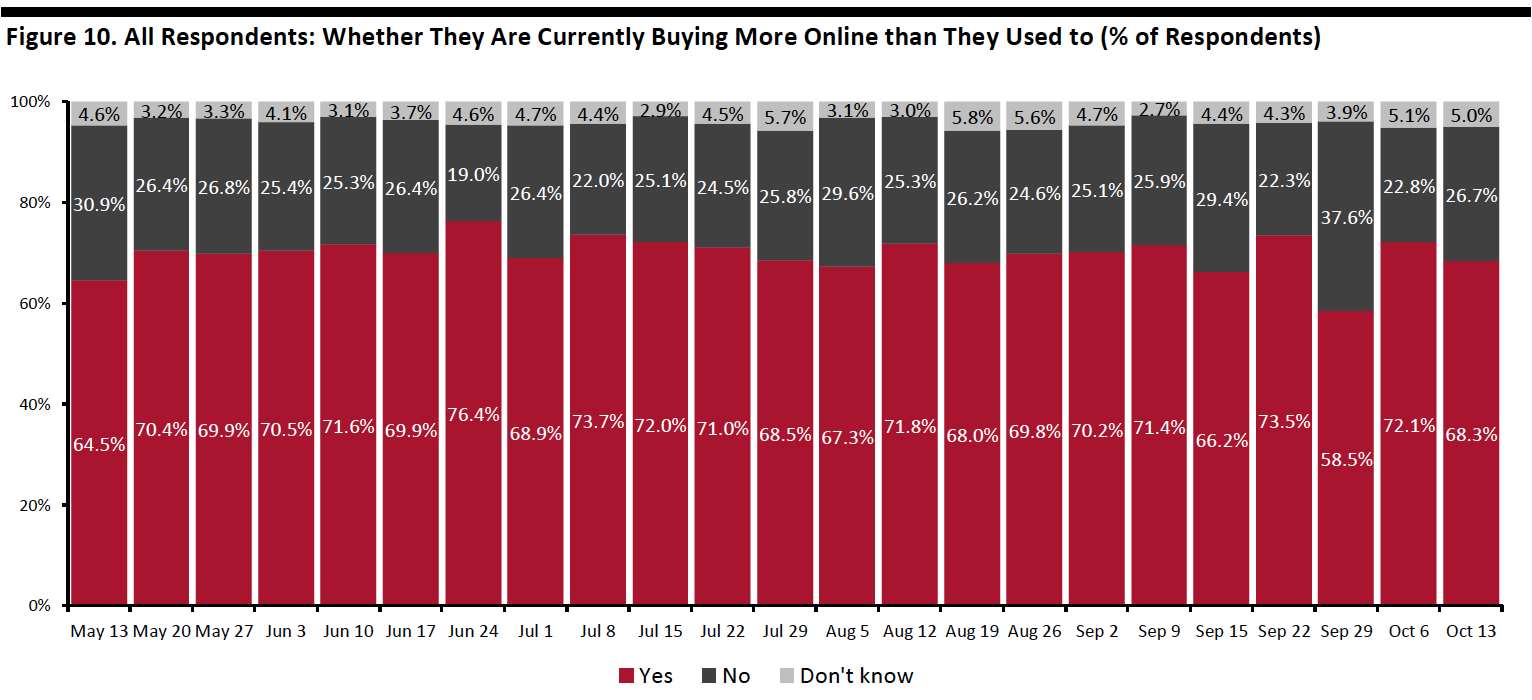 Base: US respondents aged 18+
Source: Coresight Research[/caption]
What Consumers Are Currently Buying More of Online
Looking at specific categories, 10 of the 13 categories we provided as options saw week-over-week decreases in consumers buying more online than pre-crisis, although almost all of the changes were within the margin of error.
Household products and personal care remained the most-purchased categories online, with both categories seeing three in 10 respondents buying more of such products than before the crisis.
We continue to see fluctuations in online purchases of food. This week, the proportion of consumers buying more food online than pre-crisis dropped by almost six percentage points, to one-fifth, from over one-quarter last week.
The proportion of respondents that are currently buying more apparel online jumped to the level we saw a month ago at 27.9%, versus one-quarter last week, making it the third most-purchased category online. This mirrors the upticks in consumers buying apparel online in the past two weeks, discussed earlier in the report. Online purchases of other discretionary categories, including home, electronics and beauty, all slid slightly.
[caption id="attachment_117803" align="aligncenter" width="700"]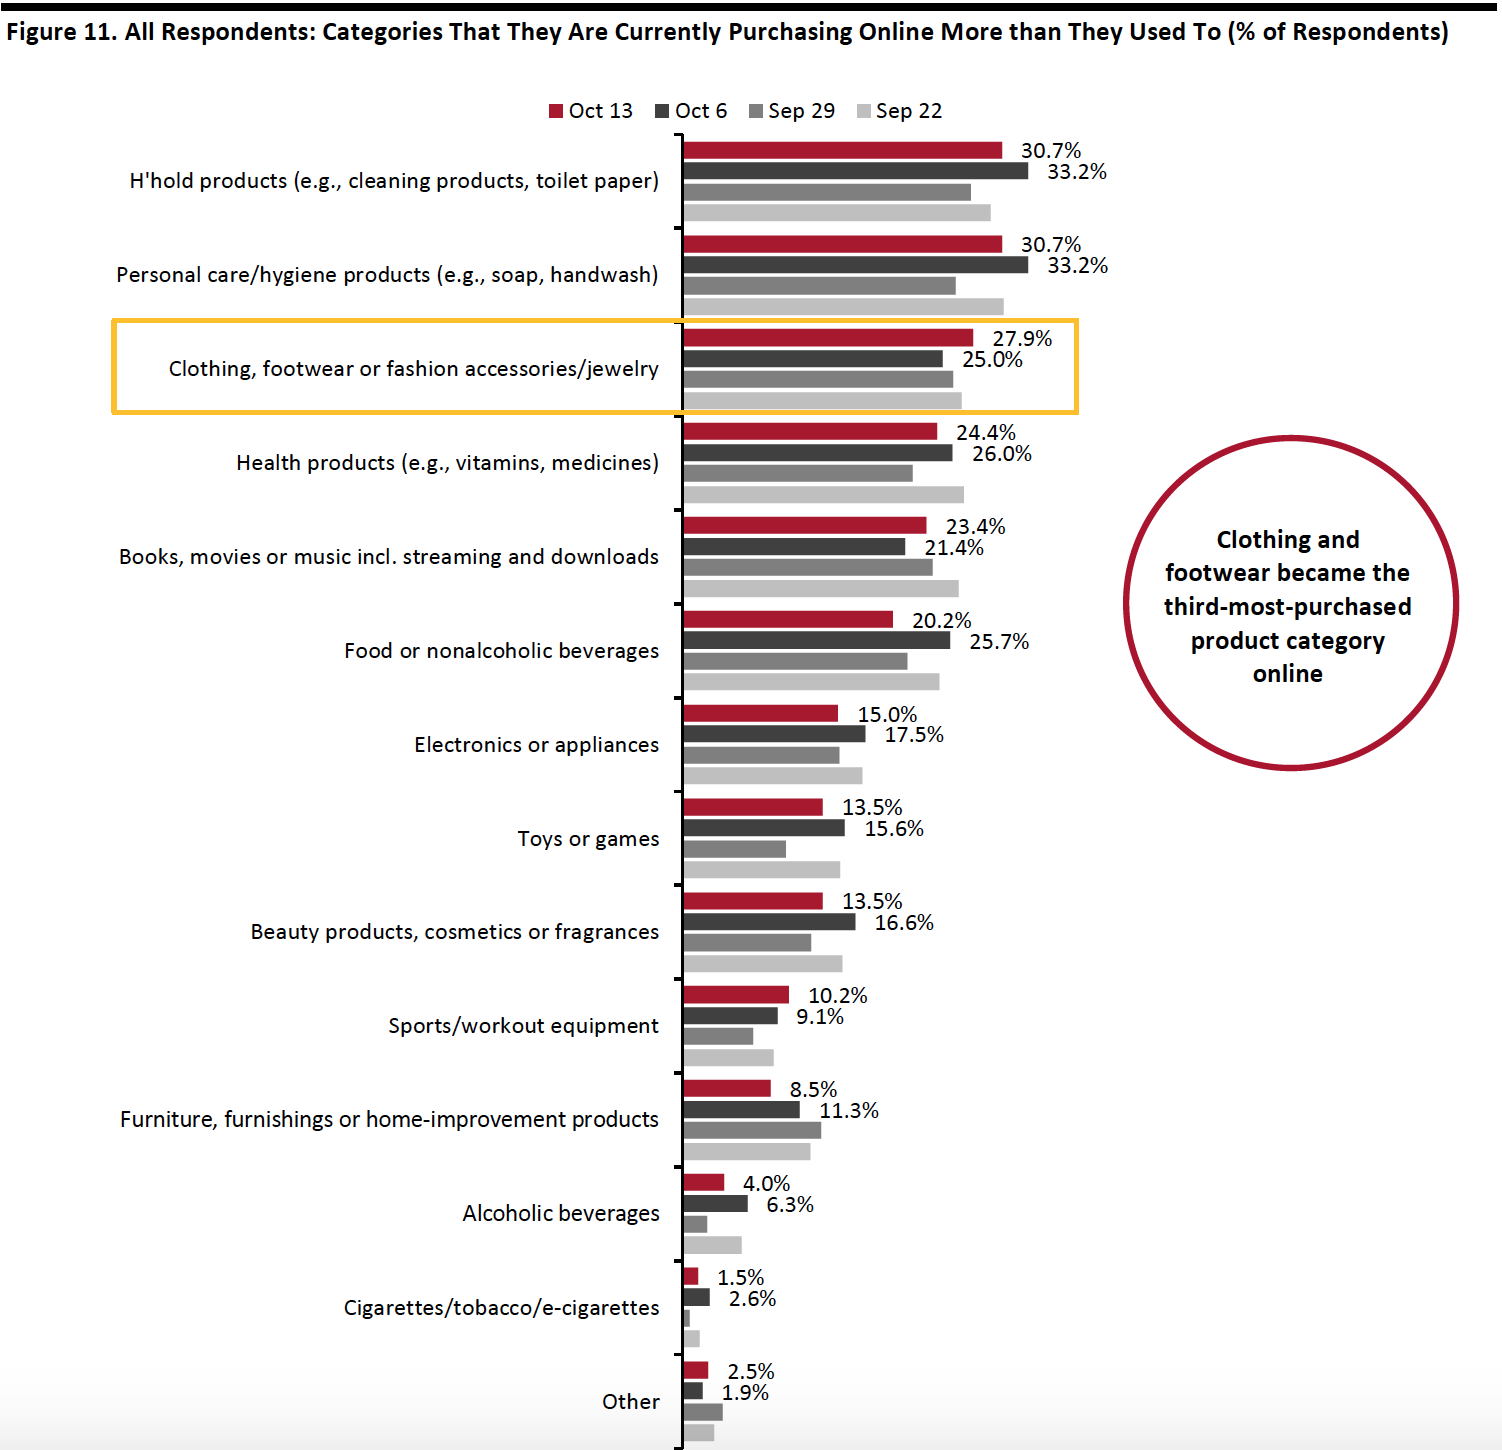 Respondents could select multiple options
Base: US respondents aged 18+
Source: Coresight Research[/caption]
Half Expect To Retain Changed Behaviors over the Long Term
We asked respondents whether they think they will keep some of the behaviors they have adopted during the coronavirus crisis in the long term. Half of respondents expect to retain some changed behaviors this week, aligned with what we saw a month ago, when we last asked this question.
[caption id="attachment_117804" align="aligncenter" width="700"]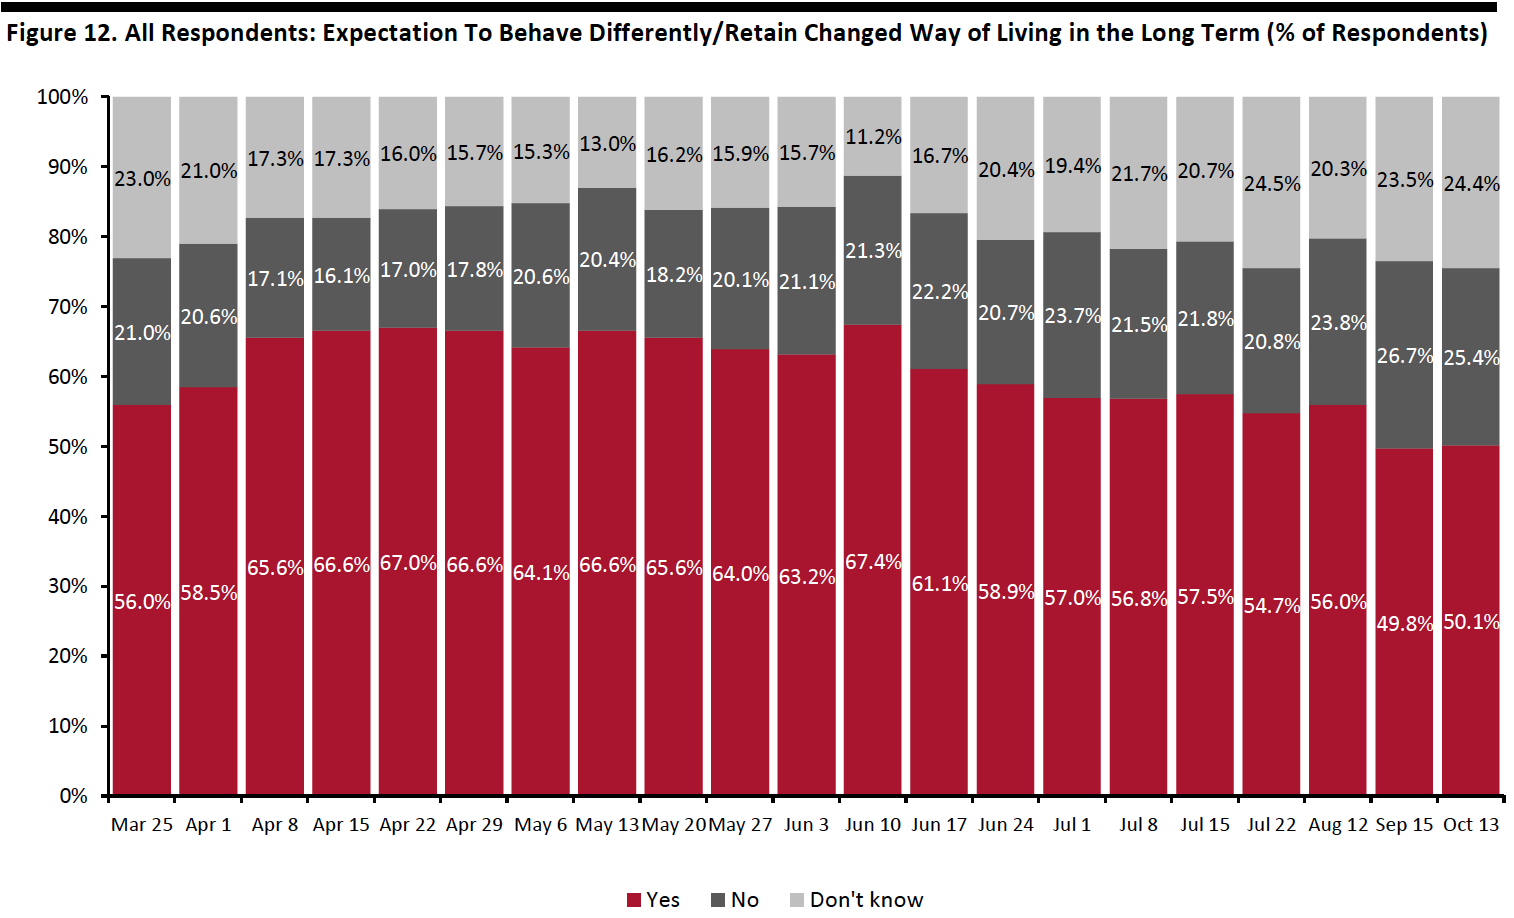 Question not asked on July 29, August 5, August 19, August 26, September 2, September 9, September 15, September 22, September 29 or October 6
Base: US respondents aged 18+
Source: Coresight Research[/caption]
We saw declines in the proportions of all respondents selecting 10 of the 11 behavior options we provided, compared to a month earlier, although some changes were within the margin of error.
Having more hygienic practices remained the top behavior to retain in the long term, although the proportion saw the largest month-over-month decline, of nine percentage points, to 25.9%.
The proportion of respondents expecting to use contactless payment options in stores more often than they did previously fell to its lowest level since we added the option in June: Some 17.7% plan to use the contactless payment in the long term, down from 22.3% a month ago.
The proportion of consumers expecting to have less physical interaction in the long term also declined to the lowest level since April: Some 22.9% plan to retain such behavior, compared to one-quarter a month ago.
[caption id="attachment_117805" align="aligncenter" width="700"]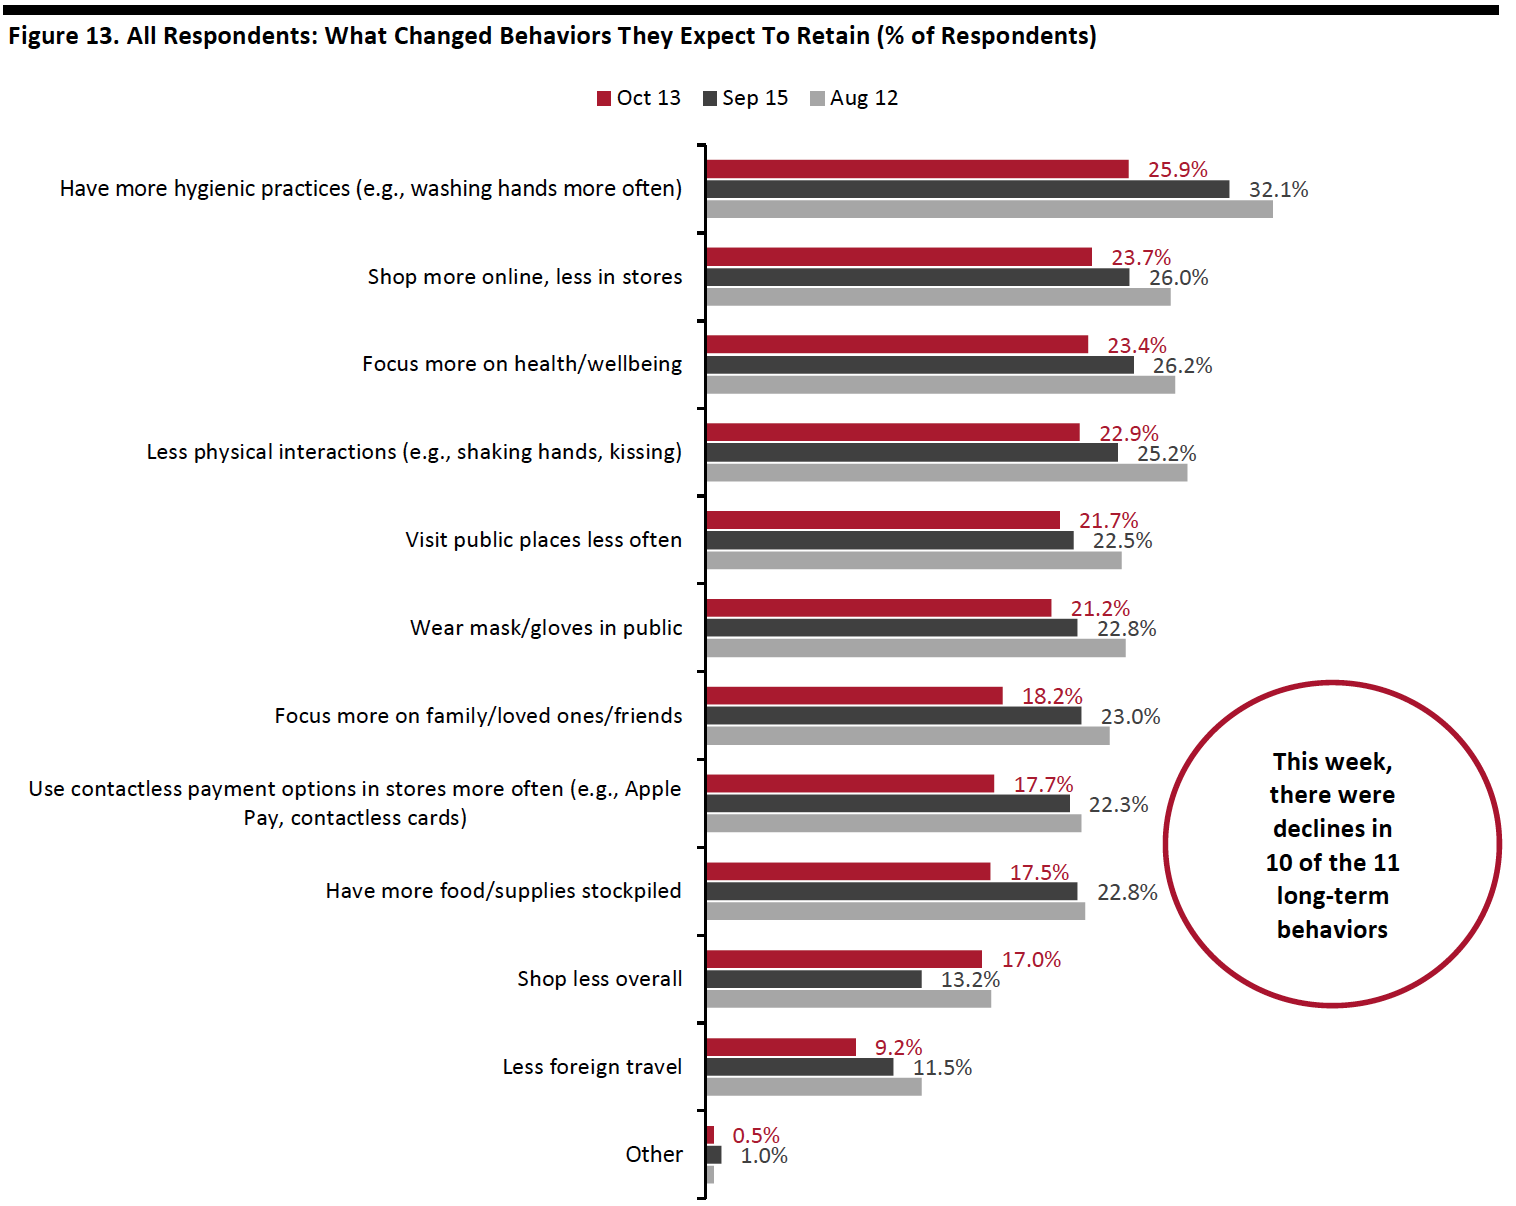 Respondents could select multiple options
Base: US respondents aged 18+
Source: Coresight Research[/caption]
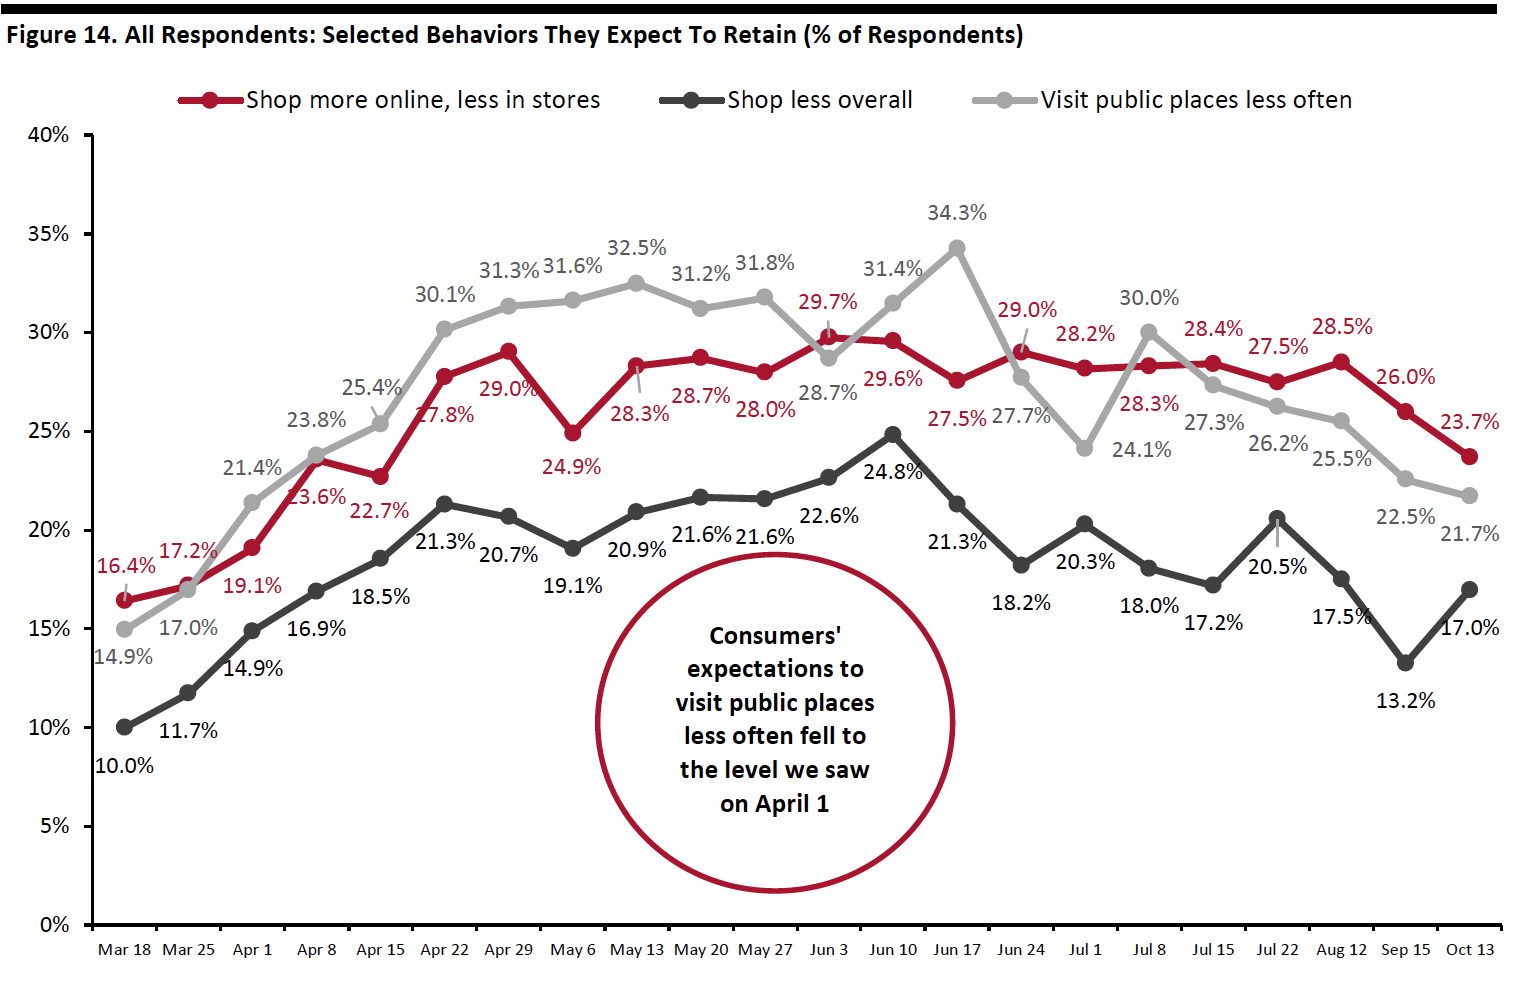
In the chart below, we show trended data in three of the metrics charted above, and the medium-term trends suggest increasing intentions to return to more normal ways of living and shopping, with all three metrics appearing to be well past their peak:
- Some 23.7% of respondents expect to shop more online, less in stores in the long term, versus 26.0% a month ago. This behavior has trended downward since peaking at almost 30% of respondents in early June.
- The proportion that expect to visit public places less often broadly leveled off month over month—Some 21.7% plan to retain such behavior, versus 22.5% last month. This behavior has fallen by 13 percentage points from the peak of 34.3% on June 17.
- Shopping less overall is the only behavior that saw a slight increase in the proportion of consumers expecting to retain the behavior (within the margin of error). Some 17.0% plan to do so in the long term, roughly the level we saw two months ago. The medium-term trend still looks to be downward, which is encouraging for the retail industry.
 Question not asked on July 29, August 5, August 19, August 26, September 2, September 9, September 15, September 22, September 29 or October 6
Base: US respondents aged 18+
Source: Coresight Research[/caption]
What We Think
Our survey results once again reflect that consumers plan to cut their overall holiday spending—over half said they expect to spend less for the holiday season compared to last year. Spending on services—such as gatherings, social events and travel, which are restricted due to the pandemic—is set to be hit the hardest. This could translate to opportunities for brands and retailers to gain some of consumers’ switched spending from services to products. In our Holiday 2020: US Shopper Survey, seven in 10 respondents reported that they expect to switch some spending from services to products. Reduced spending on services is one factor behind our estimate for a solid rise in total holiday-season retail sales.
We saw a meaningful decline in consumers’ expectation to spend less on clothing and footwear for the holidays—some 23.0% expect to spend less on this category, the lowest level we have seen since we starting asking this question. Clothing and footwear fell from third place to the bottom half among product categories for planned cutbacks. We expect to see improvement in apparel sales during the holiday season.
The 18-percentage-point difference between holiday shoppers who expect to shop early and those who expect to shop later during the season is a positive sign for brands and retailers. Mass merchants such as Target and Walmart, as well as some specialty retailers, have started their holiday deals in the past week to lock in sales early and ease strain on the e-commerce supply chain.
This week, we saw the following from our recurring weekly questions:
- Apparel: Clothing and footwear remained the most-cut category, and we saw a lower proportion of consumers buying more apparel this week than before the crisis. However, we saw apparel became the third-most-purchased product category online, with around 28% currently buying more apparel online than pre-crisis. In addition, some 33.9% had bought clothing or footwear online in the past two weeks. The proportion that had bought apparel in-store stayed consistent at around 23%.
- Online Grocery: We have seen fluctuations in online purchases of grocery in the past couple of weeks. This week, around three in 10 respondents said they had bought grocery online, broadly level with last week’s findings. However, we saw the proportion of consumers that are buying more food online than before the pandemic fall by almost six percentage points to one-fifth, from over one-quarter last week. For more data on the trajectory of grocery e-commerce, see our latest monthly US CPG Sales Tracker.
- E-Commerce: Consumer expectations to retain the habit of buying more online dropped slightly to 23.7% from a month ago; the medium-term trend for this behavior is downward, after peaking in early June. We also found a near-identical percentage of holiday shoppers expecting to switch some spending to e-commerce this year. The proportion of consumers currently buying more online than pre-crisis was at a much more substantial level of 68.3%, suggesting potential for greater shift to e-commerce as we are entering the holiday season. We expect holiday-quarter online sales to rise by around 31% year over year. See our Holiday 2020: US Shopper Survey for more data on consumers’ holiday shopping expectations, and US E-Commerce: Post-Crisis Outlook report for more e-commerce data and analysis.
Methodology
We surveyed respondents online on October 13 (401 respondents), October 6 (416 respondents), September 29 (412 respondents), September 22 (422 respondents), September 15 (408 respondents), September 9 (406 respondents), September 2 (402 respondents), August 26 (414 respondents), August 19 (416 respondents), August 12 (400 respondents), August 5 (449 respondents), July 29 (403 respondents), July 22 (404 respondents), July 15 (454 respondents), July 8 (410 respondents), July 1 (444 respondents), June 24 (411 respondents), June 17 (432 respondents), June 10 (423 respondents), June 3 (464 respondents), May 27 (422 respondents), May 20 (439 respondents), May 13 (431 respondents), May 6 (446 respondents), April 29 (479 respondents), April 22 (418 respondents), April 15 (410 respondents), April 8 (450 respondents), April 1 (477 respondents), March 25 (495 respondents) and March 17–18 (1,152 respondents). The most recent results have a margin of error of +/- 5%, with a 95% confidence interval. Not all charted week-over-week differences may be statistically significant.