
albert Chan
What’s the Story?
This report presents the results of Coresight Research’s latest weekly survey of US consumers on the coronavirus outbreak, undertaken on July 22, 2020. We explore the trends we are seeing from week to week, following prior surveys on July 15, July 8, July 1, June 24, June 17, June 10, June 3, May 27, May 20, May 13, May 6, April 29, April 22, April 15, April 8, April 1, March 25 and March 17–18.
What Shoppers Are Doing and Where They Are Going
Almost Nine in 10 Are Currently Avoiding Public Places
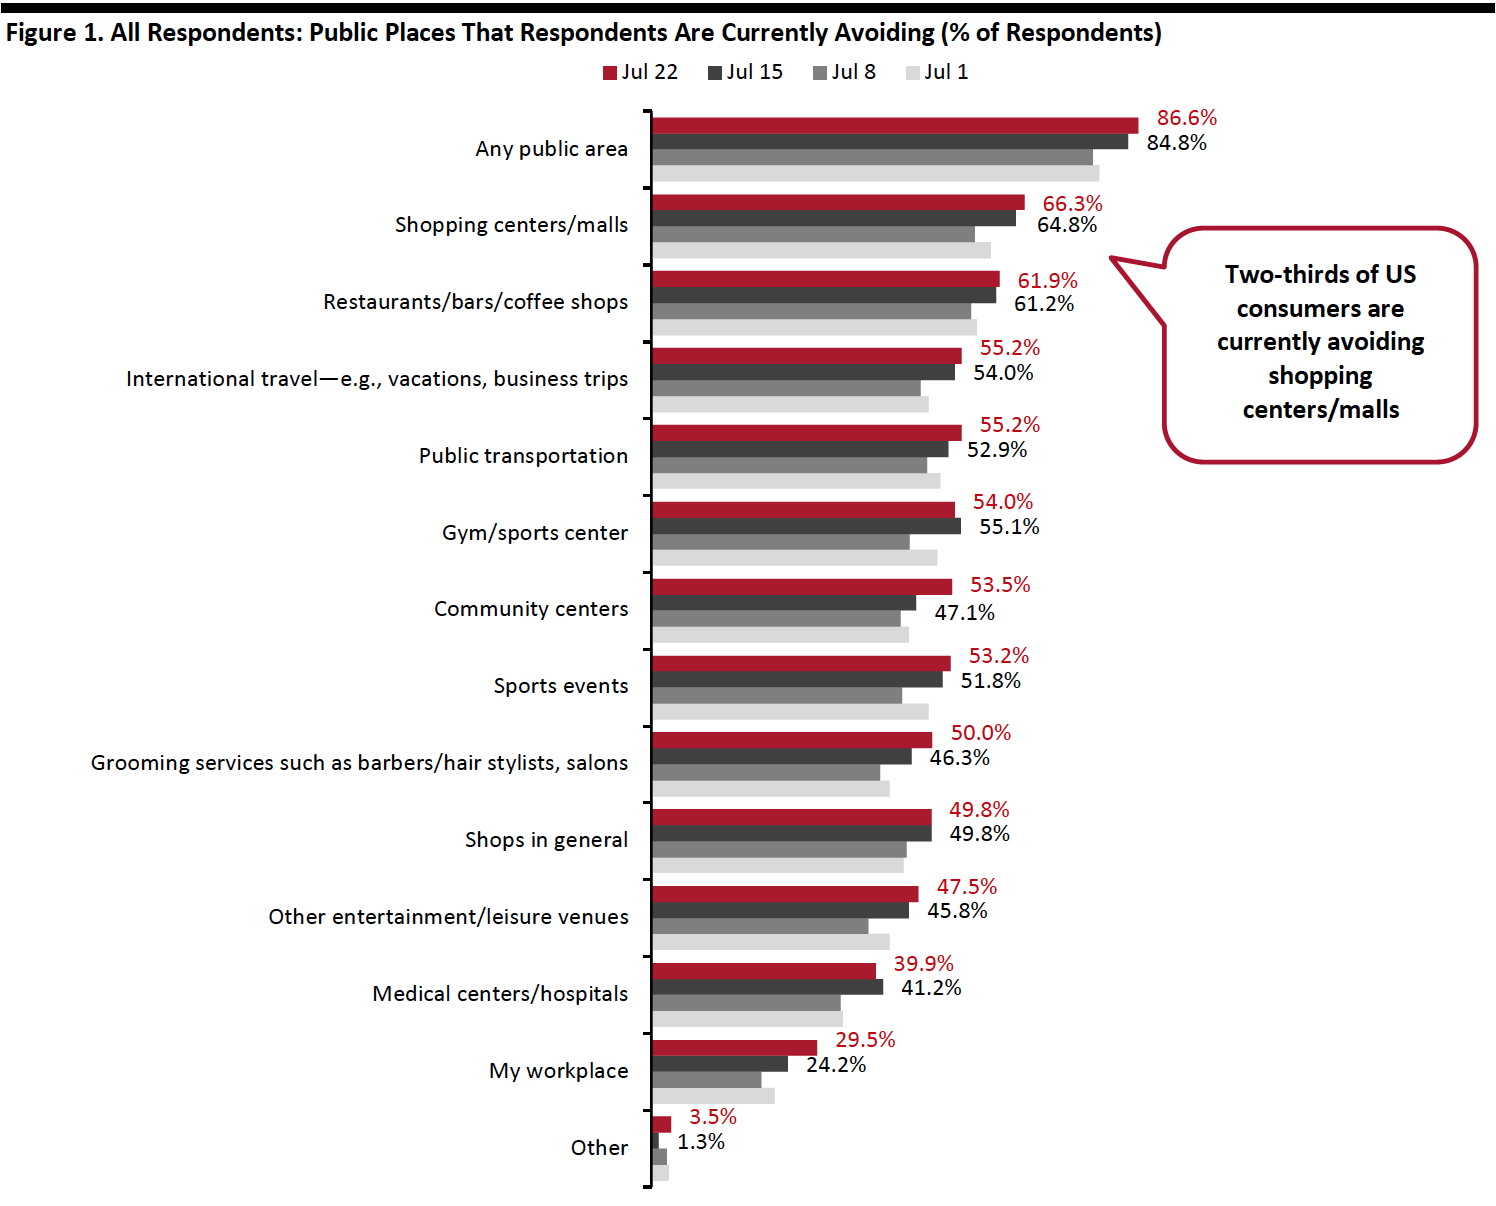
This week, we saw 86.6% of respondents saying they are avoiding any public area, roughly in line with the result from last week which had spiked six percentage points—showing a near-consistent upward trend since the first week of July. Along with consumers’ increased wariness, the high avoidance rate could reflect reversals in reopenings due to the resurgence of coronavirus cases in a growing number of states.
We saw week-over-week increases of avoidance in most of the 14 options provided:
- The proportion of respondents that are currently avoiding shopping centers/malls went up slightly this week, after a seven-percentage-point jump last week. Two-thirds said they are currently avoiding these, versus 64.8% from last week.
- Food-service locations are the second-most-avoided public places, with 61.9% of respondents currently doing so, broadly level with the proportion last week.
- The proportion of respondents that are currently avoiding shops in general is consistent with last week, with 49.8% saying they are doing so.
- Workplaces saw the highest jump in avoidance rate this week, of five percentage points, suggesting that people continue to work from home.
 Respondents could select multiple options
Base: US Internet users aged 18+
Source: Coresight Research[/caption]
Slightly More Consumers Went to Food-Service Locations in the Past Two Weeks
Each week, we ask consumers what they have done in the past two weeks. This week, we saw increases in the proportions of respondents for half of the 16 options we provided for activities done recently—although each was within the margin of error.
- The proportion of respondents who had bought apparel online in the past two weeks fell slightly but continues to hover around the one-third level that we have seen in the past few weeks. Some 18.8% had bought apparel in a store, compared to one-fifth last week.
- We saw the proportions of respondents that had visited an open-air shopping center decline to a new low of 11.9% this week, close to the proportion who had visited an enclosed shopping mall. Spelling bad news to mall owners, the low absolute percentages in both activities reflect that consumers are limiting their visits to shopping centers in general, which align with the reported high avoidance rates.
- The proportion of respondents who had gone to food-service locations—including restaurants and bars—in the past two weeks bounced back to prior levels after reaching the lowest levels last week. Almost one-quarter dined in a restaurant, versus 21.8% last week. While the proportion of respondents who had gone to a bar remained low, it did rise slightly—by three percentage points week over week.
- Online grocery shopping continues to maintain its appeal. The proportion of respondents who had bought groceries online broadly leveled off at around three in 10 this week.
Respondents could select multiple options Base: US Internet users aged 18+ Source: Coresight Research
More Consumers Expect To Do Some Non-Shopping Activities in the Next Two Weeks
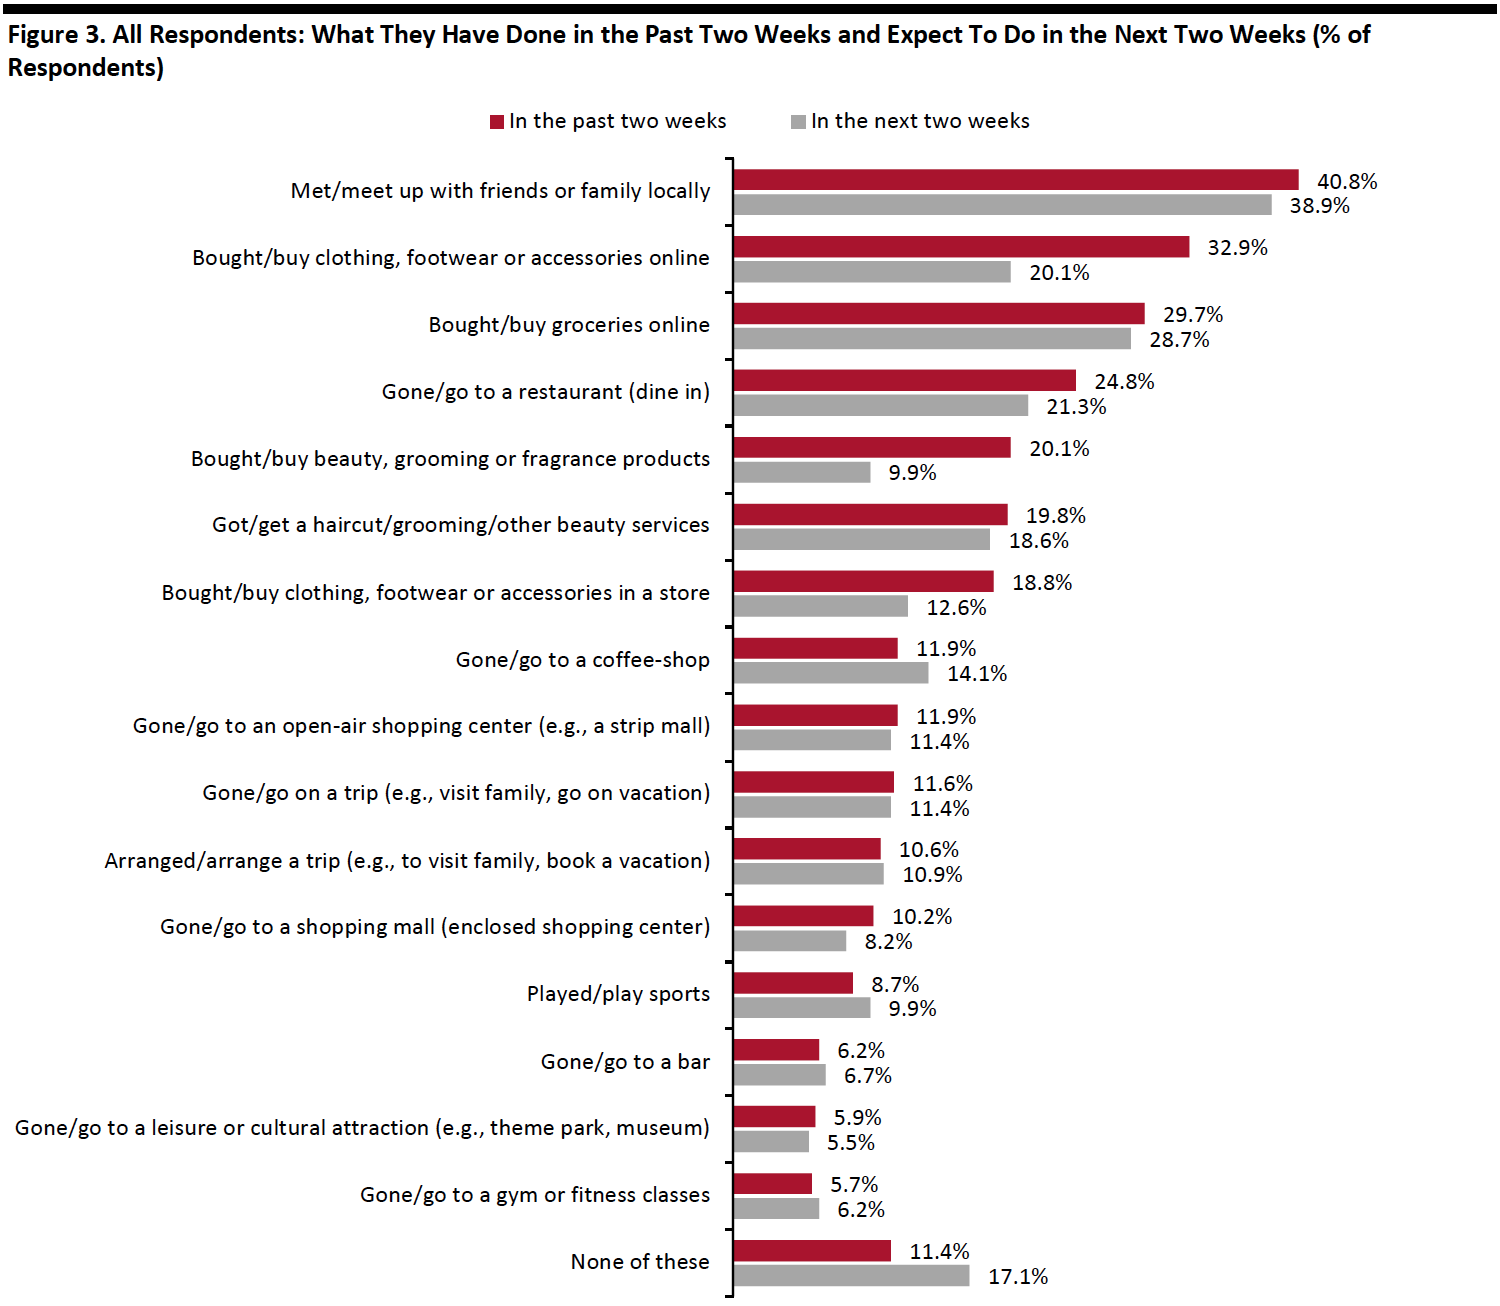
Each week, we also ask consumers what they expect to do in the next two weeks, with a comparable set of options to those for the last two weeks. In the chart below, we compare these short-term expectations with recent actual behavior.
We saw slightly higher proportions of consumers expecting to do a few non-shopping activities in the next two weeks than actual behavior in the past two weeks:
- Some 14.1% expect to go to a coffee shop in the next two weeks, up from 11.9% of those who had done so in the previous two weeks. The proportion of consumers who plan to dine in a restaurant, however, went down slightly to 21.3%.
- One in 10 plan to play sports in the next two weeks, versus 8.7% that had done so in the past two weeks.
We have seen a consistent pattern of lower expectations to do shopping-related activities than actual recent behaviors in our weekly surveys, which is likely due in part to some discretionary purchases not being planned in advance by consumers.
- Expectations of buying groceries online remain relatively strong, with 28.7% expecting to buy, very close to the 29.7% that had bought.
- Some 20.1% expect to buy clothing or footwear online in the next two weeks, versus 12.6% planning to do so in a store.
- Avoidance of public places, including shopping centers/malls, continued to rise, aligning with what we showed earlier, suggesting lower traffic and purchasing in stores.
 Respondents could select multiple options
Base: US Internet users aged 18+
Source: Coresight Research[/caption]
Reviewing Trend Data in Current Purchasing Behavior
What Consumers Are Currently Buying More Of and Less Of
The proportion of respondents who are currently buying more of any category remained stable at around 61% this week. However, we noticed a meaningful decline of seven percentage points in the proportion of respondents who are currently buying less, from 54.2% to 47.3%—the lowest level we have seen in the past couple of weeks.
- Buying more of certain categories and buying less of certain categories were not mutually exclusive options, so respondents could answer yes to both.
Buying more: Essentials, including household products and food, continue to top the list of buying more. The proportion of consumers buying food slid slightly to 30.9%, versus 33.7% last week.
Buying less: The proportions of respondents buying less in discretionary categories have been fluctuating in the past few weeks. We saw slight declines in all of the discretionary categories tracked in Figure 5. Some 27.0% are currently spending less on apparel, which is the most-cut category, versus three in 10 last week. This is followed by beauty, with 18.3% currently buying less. Some 14.6% are buying less home products, the lowest level of buying less in the category since we started asking the question.
Ratio of less to more: The ratios of the proportions of respondents buying less to the proportions buying more in apparel and electronics slid this week: The ratio for apparel was 2.5 this week, versus 2.8 last week; and the ratio for electronics stood at 1.8, down from 2.1 last week. On the contrary, the ratio for beauty and home jumped this week: The ratio for beauty came in at 2.2, up from 1.7 last week; and the ratio for home went up to 2.4 from 2.0 last week.
[caption id="attachment_113452" align="aligncenter" width="700"]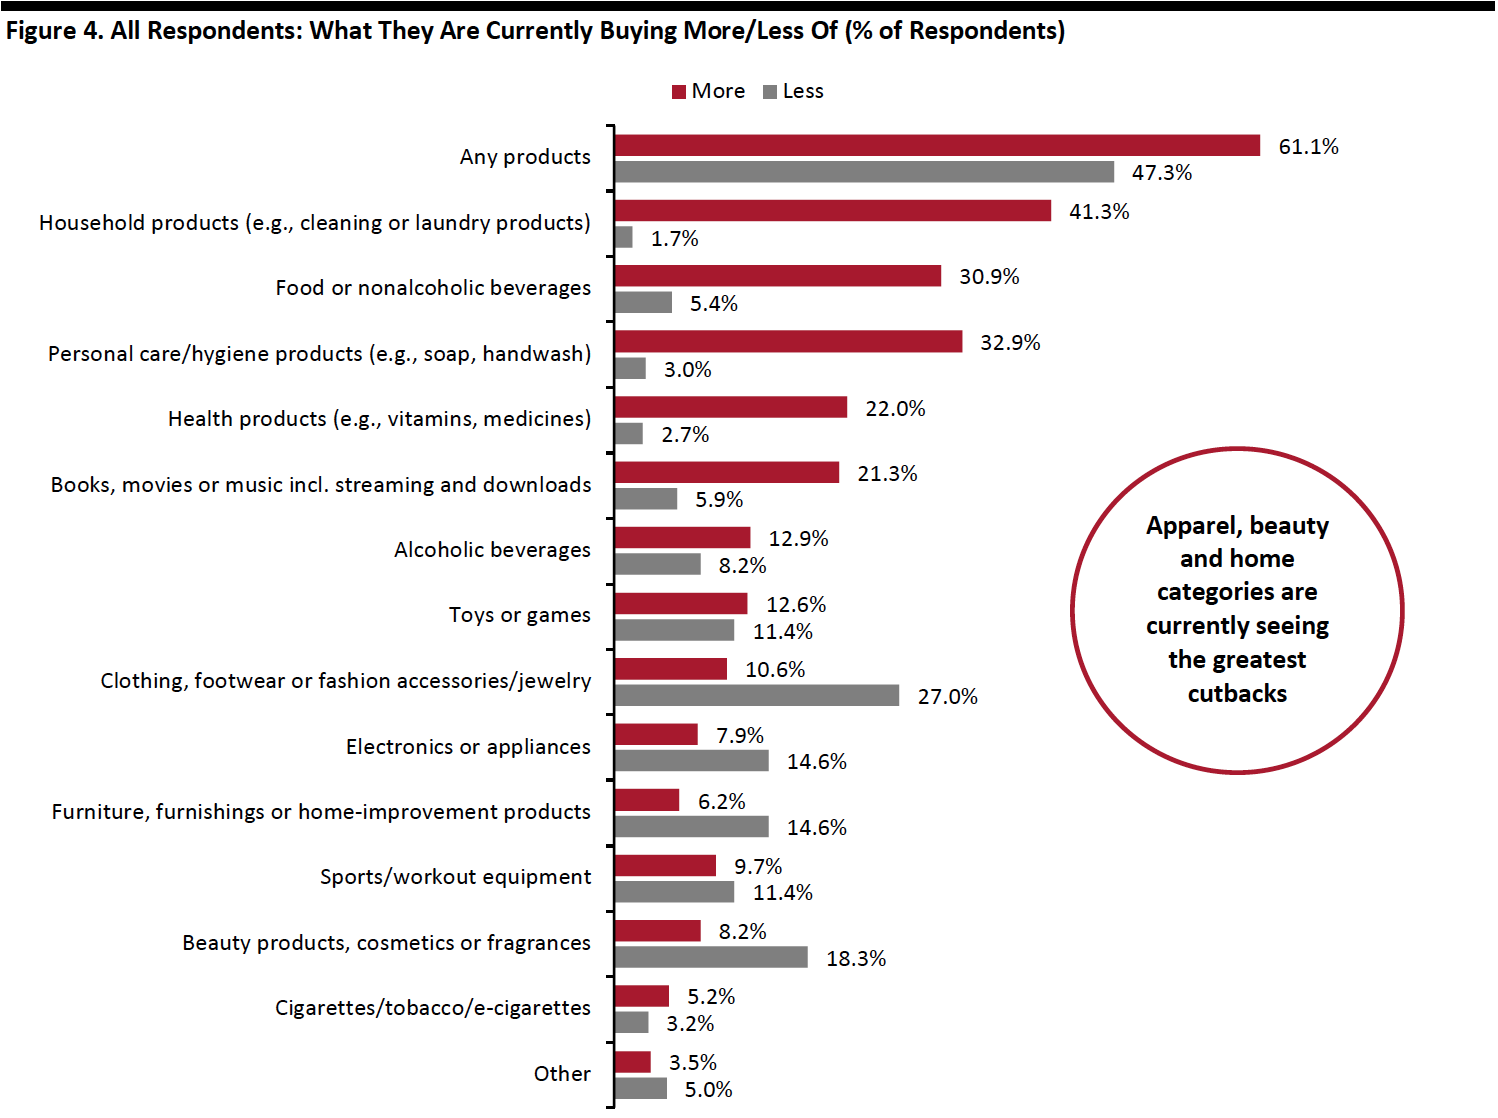 Respondents could select multiple options
Base: US Internet users aged 18+
Source: Coresight Research[/caption] Figure 5. All Respondents: Buying More/Less of Selected Categories (% of Respondents) [wpdatatable id=344]
Base: US Internet users aged 18+ Source: Coresight Research
Over Seven in 10 Are Switching Spending Online
The proportion of consumers switching their spending to e-commerce remained stable this week. Some 71.0% of consumers stated that they are buying more online this week, versus 72.0% last week. This trend seemed to plateau, despite the increased avoidance of public places noted earlier.
[caption id="attachment_113453" align="aligncenter" width="700"]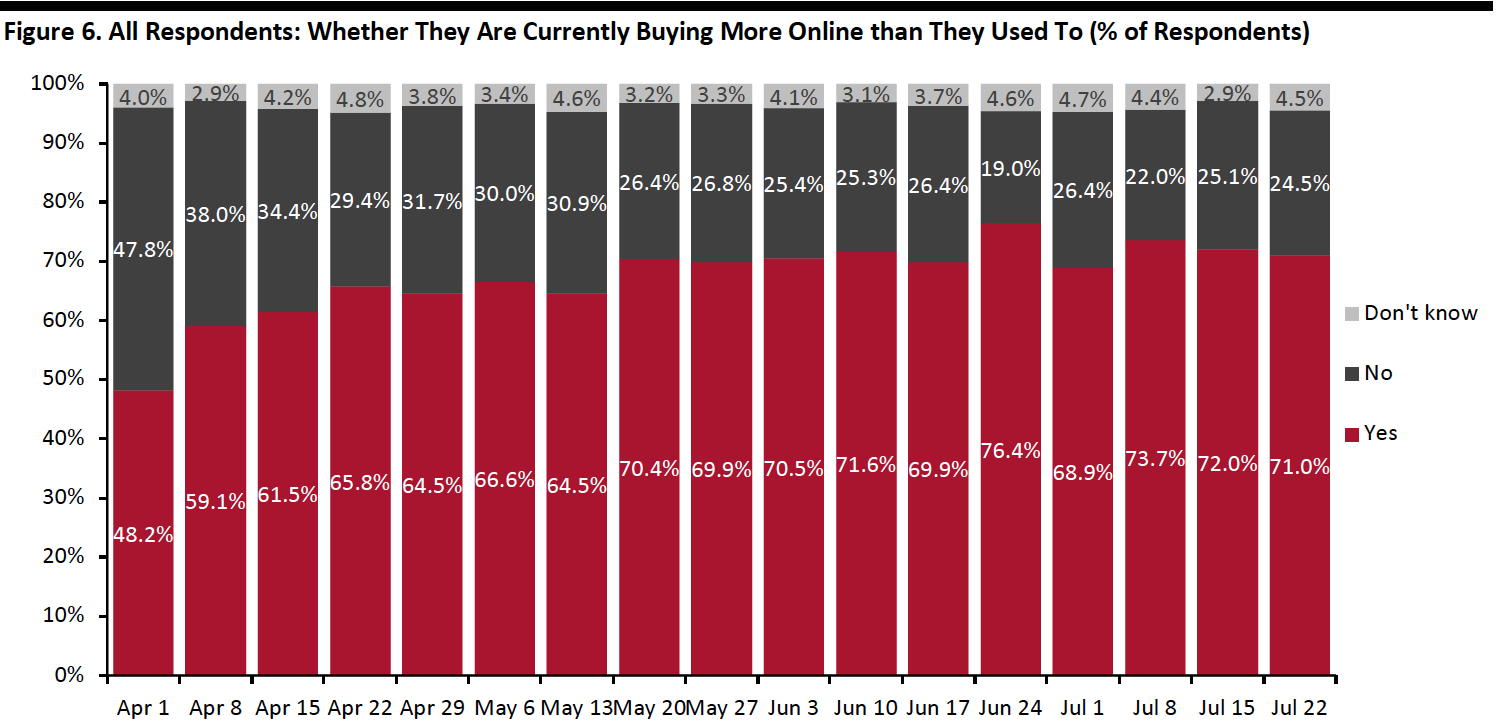 Base: US Internet users aged 18+
Source: Coresight Research[/caption]
What Consumers Are Currently Buying More Of Online
This week, the week-over-week changes in the proportions of consumers that are currently buying more online than they used to in essential product categories are minimal. Consumers continue to purchase household and personal care products the most online.
Apparel, which saw the largest jump of five percentage points, became the third-most-purchased category online this week. Some 31.4% are currently buying more apparel online, up from 26.2% last week. We have seen the proportion increase by around 22 percentage points since we started asking the question in the week of April 1. The rate this week is also almost aligned with the proportion of respondents who had shopped apparel online in the past two weeks, noted earlier.
Other discretionary categories—including beauty and home—saw slight declines this week: Some 15.8% are currently buying more beauty online than they used to, versus 17.4% last week; and one in 10 are buying more home products, compared to 11.7% last week.
[caption id="attachment_113454" align="aligncenter" width="700"]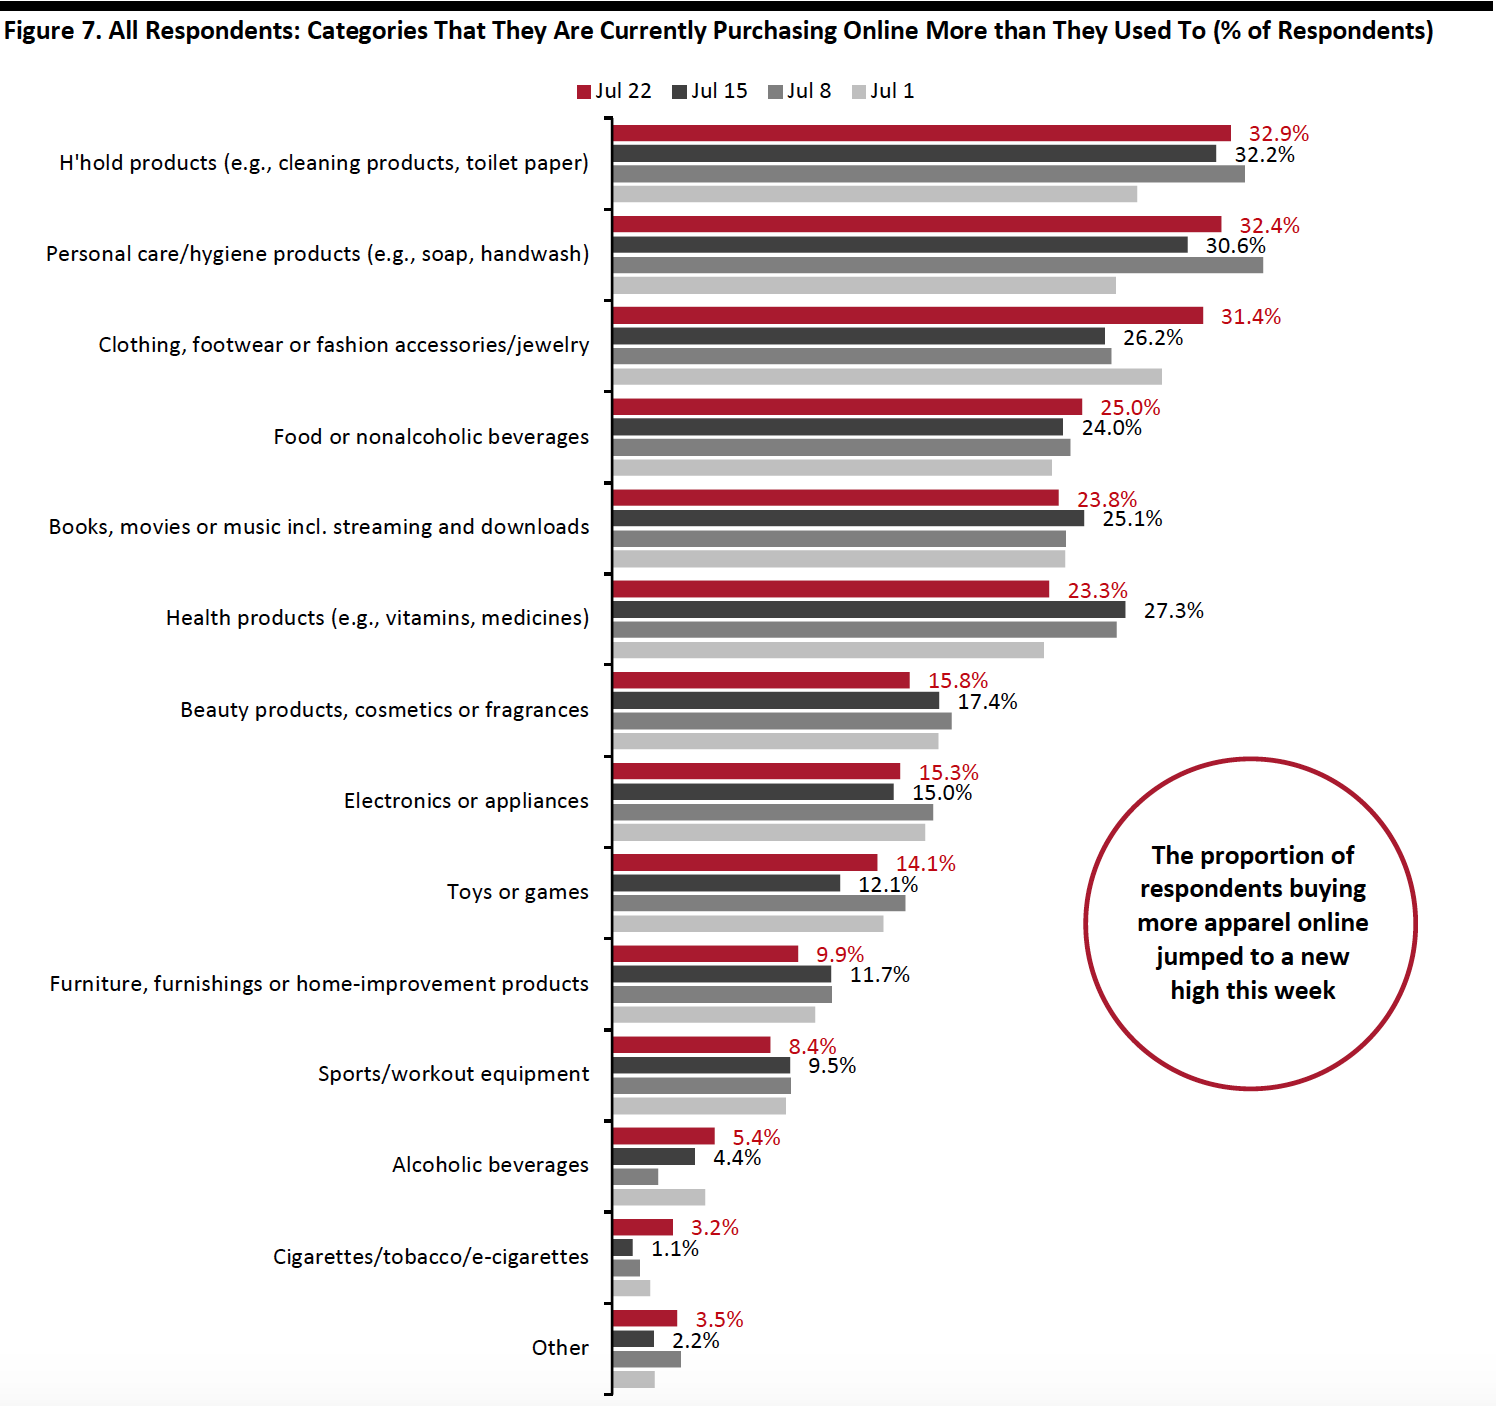 Respondents could select multiple options
Base: US Internet users aged 18+
Source: Coresight Research[/caption]
Fewer than Six in 10 Expect To Retain Changed Behaviors over the Long Term
Each week, we ask respondents whether they think they will keep some of the behaviors they have adopted during the coronavirus crisis. The proportion of respondents expecting to retain some changed behaviors dropped this week to 54.7%, after plateauing over the past couple of weeks. The near-consistent downward trend we have seen since the week of June 10 suggests that this trend is past its peak and consumers are slightly more willing to return to their regular activities than they expected to before.
[caption id="attachment_113455" align="aligncenter" width="700"]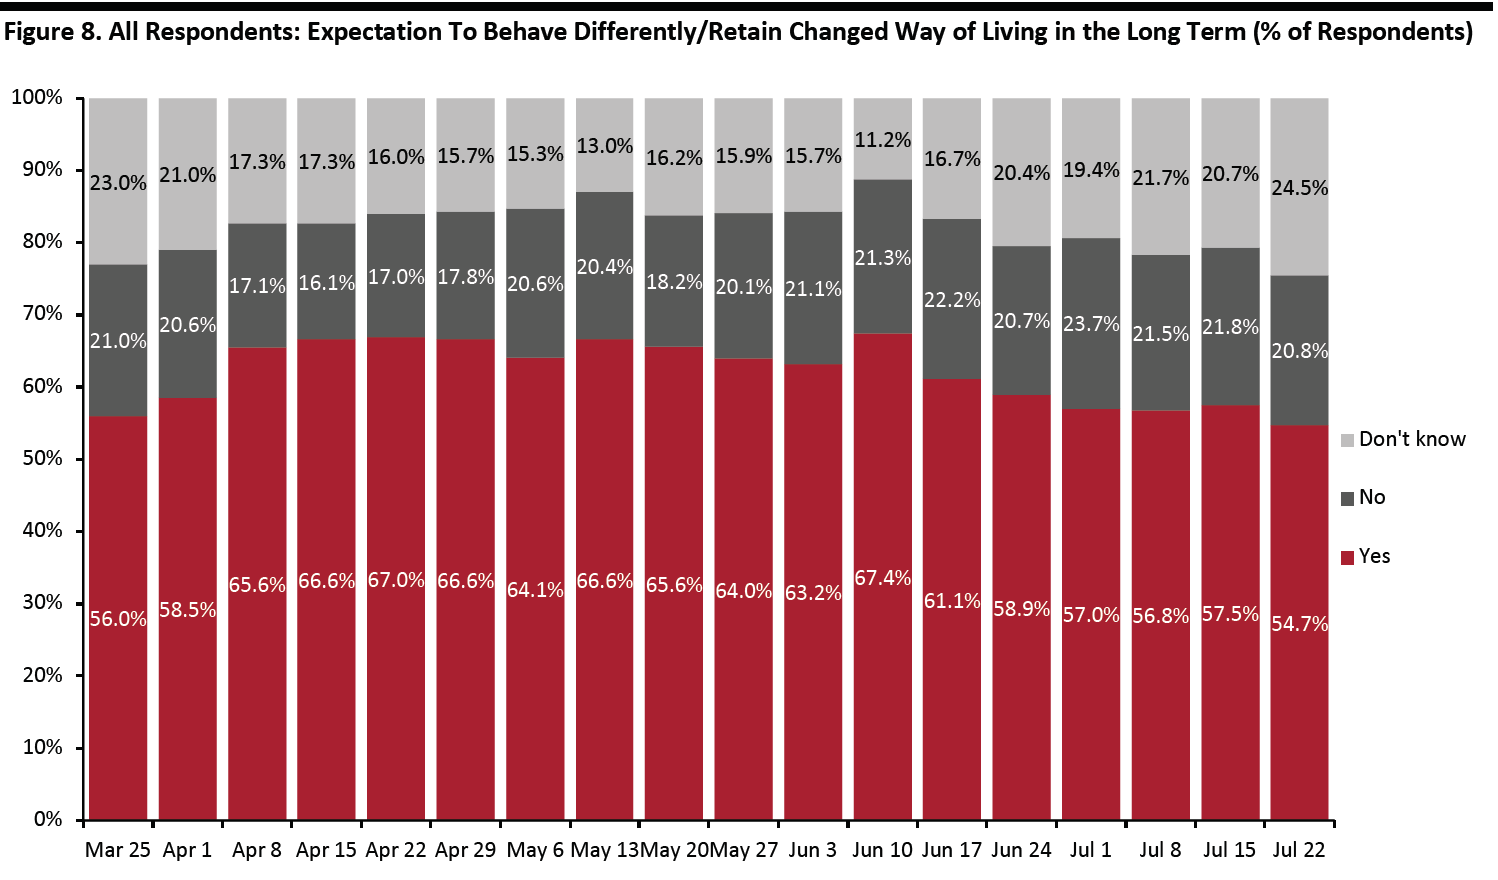 Base: US Internet users aged 18+
Source: Coresight Research[/caption]
Among those expecting to retain changed behaviors, we noticed the largest increase in the proportion of respondents expecting to have less physical interactions, which jumped back to the level we saw two weeks ago. Some 56.6% expect to do so in the long term, up from 48.7% last week.
The proportion of respondents expecting to have more hygiene practices and have more food stockpiled both increased by around six percentage points this week.
We saw a decline in the proportion of respondents expecting to wear masks/gloves in public this week, with 43.0% expecting to retain this behavior in the long term, down from almost half last week.
The proportion of respondents expecting to use contactless payment options in stores more often than they did previously continued to moderate this week, at 40.7%.
[caption id="attachment_113456" align="aligncenter" width="700"]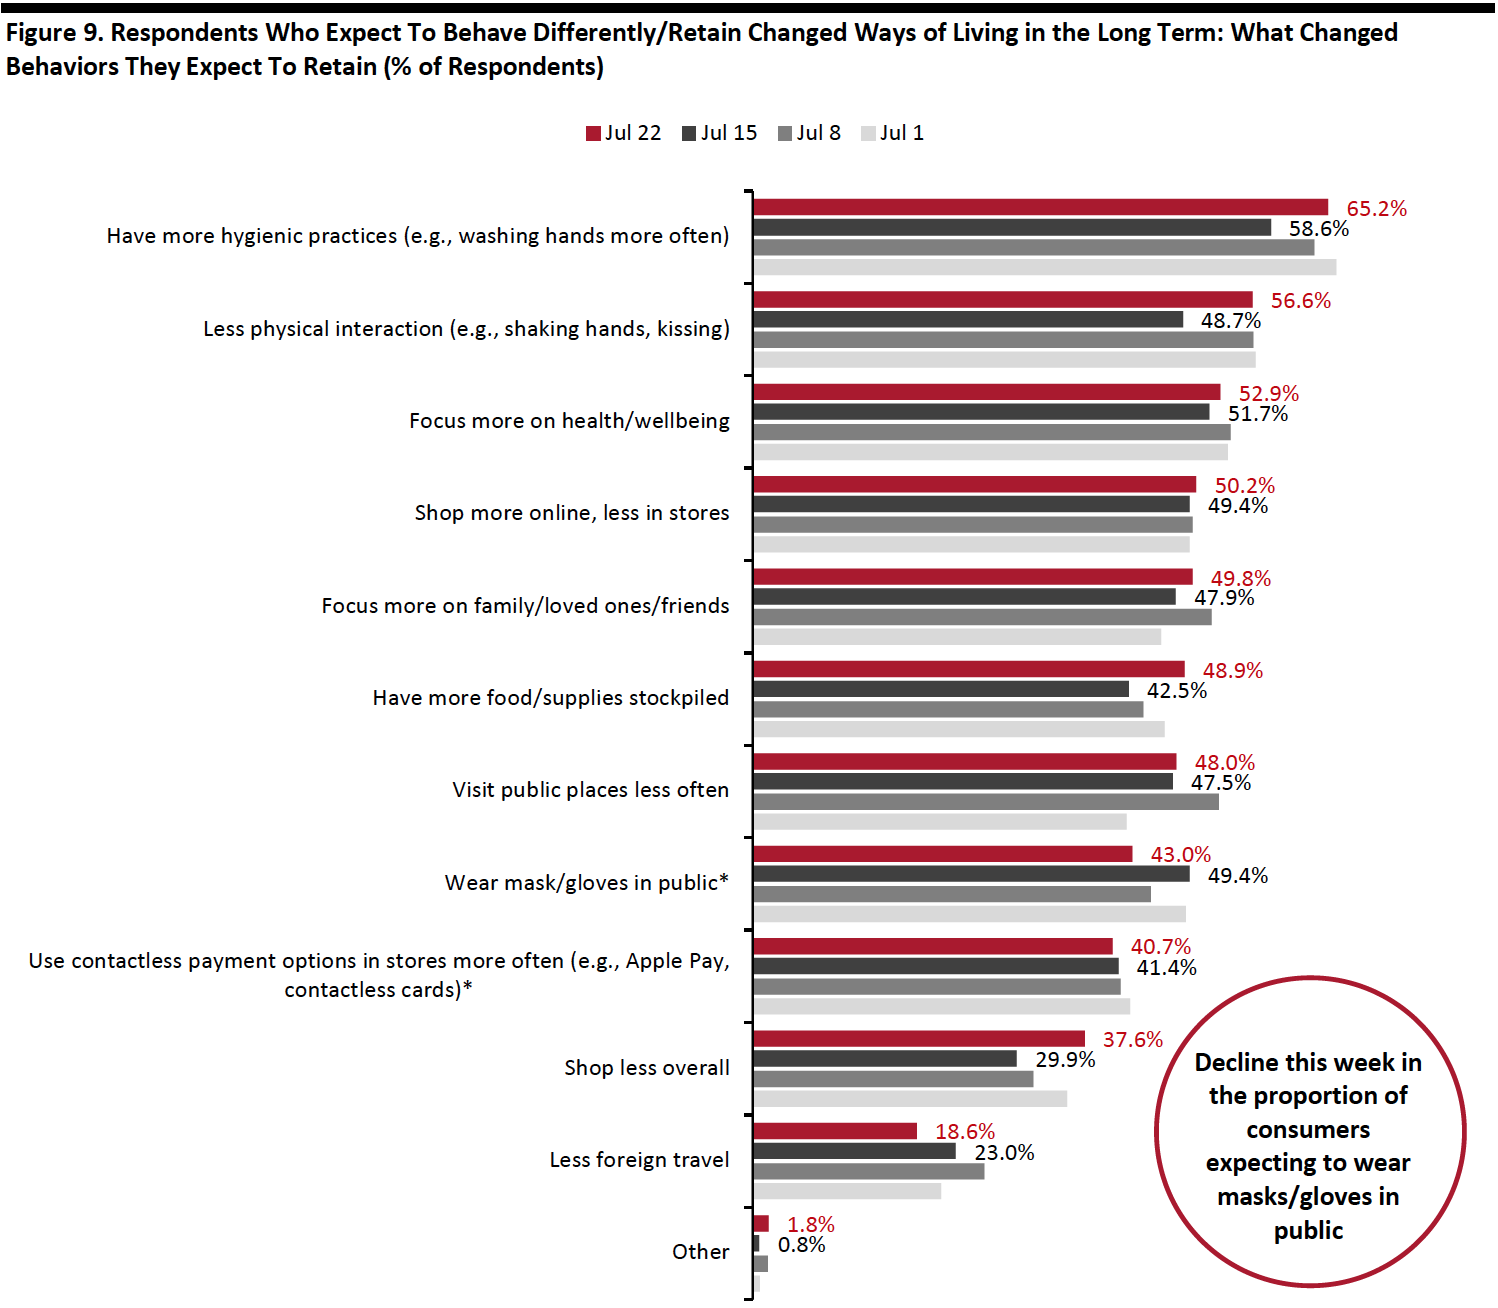 Respondents could select multiple options
Base: US Internet users aged 18+ who expect to behave differently in the long term/retain changed ways of living from the outbreak
Source: Coresight Research[/caption]
In the chart below, we show trended data in three of the metrics charted above. We represent these as a proportion of all respondents, to represent consumers overall, rather than as a proportion of those expecting to retain changed behaviors (which is what is charted above).
Rebased to all respondents, we saw a spike in the proportion who expect to shop less overall this week, though still below the peak reached in the week of June 10. One-fifth expect to do so this week, compared to 17.2% last week.
The proportion of respondents who expect to visit public places less often decreased slightly this week, to 26.2% from 27.3% last week.
The proportion of consumers expecting to shop more online in the long term has broadly leveled off in recent weeks, at around 28%.
[caption id="attachment_113457" align="aligncenter" width="700"]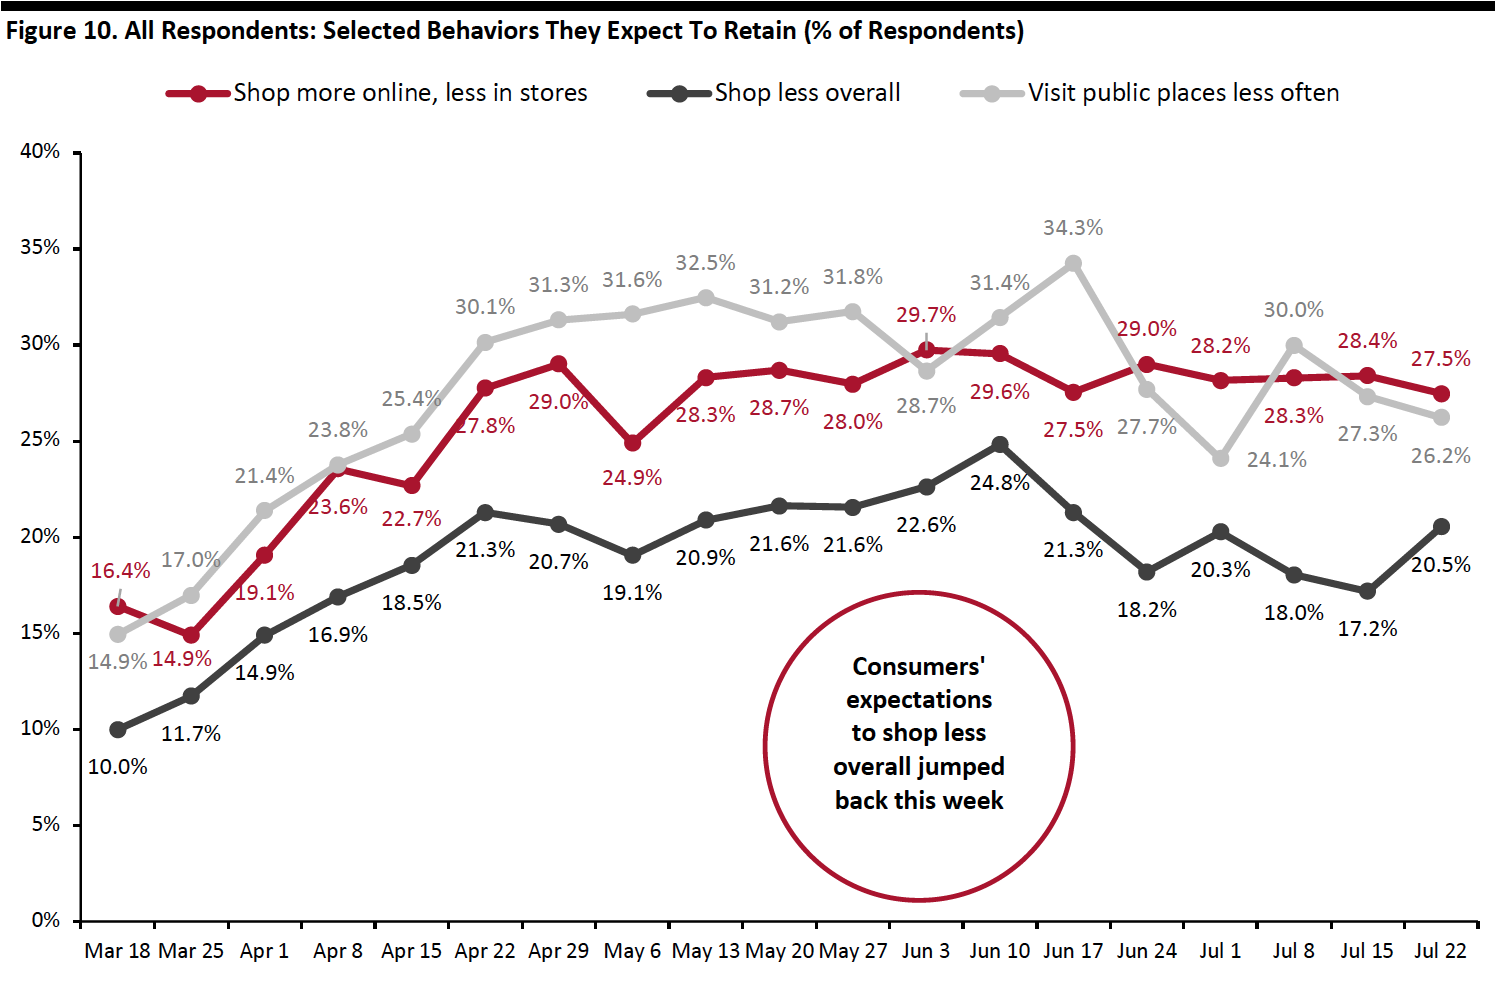 Base: US Internet users aged 18+
Source: Coresight Research[/caption]
Methodology
We surveyed respondents online on July 22 (404 respondents), July 15 (454 respondents), July 8 (410 respondents), July 1 (444 respondents), June 24 (411 respondents), June 17 (432 respondents), June 10 (423 respondents), June 3 (464 respondents), May 27 (422 respondents), May 20 (439 respondents), May 13 (431 respondents), May 6 (446 respondents), April 29 (479 respondents), April 22 (418 respondents), April 15 (410 respondents), April 8 (450 respondents), April 1 (477 respondents), March 25 (495 respondents) and March 17–18 (1,152 respondents). The most recent results have a margin of error of +/- 5%, with a 95% confidence interval. Not all charted week-over-week differences may be statistically significant.