
albert Chan
What’s the Story?
This report presents the results of Coresight Research’s latest weekly survey of US consumers, including on the impacts of the coronavirus outbreak, undertaken on September 2, 2020. We explore the trends we are seeing from week to week, following prior surveys on August 26, August 19, August 12, August 5, July 29, July 22, July 15, July 8, July 1, June 24, June 17, June 10, June 3, May 27, May 20, May 13, May 6, April 29, April 22, April 15, April 8, April 1, March 25 and March 17–18.
What Shoppers Are Doing and Where They Are Going
Eight in 10 Are Currently Avoiding Public Places
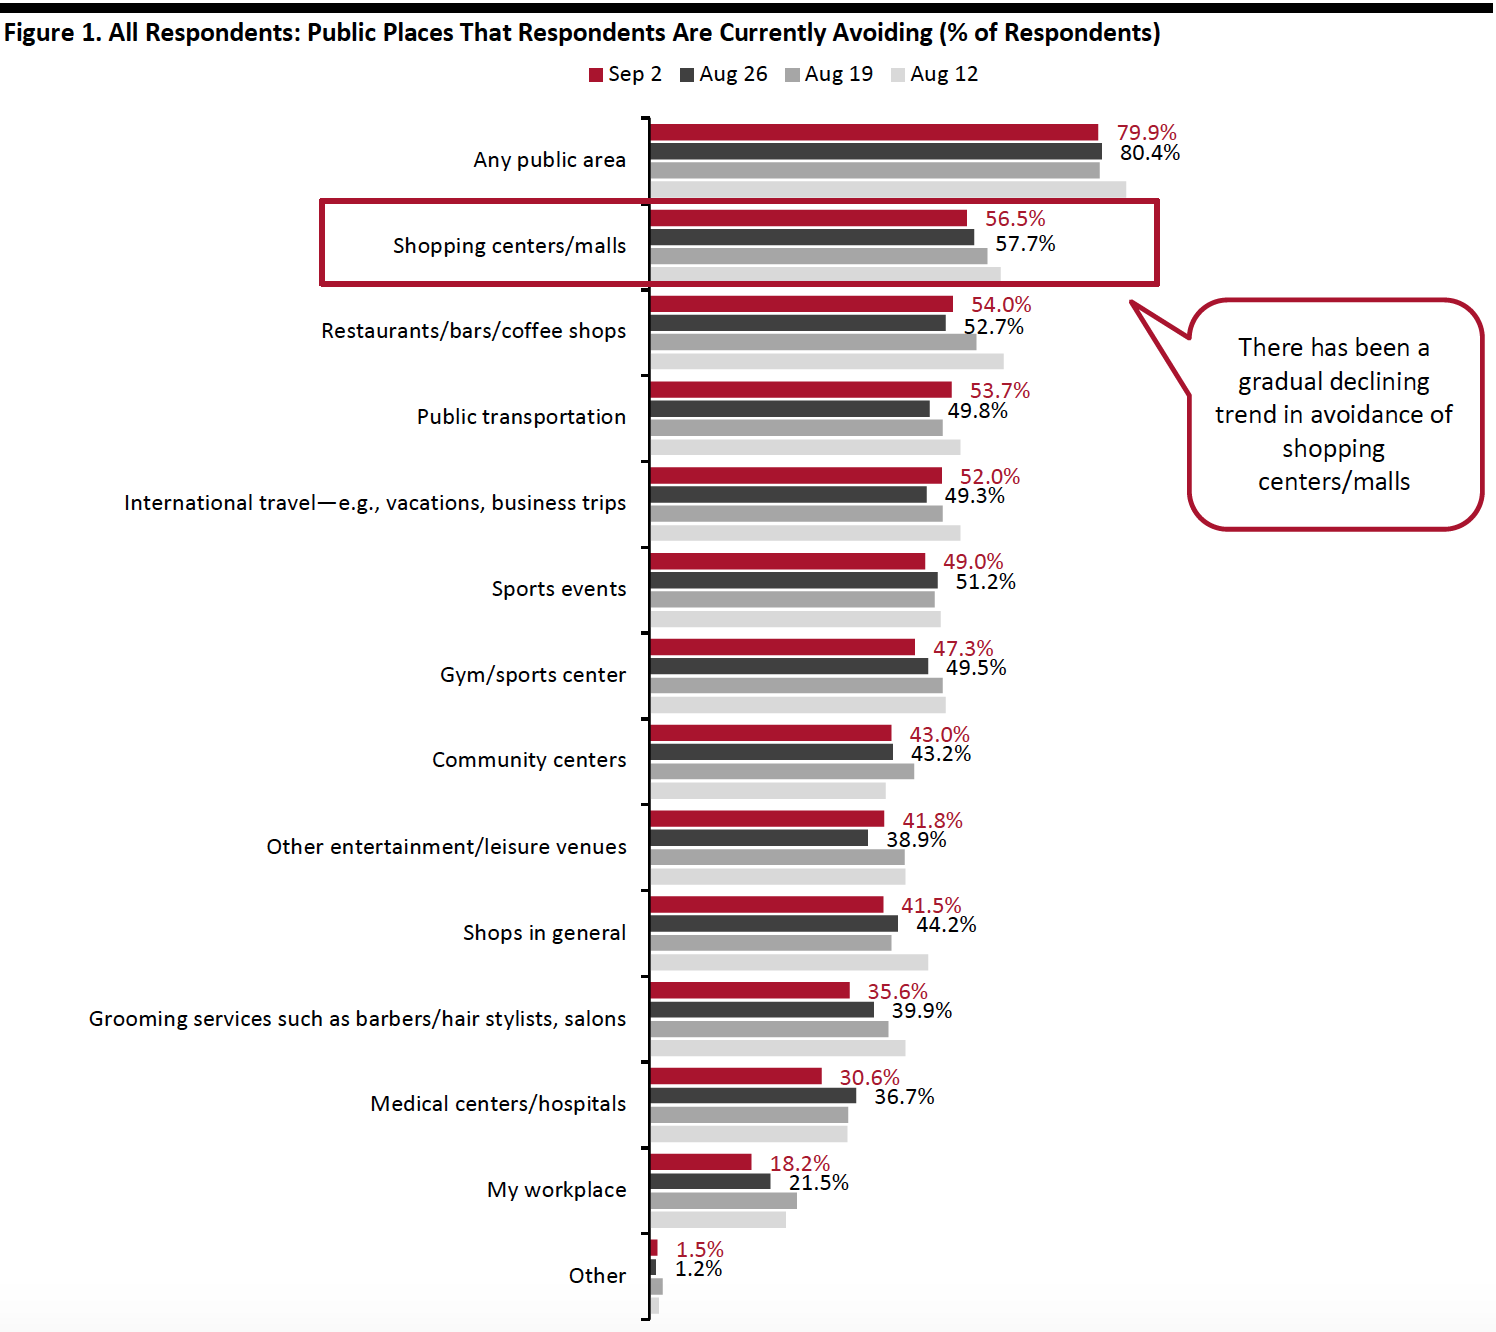
This week, the proportion of respondents saying that they are avoiding any type of public area was broadly level with that from last week, at around 80%.
We saw a slight decrease in avoidance for seven of the 12 options provided, although most of the changes were within the margin of error:
- The proportion of respondents that are currently avoiding shopping centers/malls fell slightly for the third consecutive week to 56.5%, versus 57.7% last week—although this change was within the margin of error. Encouragingly for shopping centers, the avoidance rate has dropped roughly 10 percentage points from the peak of two-thirds on July 22. The rate this week is also the lowest level we have seen since July.
- The proportion of respondents that are currently avoiding food-service locations bounced back very slightly, after declining last week to the lowest level in months. Some 54.0% are currently avoiding restaurants, bars and coffee shops, versus 57.7% last week. This rate is still considered low, compared to the levels in July and the beginning of August.
- Avoidance in personal grooming services has also been seeing a declining trend in the past few weeks, with 35.6% currently avoiding grooming services, compared to four in 10 last week. This is aligned with our finding that an increasing proportion of consumers are willing to get a haircut compared to the previous survey.
 Respondents could select multiple options
Base: US Internet users aged 18+
Source: Coresight Research[/caption]
Online Grocery Shopping Tapers Off This Week
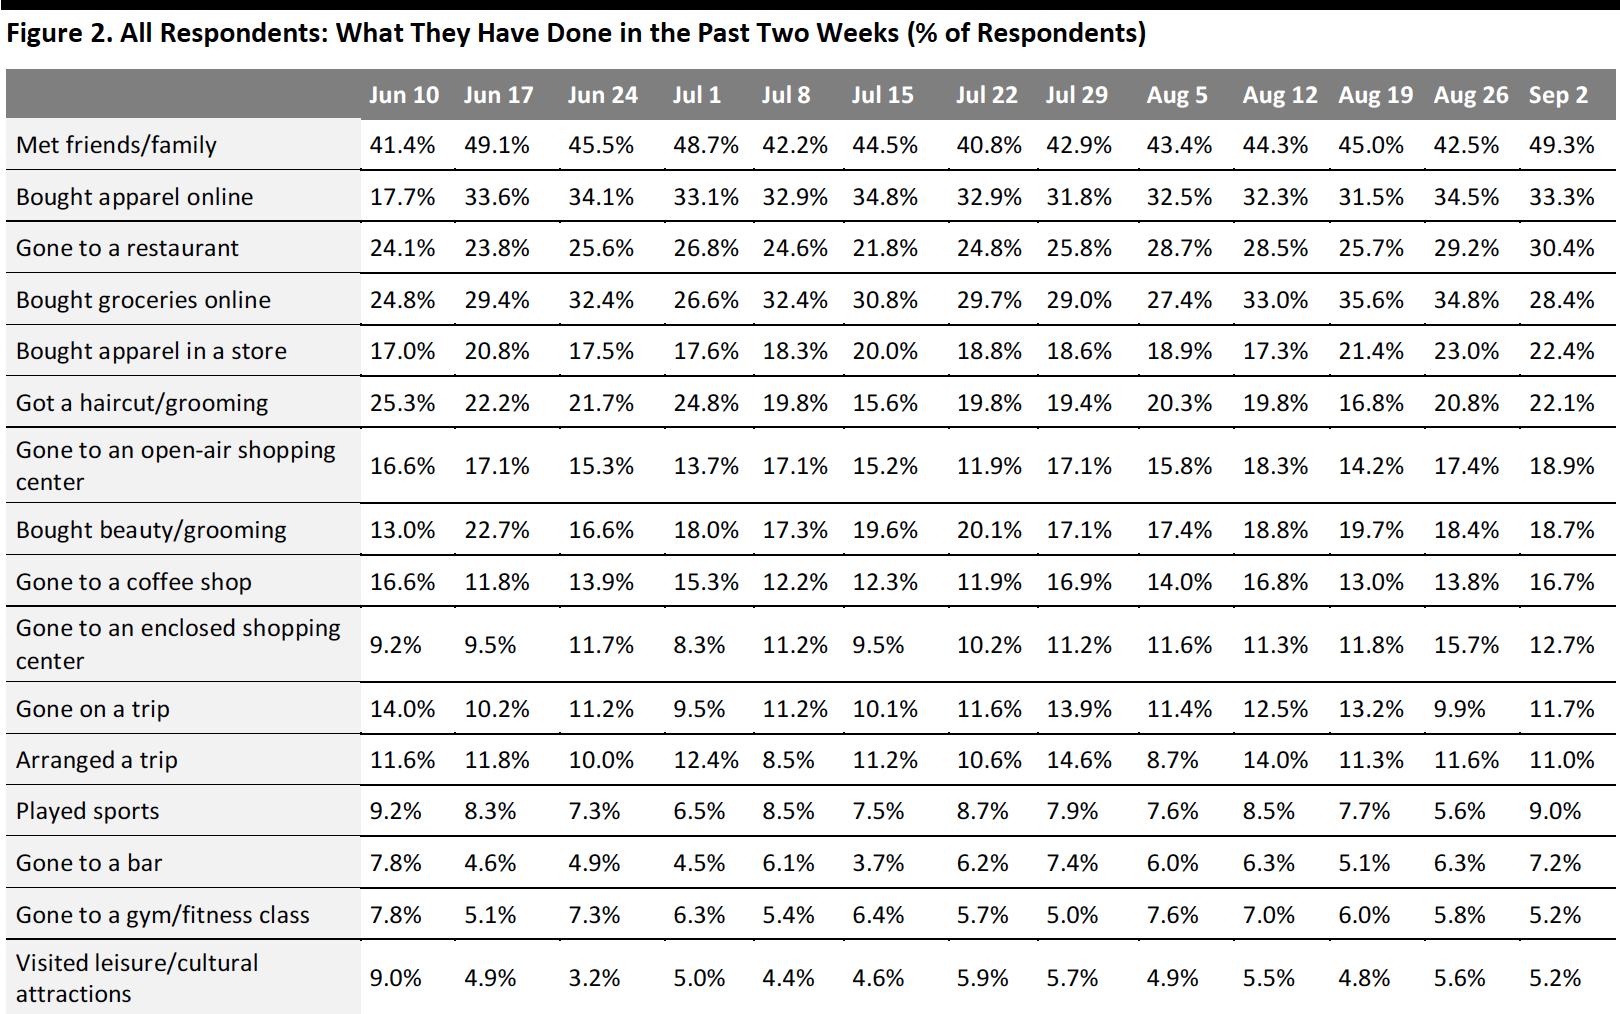
Each week, we ask consumers what they have done in the past two weeks. This week, the proportion of respondents increased for approximately half of the 16 options we provided for recent activity options—although most changes were within the margin of error.
- Online grocery shopping tapered off after reaching a peak in recent weeks. The proportion of respondents that bought groceries online dropped six percentage points to 28.4%, down from 34.8% last week. After taking the number-one spot for the past three weeks, this decline shifted online grocery shopping down to the third place among popular spending activities. The decline is aligned with the decreasing trend in consumers buying more food online than before the pandemic, which we discuss later in this report.
- One-third of respondents bought apparel online in the past two weeks, versus 34.5% last week. This is consistent with the average level we saw in July and August. Elsewhere in our survey, we saw an increase in the number of consumers that are currently buying more apparel online than before the pandemic. The proportion of consumers that bought apparel in a store in the past two weeks decreased very slightly this week to 22.4%, versus the highest level of 23.0% last week. This figure has improved by five percentage points, from 17.0% three months ago.
- The proportion of respondents that visited an open-air shopping center jumped again this week. Almost one-fifth had visited this type of center in the past two weeks, versus 17.4% in last week’s survey. However, the proportion of consumers that visited an enclosed shopping mall decreased to 12.7%, from the highest level of 15.7% last week. The six-percentage-point difference between the proportion of respondents that visited the two types of shopping centers shows the continued outperformance of outdoor centers—helped by many of them having a strong presence of nondiscretionary retailers.
 Respondents could select multiple options
Base: US Internet users aged 18+
Source: Coresight Research[/caption]
More Consumers Expect To Go to the Gym in the Next Two Weeks
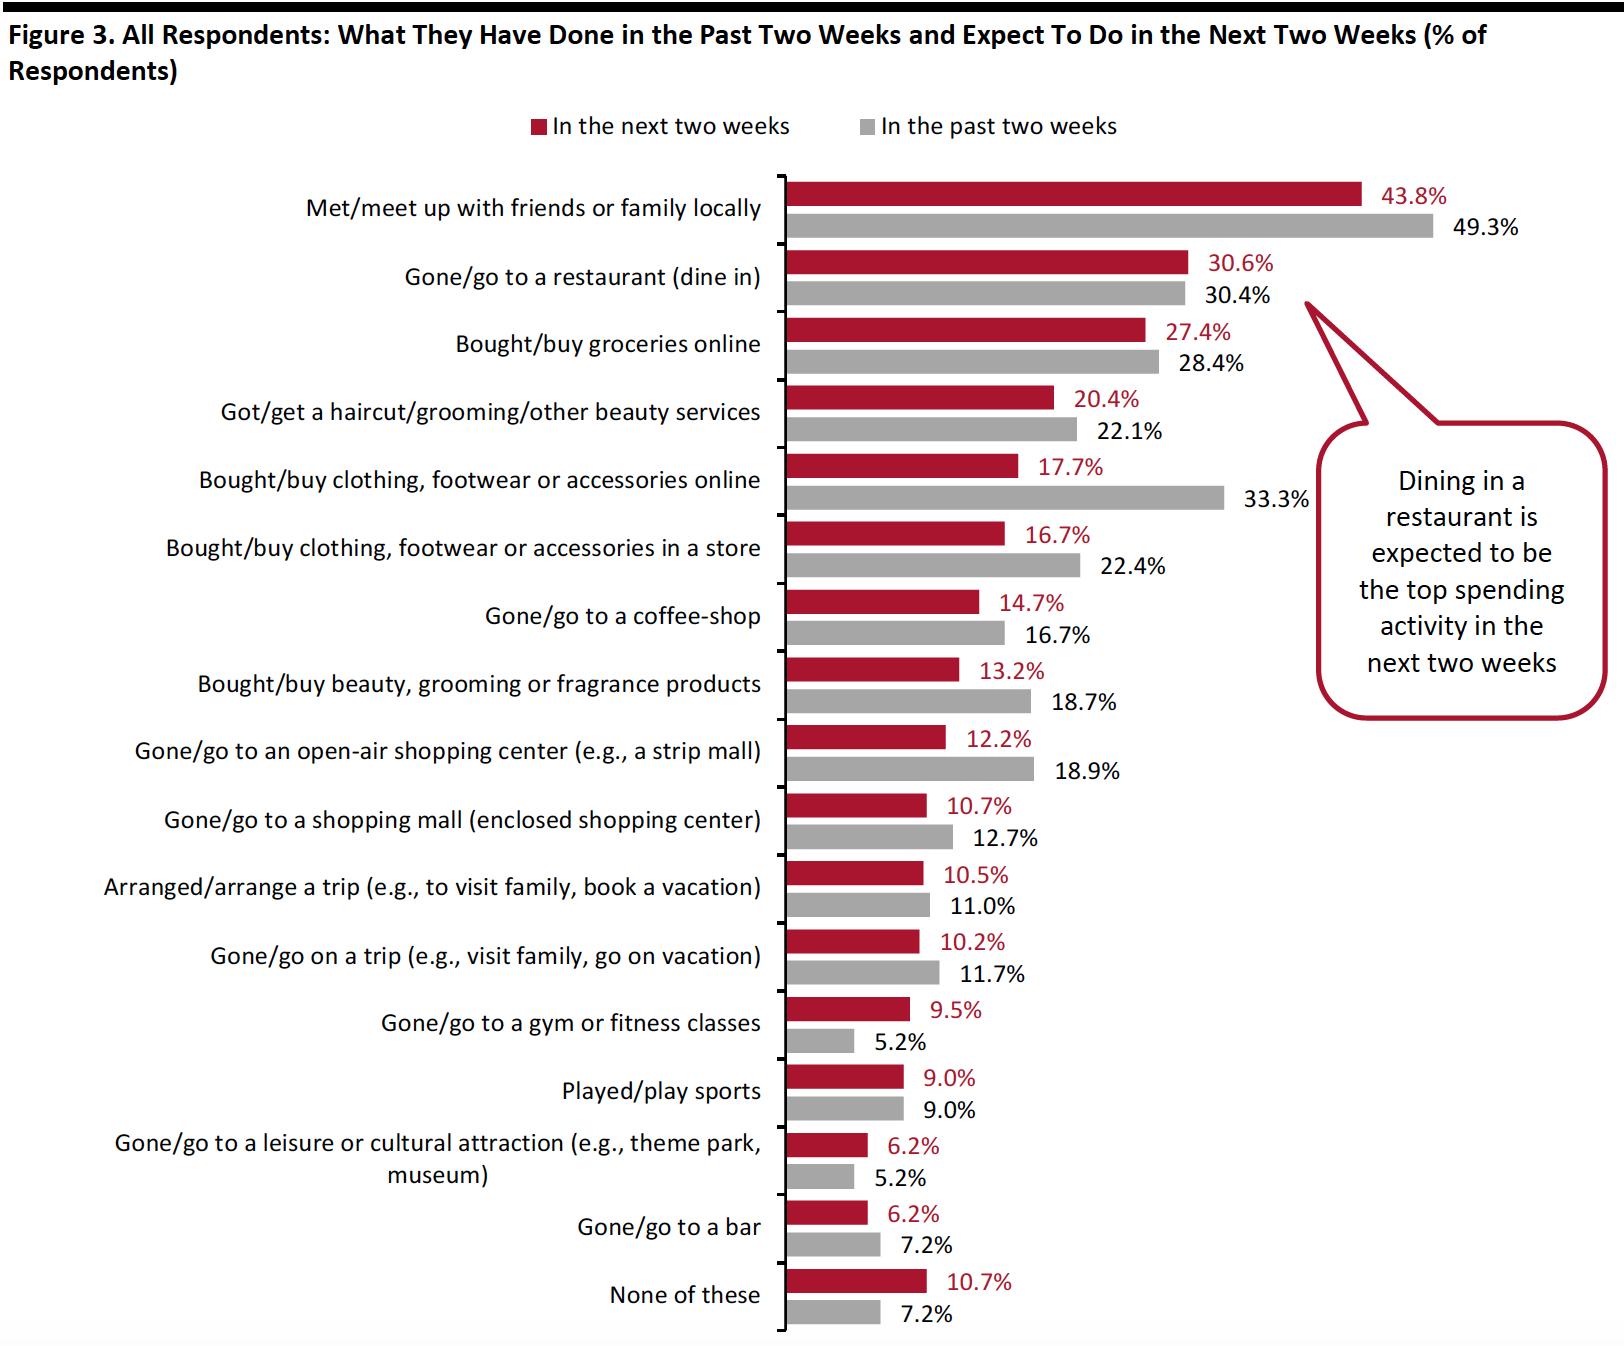
Each week, we ask consumers what they expect to do in the next two weeks, with a comparable set of options to those for the last two weeks. In the chart below, we compare these short-term expectations with recent actual behavior.
We saw slightly lower proportions of consumers expecting to do 11 of the 16 options we provided for activities in the next two weeks than actual behavior in the past two weeks.
- Online grocery shopping became the second-most-expected spending activity for the next two weeks, with 27.4% of consumers planning to buy groceries online—roughly in-line with the actual behavior of such activity in the last two weeks.
- Some 17.7% expect to buy clothing or footwear online in the next two weeks and 16.7% plan to do so in a store. Only 13.2% of consumers expect to purchase beauty products. We are likely to see higher proportions in actual behaviors of these shopping activities, as consumers generally do not plan discretionary purchases in advance, and our previous weekly surveys have suggested that actual behavior exceeds expected behavior for apparel shopping.
- Dining in a restaurant became the top expected spending-related activity for the next two weeks. Three in 10 respondents reported that they expect to eat in a restaurant, which remains the same as actual behavior in the past two weeks.
 Respondents could select multiple options
Base: US Internet users aged 18+
Source: Coresight Research[/caption]
Reviewing Trend Data in Current Purchasing Behavior
What Consumers Are Currently Buying More Of and Less Of
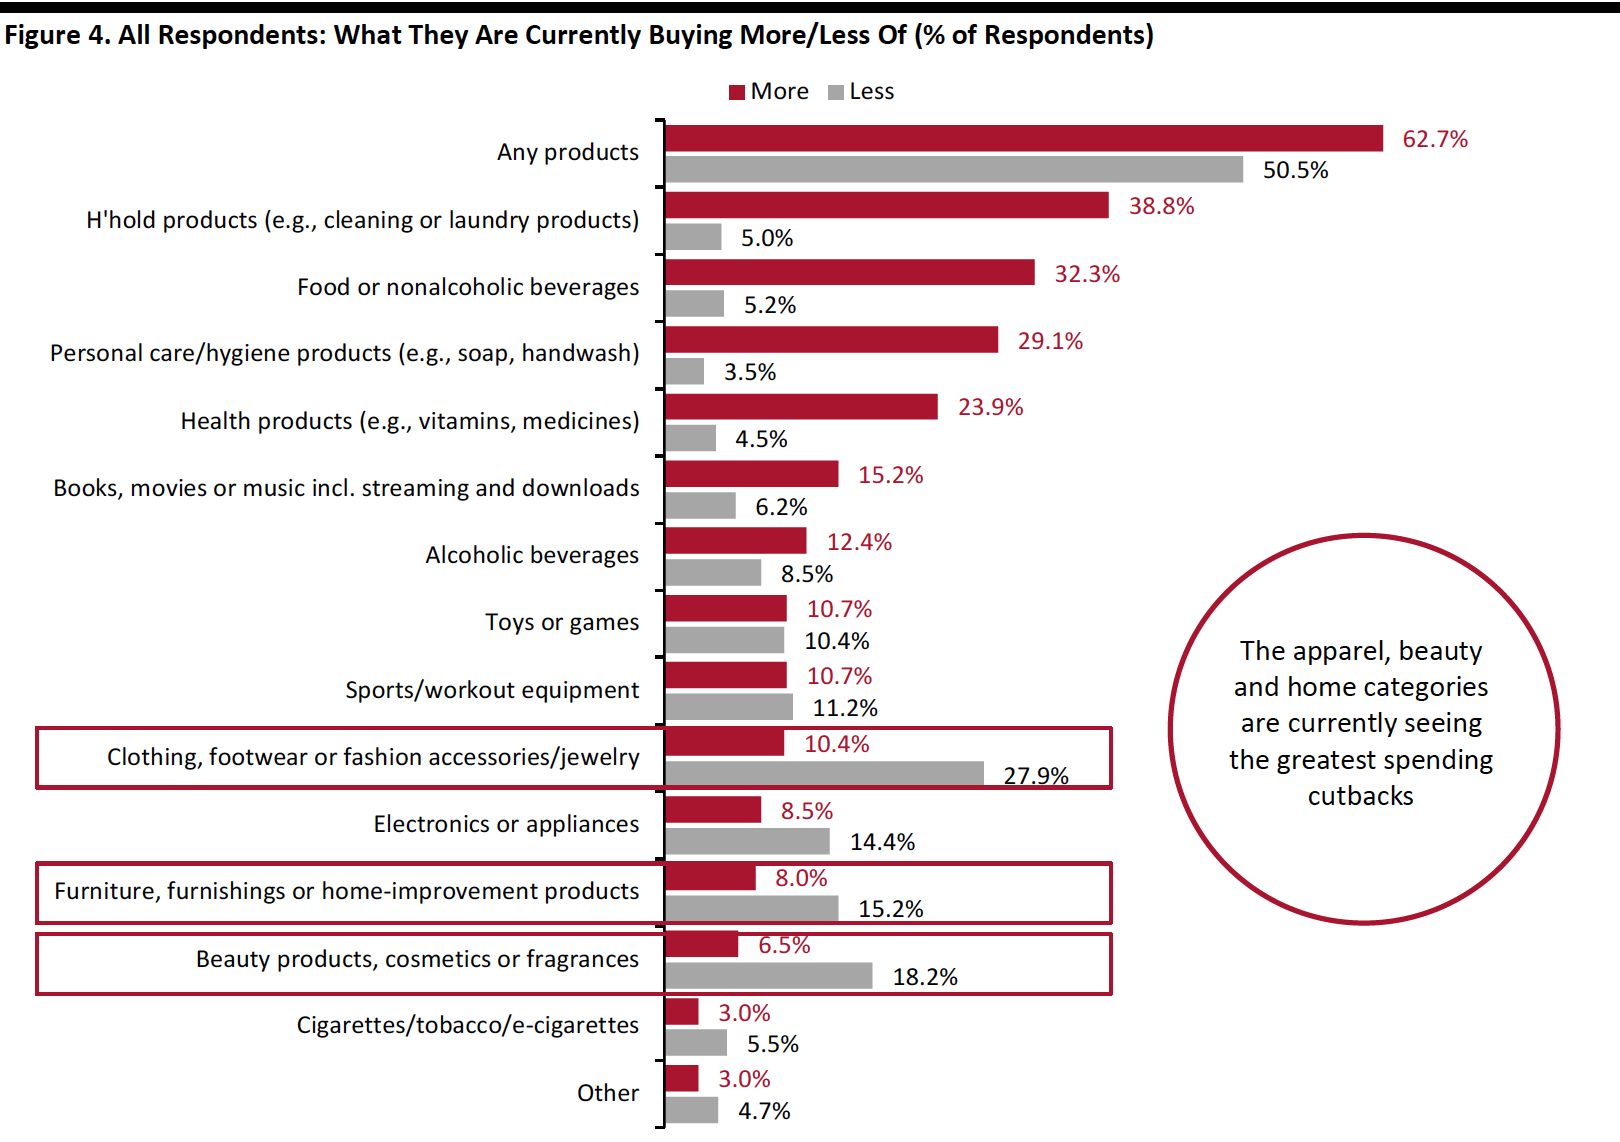
The proportion of respondents that are currently buying more of any category fell back to the level we saw two weeks ago, after increasing significantly last week—some 62.7% are buying more, down from 71.5% last week. The proportion of respondents that are currently buying less also declined slightly this week to half, versus 53.1% last week.
- Buying more of certain categories and buying less of certain categories were not mutually exclusive options, so respondents could answer yes to both.
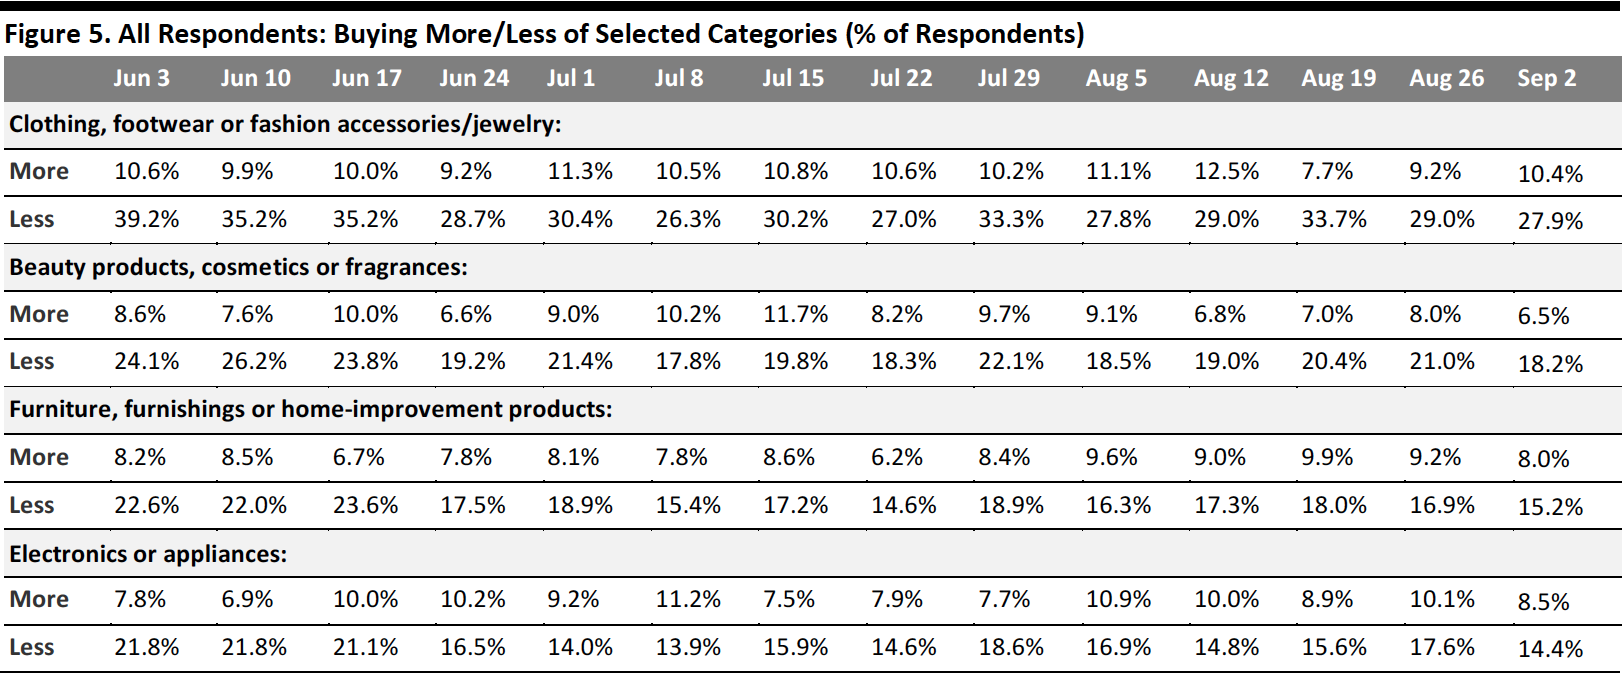
Buying more: Essentials, including household products, food and personal care, continue to maintain the top spots. However, the proportion of consumers that are buying more household and personal care products has been fluctuating in the past few weeks. This week, both categories saw a nine-percentage-point decline.
Buying less: The proportion of respondents buying less in the discretionary categories listed in Figure 5 decreased slightly, week over week. Apparel remains the most impacted category—around 27.9% of respondents are currently spending less on apparel, versus 29.0% last week. The proportion of respondents buying less in beauty and home categories fell to the lowest levels since we started asking this question.
Ratio of less to more: The ratios of the proportions of respondents buying less to the proportions buying more in apparel declined this week, while home and beauty categories saw ratio increases.
- The ratio for apparel fell back to 2.7 from 3.2 last week.
- The ratio for beauty stood at 2.8 this week, versus 2.6 last week.
- The ratio for home increased slightly to 1.9, compared to 1.8 last week.
- The ratio for electronics remained stable at 1.7 this week.
 Respondents could select multiple options
Base: US Internet users aged 18+
Source: Coresight Research[/caption] [caption id="attachment_115850" align="aligncenter" width="700"]
 Base: US Internet users aged 18+
Source: Coresight Research[/caption]
Seven in 10 Are Switching Spending Online
This week, we saw the proportion of consumers buying more online than they used remain level at seven in 10. This trend seemed to plateau, despite the decrease in the rate of avoidance of shopping malls and shops in general.
[caption id="attachment_115851" align="aligncenter" width="700"]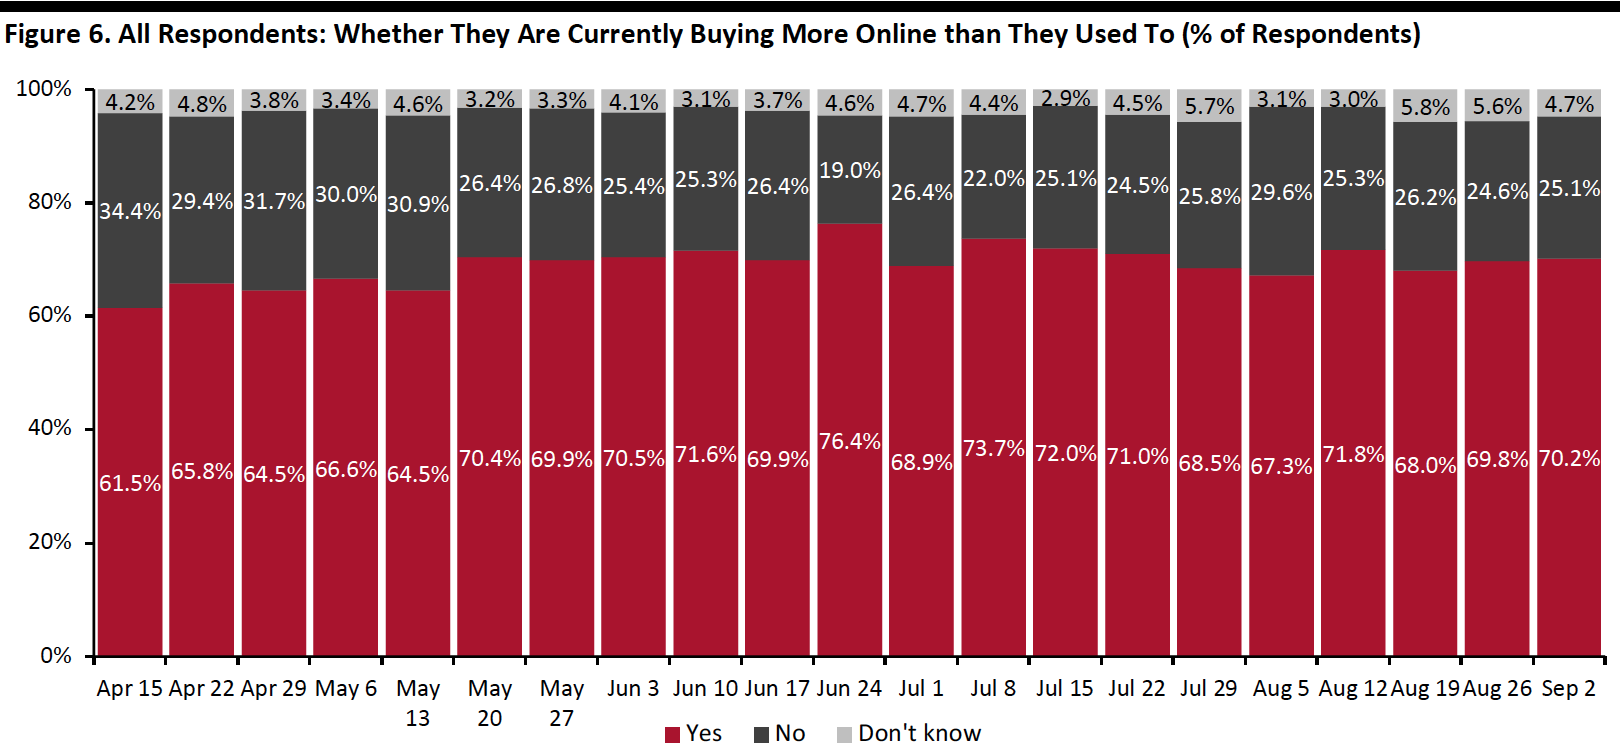 Base: US Internet users aged 18+
Source: Coresight Research[/caption]
What Consumers Are Currently Buying More Of Online
This week, we saw a decrease in the proportion of consumers that are currently buying more essential products online than they used to, although changes are within the margin of error. Online purchases for food declined slightly again this week—some 22.4% are buying more food online, versus one-quarter last week and 27.6% two weeks ago. This is consistent with our previous finding of decreases in the number of consumers that bought groceries online in the past two weeks.
Apparel became the third-most-purchased category online this week. Some 28.1% are currently buying more apparel online, up from one-quarter last week. We have seen an increase in the proportion of online apparel shopping, after dropping to 23.8% two weeks ago. The proportion of respondents that are currently buying more beauty slid slightly, while other discretionary categories, including home and electronics, remained fairly stable this week.
[caption id="attachment_115852" align="aligncenter" width="700"]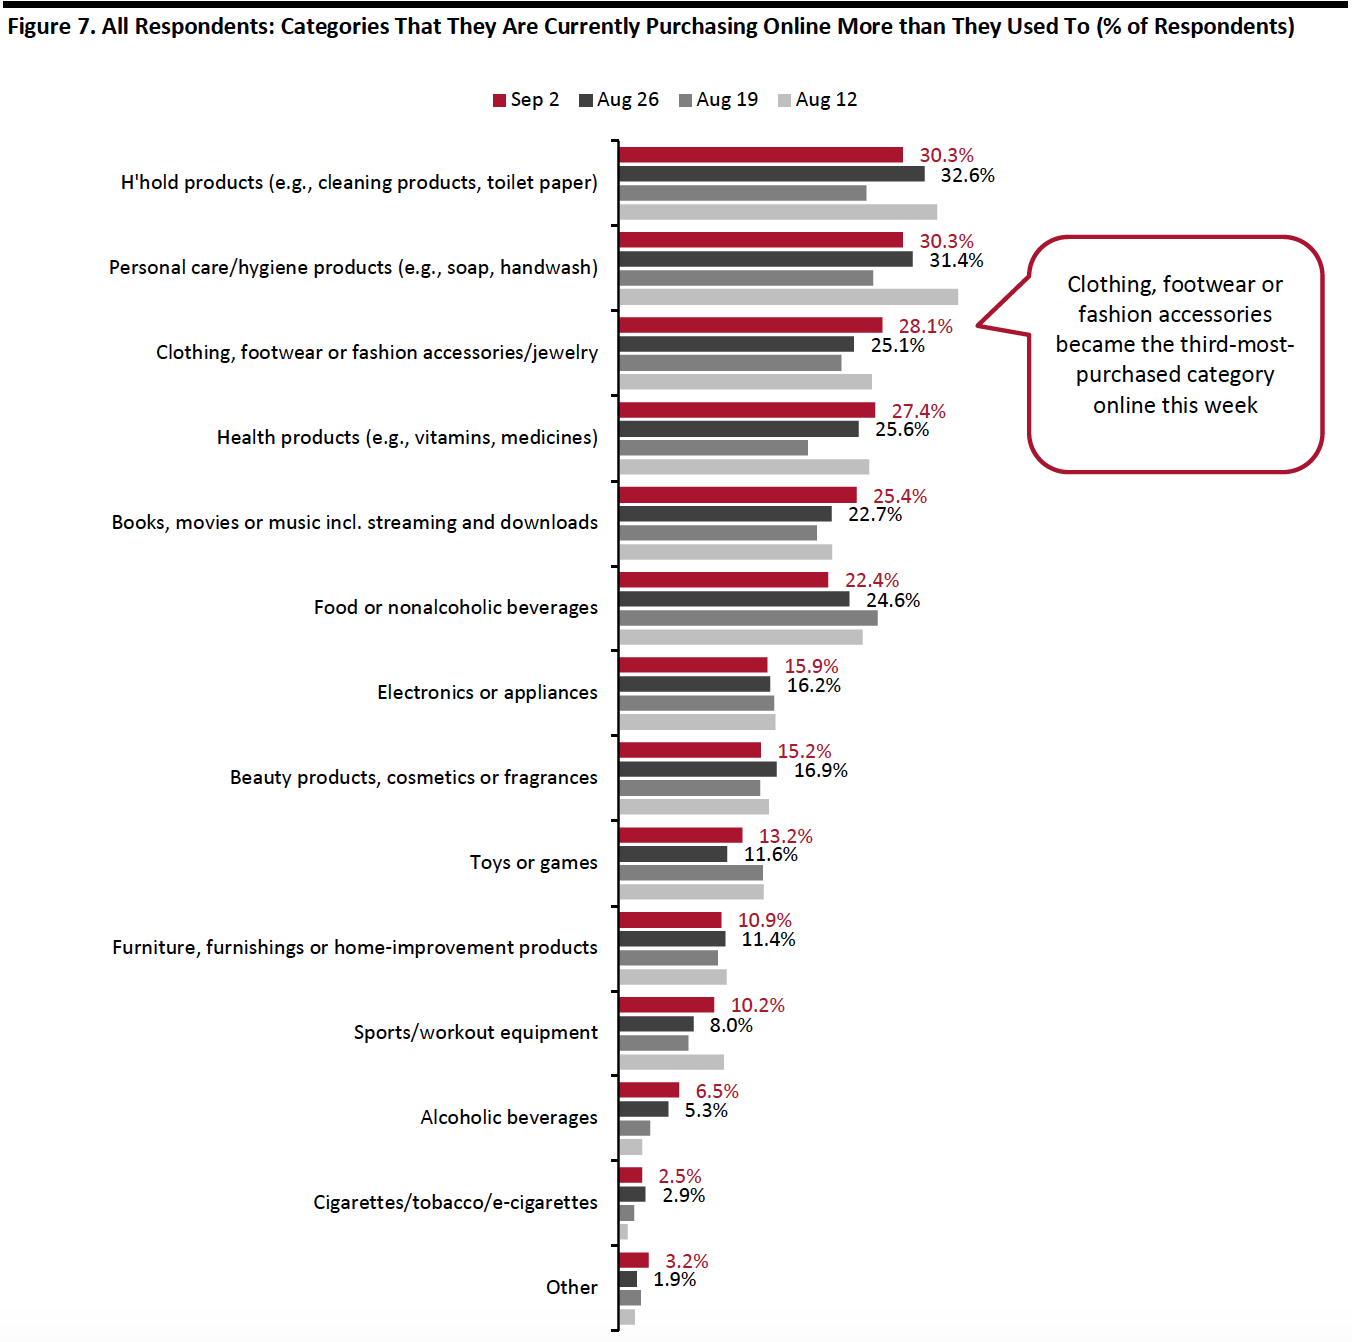 Respondents could select multiple options
Base: US Internet users aged 18+
Source: Coresight Research[/caption]
What We Think
This week, we saw the following:
- Apparel: Apparel remains the most impacted category, although slightly fewer consumers reported purchasing less apparel compared to previous weeks—down to 27.9% from 39.2% three months earlier on June 3. Our survey found that consumers continue to turn to online channels for apparel purchases. One-third of consumers had bought apparel online in the two weeks prior to the survey, compared to 22.4% of those that bought in-store. Although the proportion of consumers that had bought apparel in-store was low, it crept up this week as avoidance of shopping centers and shops in general both decreased slightly.
- Online Grocery: Online grocery shopping tapered off somewhat this week—the proportion of respondents that bought groceries online in the past two weeks decreased by six percentage points to 28.4%. We also saw slightly fewer consumers say that they are currently buying more food online than pre-crisis, week over week. For more data on the trajectory in grocery e-commerce, see our latest monthly US CPG Tracker report. Our weekly survey report on August 19 also focused on consumer’s online grocery shopping habits.
- E-Commerce: This week, we found that a stable seven in 10 consumers said that they are currently buying more online than they used to. The change has been minimal in recent weeks, reflecting the stable avoidance rate of public places at around 80%. We expect e-commerce levels to remain high as we move toward the holiday season peak.
Methodology
We surveyed respondents online on September 2 (402 respondents), August 26 (414 respondents), August 19 (416 respondents), August 12 (400 respondents), August 5 (449 respondents), July 29 (403 respondents), July 22 (404 respondents), July 15 (454 respondents), July 8 (410 respondents), July 1 (444 respondents), June 24 (411 respondents), June 17 (432 respondents), June 10 (423 respondents), June 3 (464 respondents), May 27 (422 respondents), May 20 (439 respondents), May 13 (431 respondents), May 6 (446 respondents), April 29 (479 respondents), April 22 (418 respondents), April 15 (410 respondents), April 8 (450 respondents), April 1 (477 respondents), March 25 (495 respondents) and March 17–18 (1,152 respondents). The most recent results have a margin of error of +/- 5%, with a 95% confidence interval. Not all charted week-over-week differences may be statistically significant.