
DIpil Das
We discuss select findings and compare them to those from prior weeks: September 22, September 15, September 9, September 2, August 26, August 19, August 12, August 5, July 29, July 22, July 15, July 8, July 1, June 24, June 17,June 10, June 3, May 27, May 20, May 13, May 6, April 29, April 22, April 15, April 8, April 1, March 25 and March 17–18.
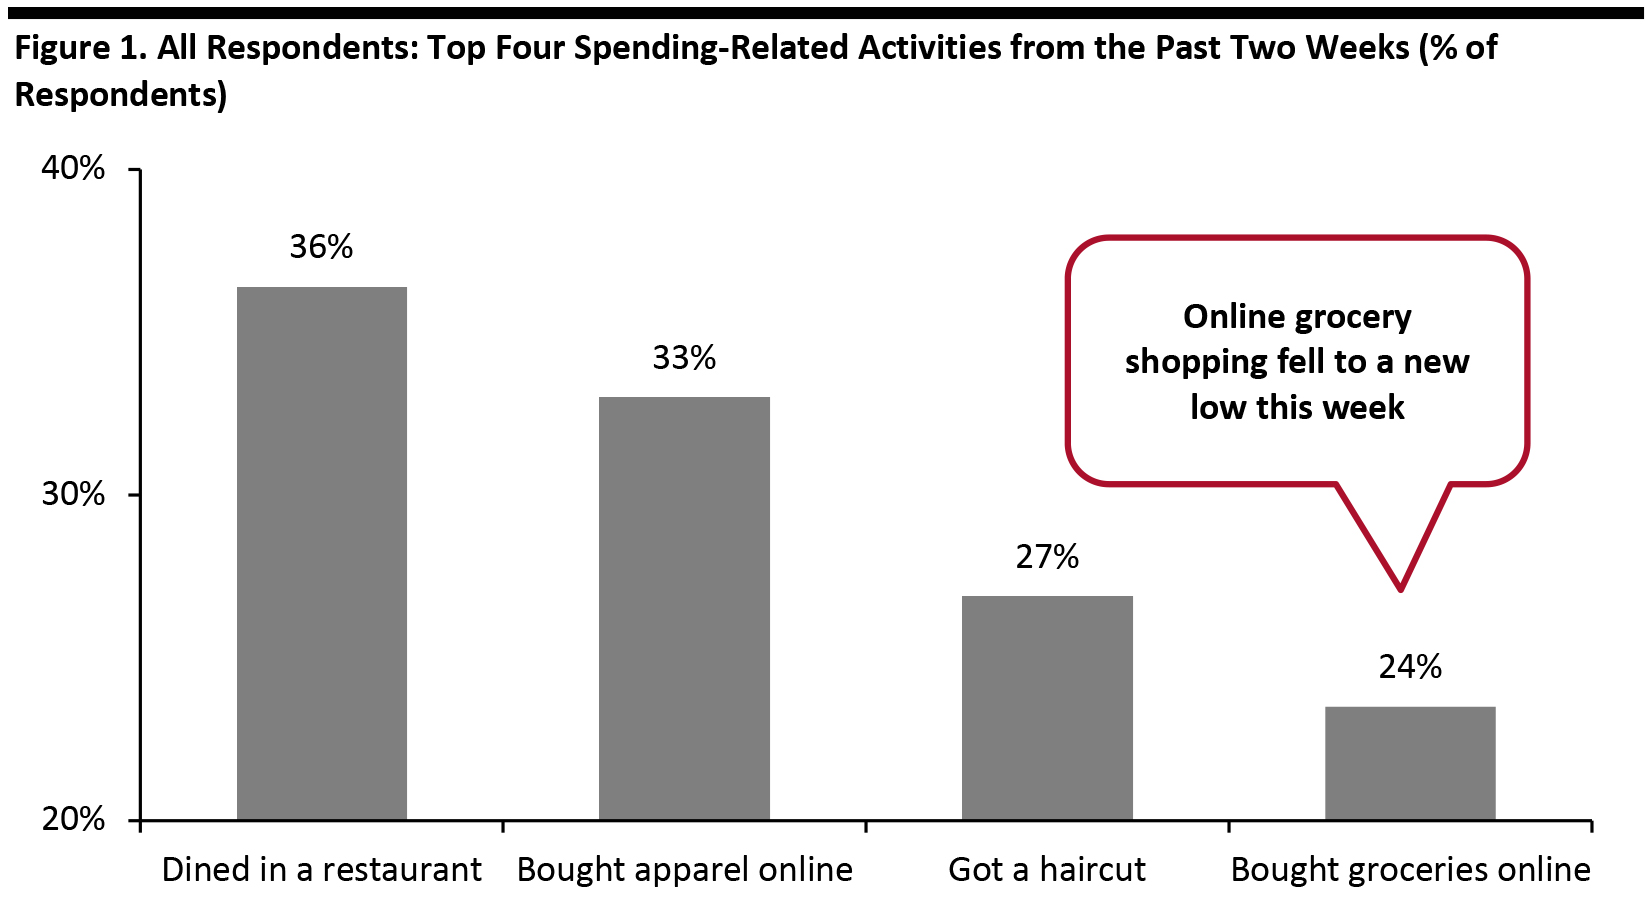
1. Dining in a Restaurant Continues To Rise to a New High
Each week, we ask consumers what they have done in the past two weeks, with this week’s survey showing that dining in a restaurant continues to be the number-one spending activity. The proportion of respondents have done so rose again to a new high of 36%, despite an increase in avoidance of food-service locations, discussed in the next section.
As more consumers returned to food-service businesses, the proportion of respondents that had bought groceries online in the past two weeks dropped to the lowest level since we started asking the question. Some 24% had done so, down five percentage points from almost three in 10 last week. This metric has proved relatively volatile since August.
For other activities in the past two weeks, online shopping for clothing and footwear remained relatively stable at around one-third. This is consistent with the result from a separate question in our survey, on how consumers’ online shopping habits have been impacted by Covid-19, which found that the proportion of respondents buying more apparel online than before the crisis has broadly leveled off week over week.
 Base: US Internet users aged 18+
Source: Coresight Research [/caption] 2. Avoidance of Public Places Drops This week, the proportion of respondents saying that they are avoiding any type of public area returned to the level we saw two weeks ago after surging last week: Three-quarters are currently avoiding any public place, down seven percentage points from 82% last week. We saw decreases in avoidance for five of the 12 options provided, although most of the week-over-week changes were within the margin of error.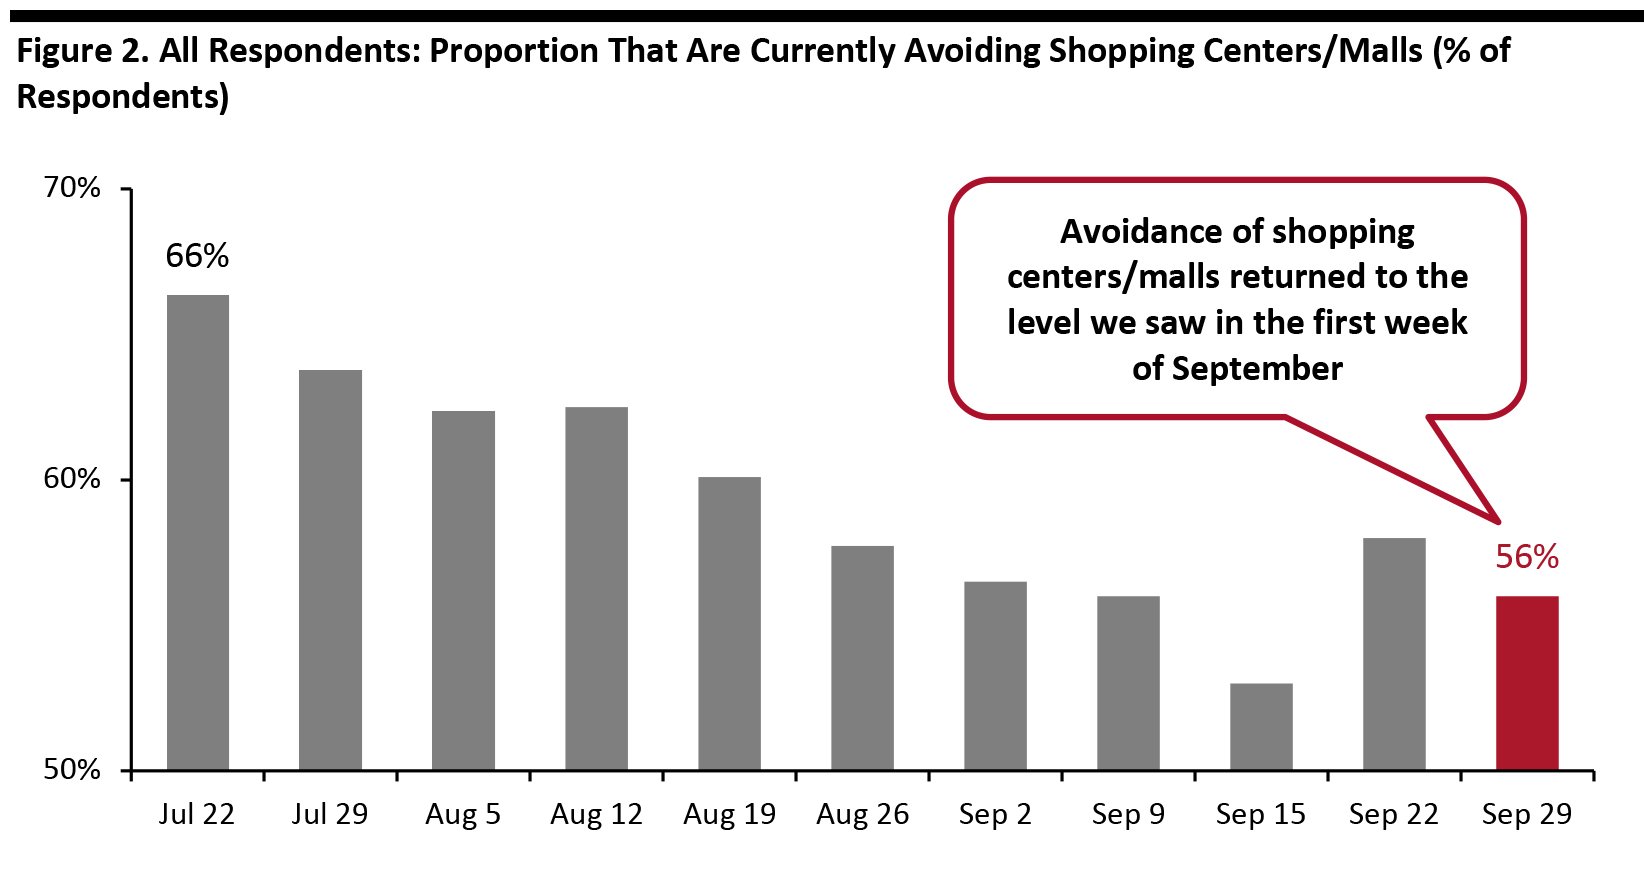 Base: US Internet users aged 18+
Source: Coresight Research [/caption] 3. Fewer Consumers Are Buying More and Buying Less of Certain Categories Than Pre-Crisis This week, the proportion of respondents that are currently buying more than before the crisis fell sharply to 43% from 62% last week. This is the lowest level since we started asking this question back in mid-March. Looking on the bright side, the proportion of respondents that are currently buying less than pre-crisis also dropped by almost seven percentage points to a new low since April, at 45%.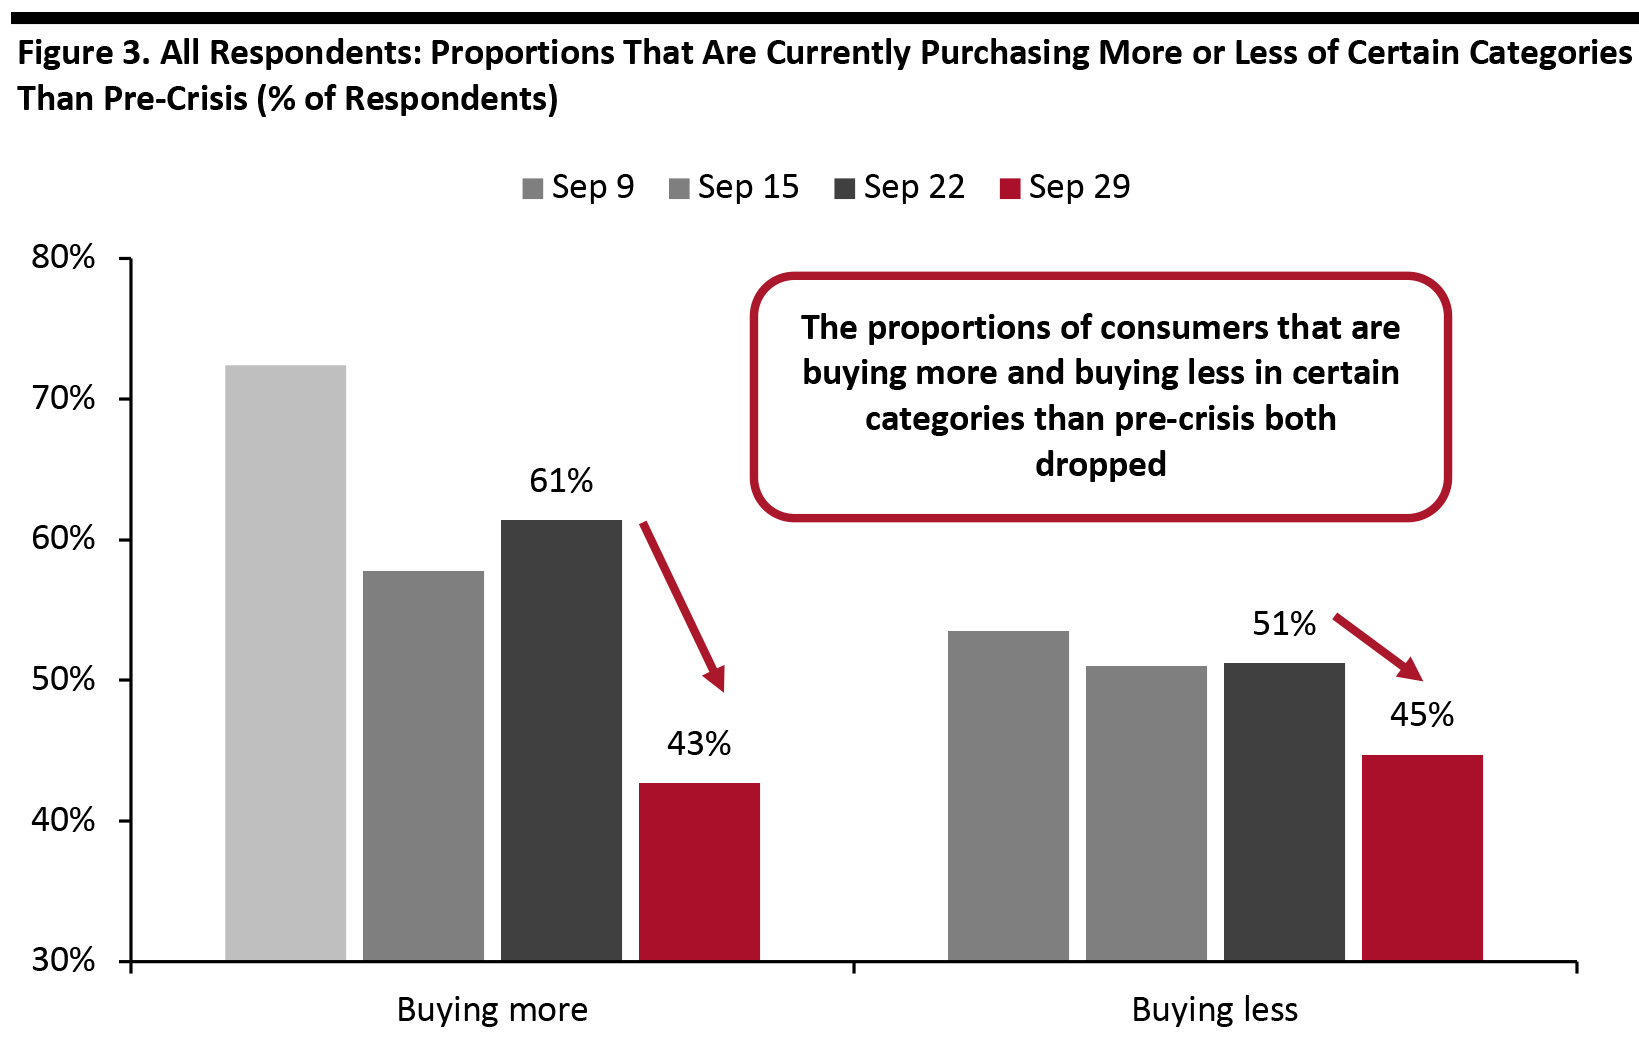 *Buying more of certain categories and buying less of certain categories were not mutually exclusive options—respondents could answer yes to both
Base: US Internet users aged 18+
Source: Coresight Research [/caption]
- See our full report for complete results on consumers’ activities in the past two weeks and their expected activities for the next two weeks.
Base: US Internet users aged 18+ Source: Coresight Research [/caption] 2. Avoidance of Public Places Drops This week, the proportion of respondents saying that they are avoiding any type of public area returned to the level we saw two weeks ago after surging last week: Three-quarters are currently avoiding any public place, down seven percentage points from 82% last week. We saw decreases in avoidance for five of the 12 options provided, although most of the week-over-week changes were within the margin of error.
- The proportion of respondents that are currently avoiding shopping centers/malls fell slightly to the level we saw in the first week of September. Some 56% are currently avoiding such places, versus 58% last week.
- However, avoidance of shops in general increased again this week, although the change was within the margin of error: Some 46% are currently avoiding such places, versus 42% last week.
- Restaurants/bars/coffee shops became the most-avoided public places and saw the largest increase of avoidance this week, of almost six percentage points: Some 57% of respondents are currently avoiding these places, versus 52% last week.
Base: US Internet users aged 18+ Source: Coresight Research [/caption] 3. Fewer Consumers Are Buying More and Buying Less of Certain Categories Than Pre-Crisis This week, the proportion of respondents that are currently buying more than before the crisis fell sharply to 43% from 62% last week. This is the lowest level since we started asking this question back in mid-March. Looking on the bright side, the proportion of respondents that are currently buying less than pre-crisis also dropped by almost seven percentage points to a new low since April, at 45%.
- Buying more of certain categories and buying less of certain categories were not mutually exclusive options, so respondents could answer yes to both.
- This week, we also saw a sharp drop in the proportion of respondents that are currently buying more online than before the crisis (not charted). One factor behind some of these shifts could be the mid-October timing of Amazon's Prime Day. In recent weeks, media coverage of an October Prime Day has increased, and Amazon confirmed the October 13–14 timing on September 28. Consumers could be holding off making purchases in some discretionary categories such as apparel, and holding off making online purchases, in anticipation of Prime Day and rival promotional events from competitors such as Target and Walmart.
- We have previously seen Prime Day have a distorting effect on online sales in the periods surrounding the event. Our separate holiday survey found that 38% of holiday shoppers expect to shop on an October Amazon Prime Day—well ahead of the more traditional Black Friday (21%) and Cyber Monday (33%).
- See our full report for further data on online purchase behaviors, including what categories consumers are buying more of online.
*Buying more of certain categories and buying less of certain categories were not mutually exclusive options—respondents could answer yes to both Base: US Internet users aged 18+
Source: Coresight Research [/caption]