DIpil Das
What’s the Story?
This report presents the results of Coresight Research’s latest weekly survey of US consumers, including on the impacts of the coronavirus outbreak, undertaken on September 29, 2020. We explore the trends we are seeing from week to week, following prior surveys on September 22, September 15, September 9, September 2, August 26, August 19, August 12, August 5, July 29, July 22, July 15, July 8, July 1, June 24, June 17, June 10, June 3, May 27, May 20, May 13, May 6, April 29, April 22, April 15, April 8, April 1, March 25 and March 17–18.What Shoppers Are Doing and Where They Are Going
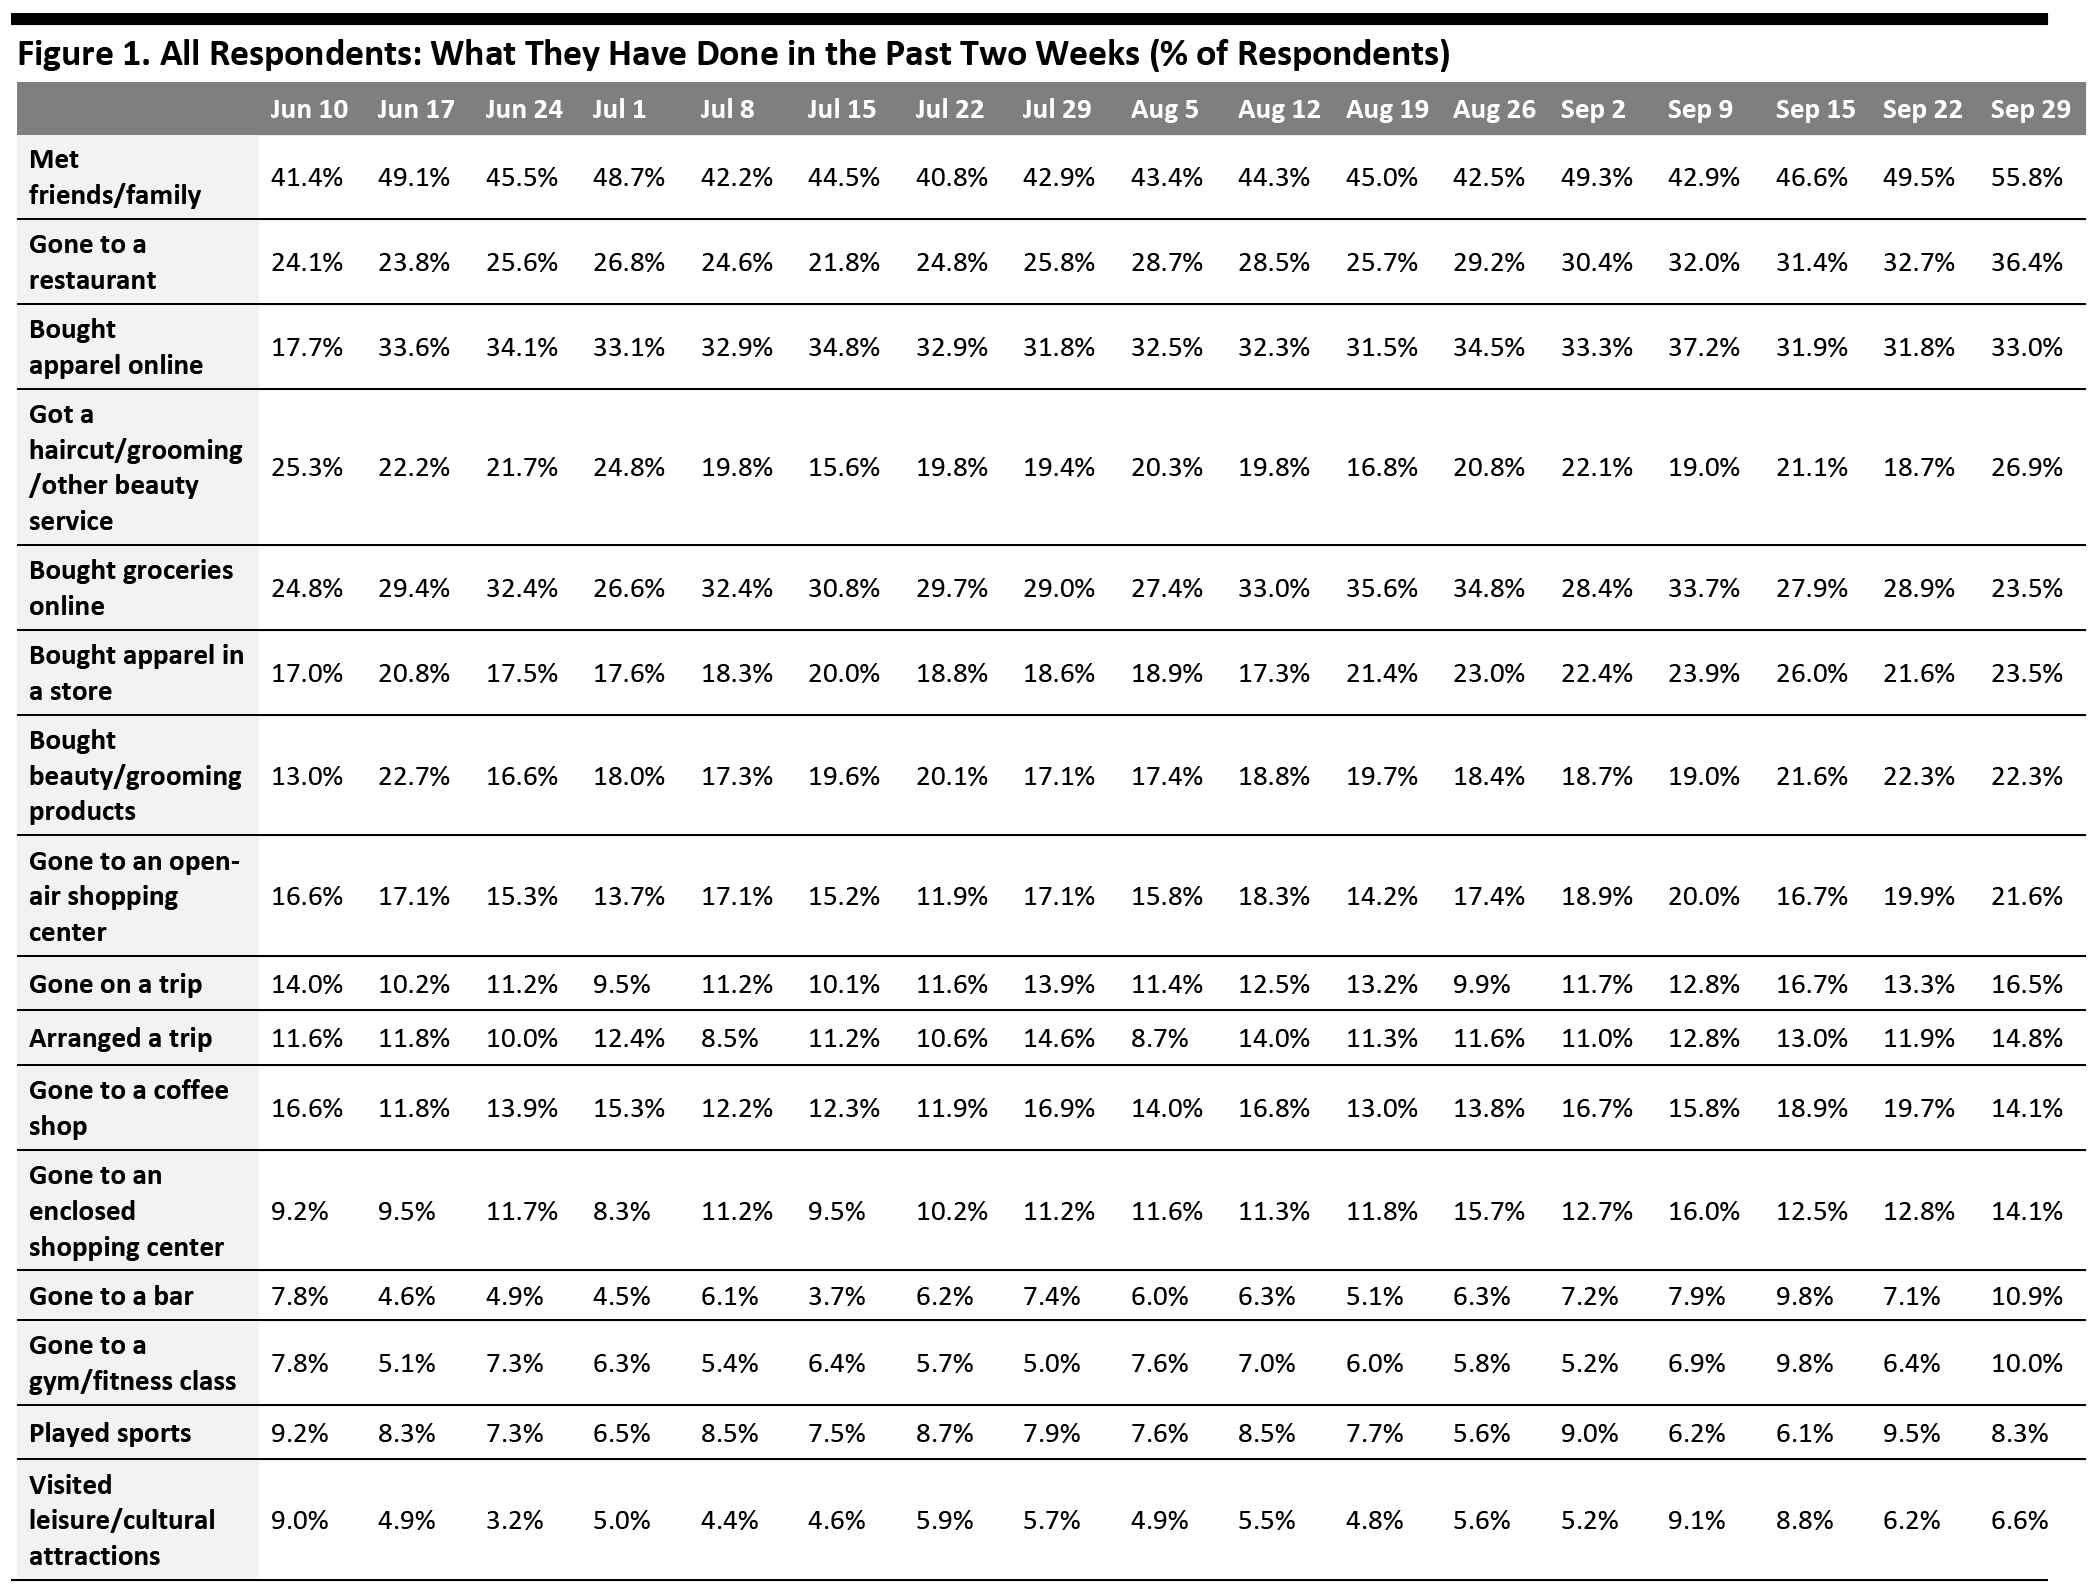
Dining in a Restaurant Continues To Rise to a New High Each week, we ask consumers what they have done in the past two weeks. This week, the proportion of respondents increased for 11 of the 16 options we provided for recent activity options. Although most of the week-over-week changes were within the margin of error, the directional trends, including over a number of weeks, can prove informative. Dining in a Restaurant Continues To Rise to a New High Each week, we ask consumers what they have done in the past two weeks. This week, the proportion of respondents increased for 11 of the 16 options we provided for recent activity options. Although most of the week-over-week changes were within the margin of error, the directional trends, including over a number of weeks, can prove informative.- The proportion of respondents that had bought clothing and footwear online in the past two weeks has remained relatively stable from last week and returned to the average level we saw in July and August, at one-third of respondents. This is consistent with our finding, shown later in this report, that the proportion of consumers that are buying more apparel online than before the pandemic broadly leveled off, week over week. The proportion of respondents that had bought apparel in-store came in at 23.5%, after declining to 21.6% last week. Looking at the monthly average, the proportion has been gradually increasing month over month, growing by five percentage points from July to September.
- Dining in a restaurant remained the top spending activity in the past two weeks, and the proportion having done so rose to a new high of 36.4%, versus 32.7% last week. This is despite the rise in avoidance in food-service locations, as shown later in this report.
- As more consumers returned to food-service businesses, the proportion of respondents that had bought groceries online dropped to the lowest level since we started asking the question. Some 23.5% had done so, down five percentage points from almost three in 10 last week. This metric has proved relatively volatile since August. As we discuss later, this week’s survey separately found that the proportion of respondents that are buying more food online than pre-crisis was at the lowest level we have seen in months.
- The proportion of respondents that had visited an open-air shopping center reached a new high this week—some 21.6% had done so. The proportion that had visited an enclosed shopping center stood at 14.1% this week.
- Getting a haircut/grooming service experienced the highest increase, week over week. Some 26.9% had got a haircut, up eight percentage points from 18.7% last week.
 Respondents could select multiple options
 Base: US Internet users aged 18+
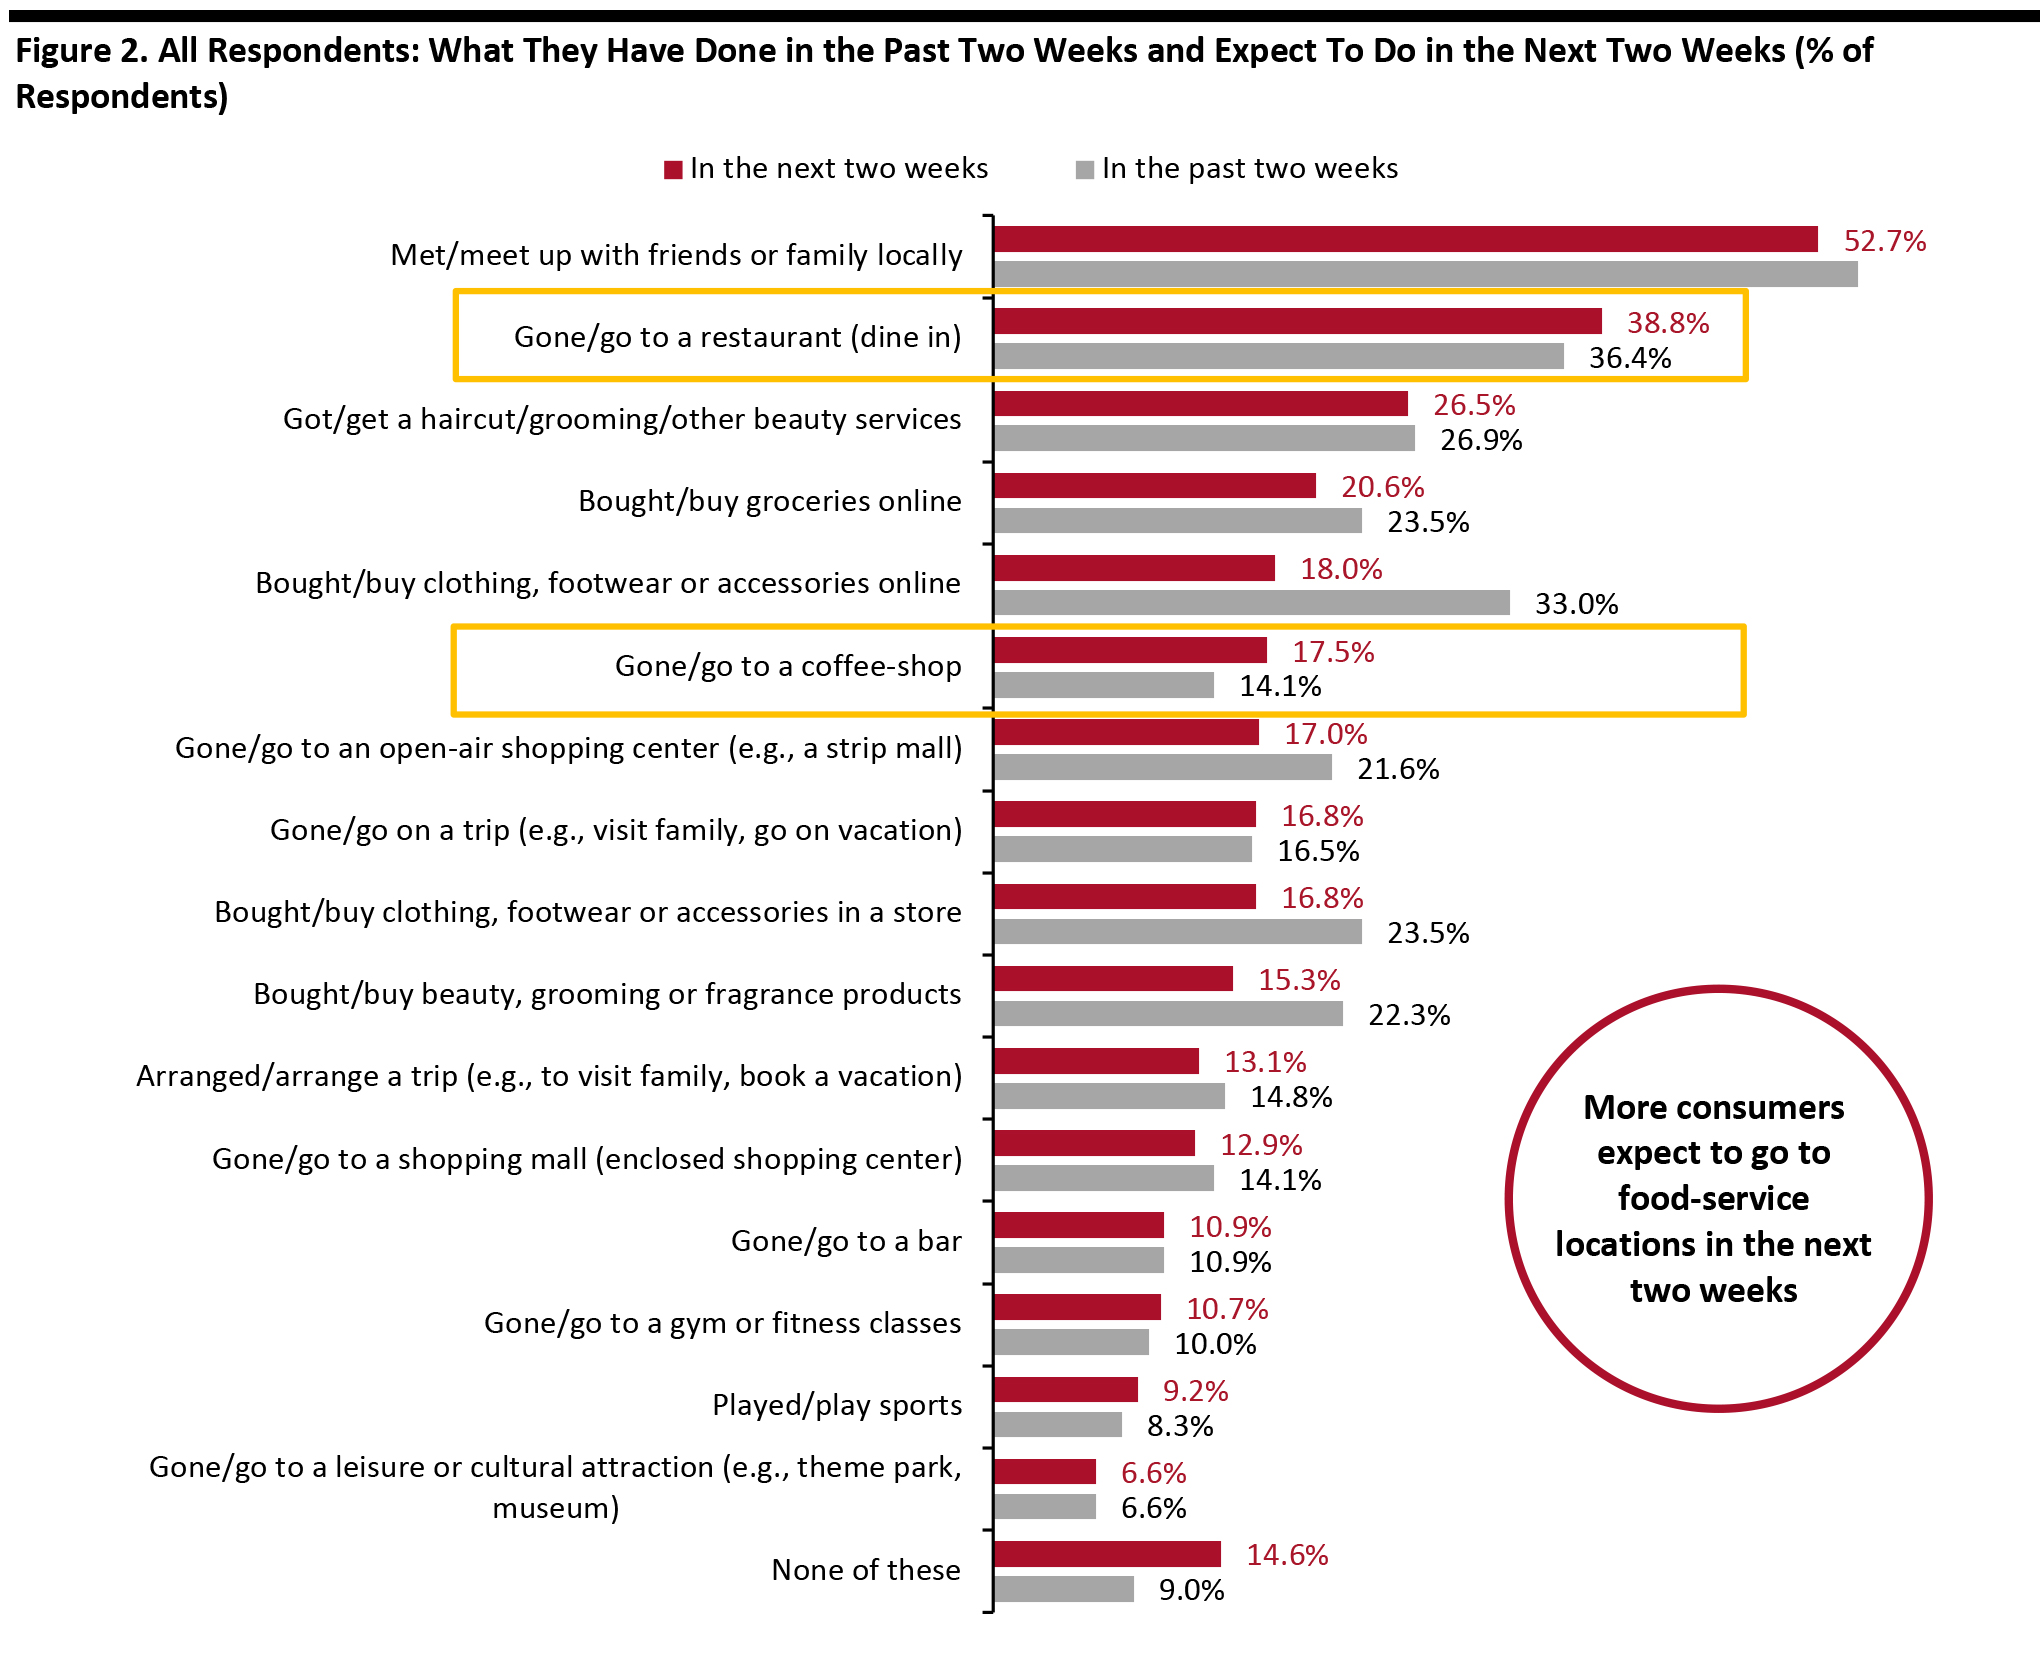
Source: Coresight Research [/caption] More Consumers Plan To Go to Food-Service Locations in the Next Two Weeks Each week, we ask consumers what they expect to do in the next two weeks, with a comparable set of options to those for the last two weeks. In the chart below, we compare these short-term expectations with recent actual behavior. We saw slightly lower proportions of consumers expecting to do half of the 16 options we provided for activities in the next two weeks than actual behavior in the past two weeks.
- As with consumers’ actual behavior in the past two weeks, dining in a restaurant continues to be the top expected spending-related activity for consumers to do in the next two weeks, with 38.8% planning to do so, higher than the 36.4% of actual behavior in the past two weeks. We also saw more consumers planning to go to coffee shops than recent actual behavior of such activity. Although more consumers plan to visit food-service locations over the next two weeks, we still see a high avoidance rate for such locations, discussed in the next section of the report.
- The proportion of respondents that expect to buy clothing or footwear online stood at 18.0%, while 16.8% of consumers plan to do so in a store. Some 15.3% of consumers expect to purchase beauty products. As we typically see actual behavior of these shopping activities exceed expected behavior, we expect much higher proportions in actual behavior of these activities.
- The expectation to get a haircut or other grooming service in the next two weeks remained at an elevated level compared to actual behavior, with 26.5% expecting to do so.
 Respondents could select multiple options
 Base: US Internet users aged 18+
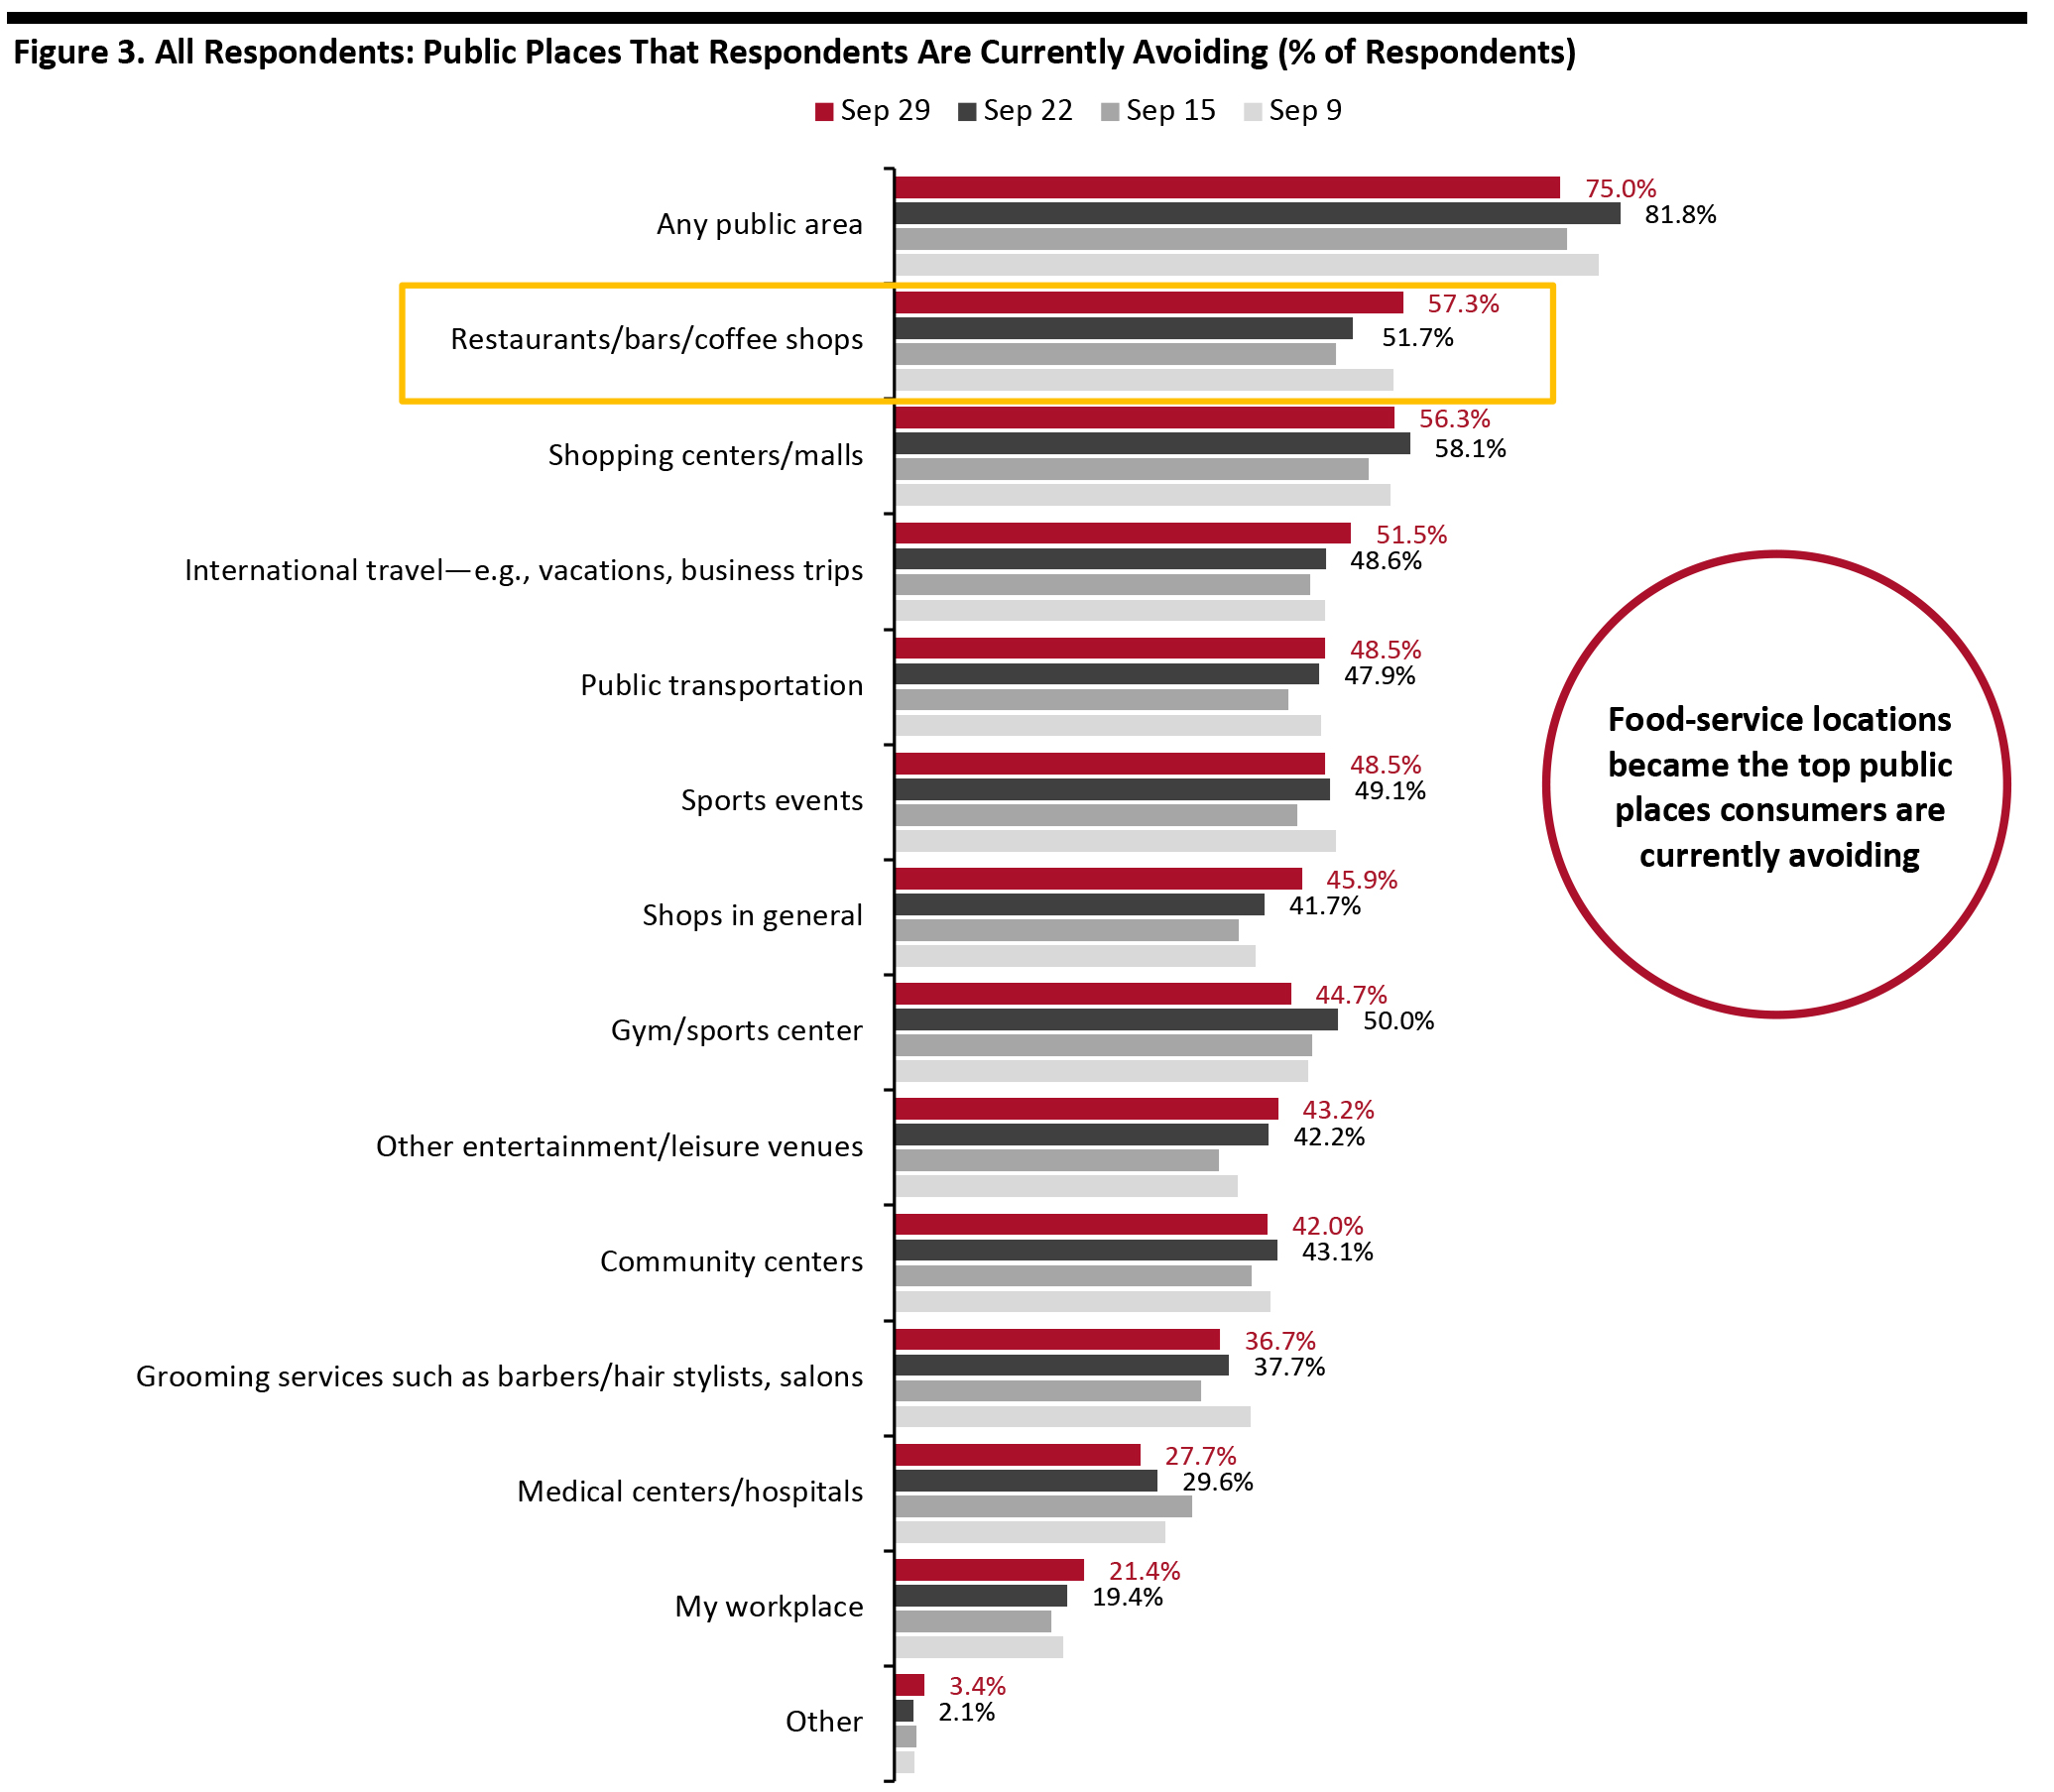
Source: Coresight Research [/caption] Three-Quarters Are Currently Avoiding Public Places This week, the proportion of respondents saying that they are avoiding any type of public area returned to the level we saw two weeks ago after surging to over 80% last week: Three-quarters are currently avoiding any public place, down seven percentage points from 81.8% last week. We saw decreases in avoidance for five of the 12 options provided, although most of the changes were within the margin of error.
- The proportion of respondents that are currently avoiding shopping centers/malls fell slightly to the level we saw in the first week of September. Some 56.3% are currently avoiding such places, compared to 58.1% last week.
- However, avoidance of shops in general went up again this week. Some 45.9% are currently avoiding such places, versus 41.7% last week.
- Restaurants/bars/coffee shops became the most-avoided public place and saw the largest increase of avoidance this week, of almost six percentage points: Some 57.3% of respondents are currently avoiding these food-service locations, versus 51.7% last week.
 Respondents could select multiple options
 Base: US Internet users aged 18+
Source: Coresight Research [/caption]
Reviewing Trend Data in Current Purchasing Behavior
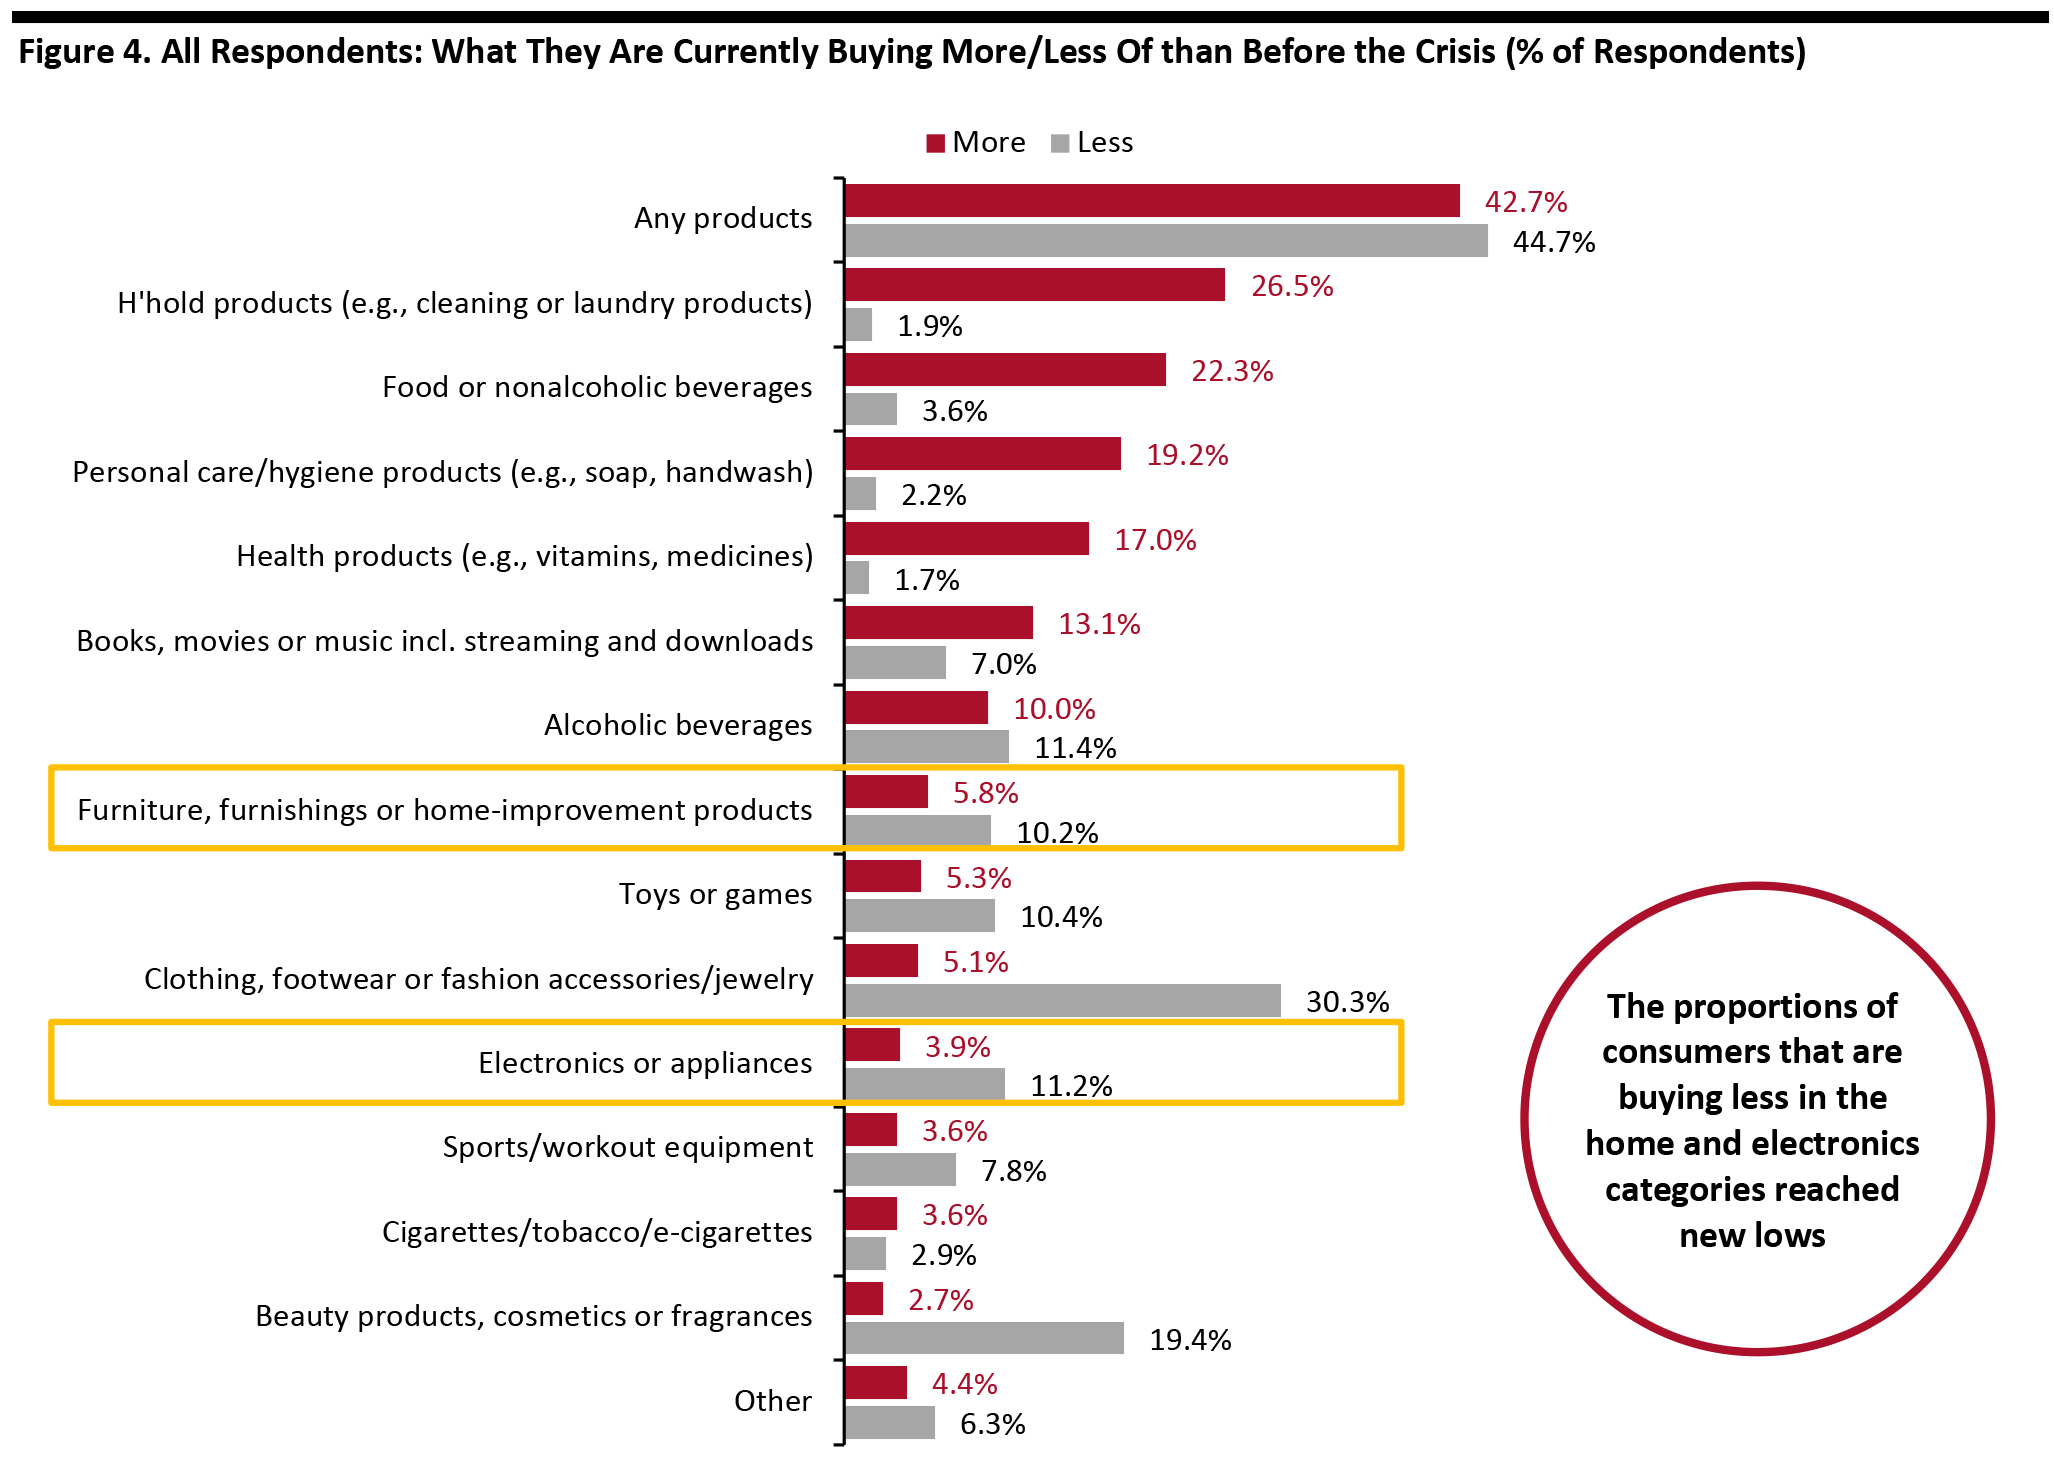
What Consumers Are Currently Buying More Of and Less Of This week, the proportion of respondents that are currently buying more of any products than before the crisis fell sharply, to 42.7% from 61.4% last week. This is the lowest level we have seen since we started asking this question in mid-March. Looking at the data by age, we saw the largest decline week over week in the youngest age group (age 18–29). Looking on the bright side for retail, the proportion of respondents that are currently buying less than pre-crisis also dropped by almost seven percentage points to a new low since April, at 44.7% from 51.2% last week.- Buying more of certain categories and buying less of certain categories were not mutually exclusive options, so respondents could answer yes to both.
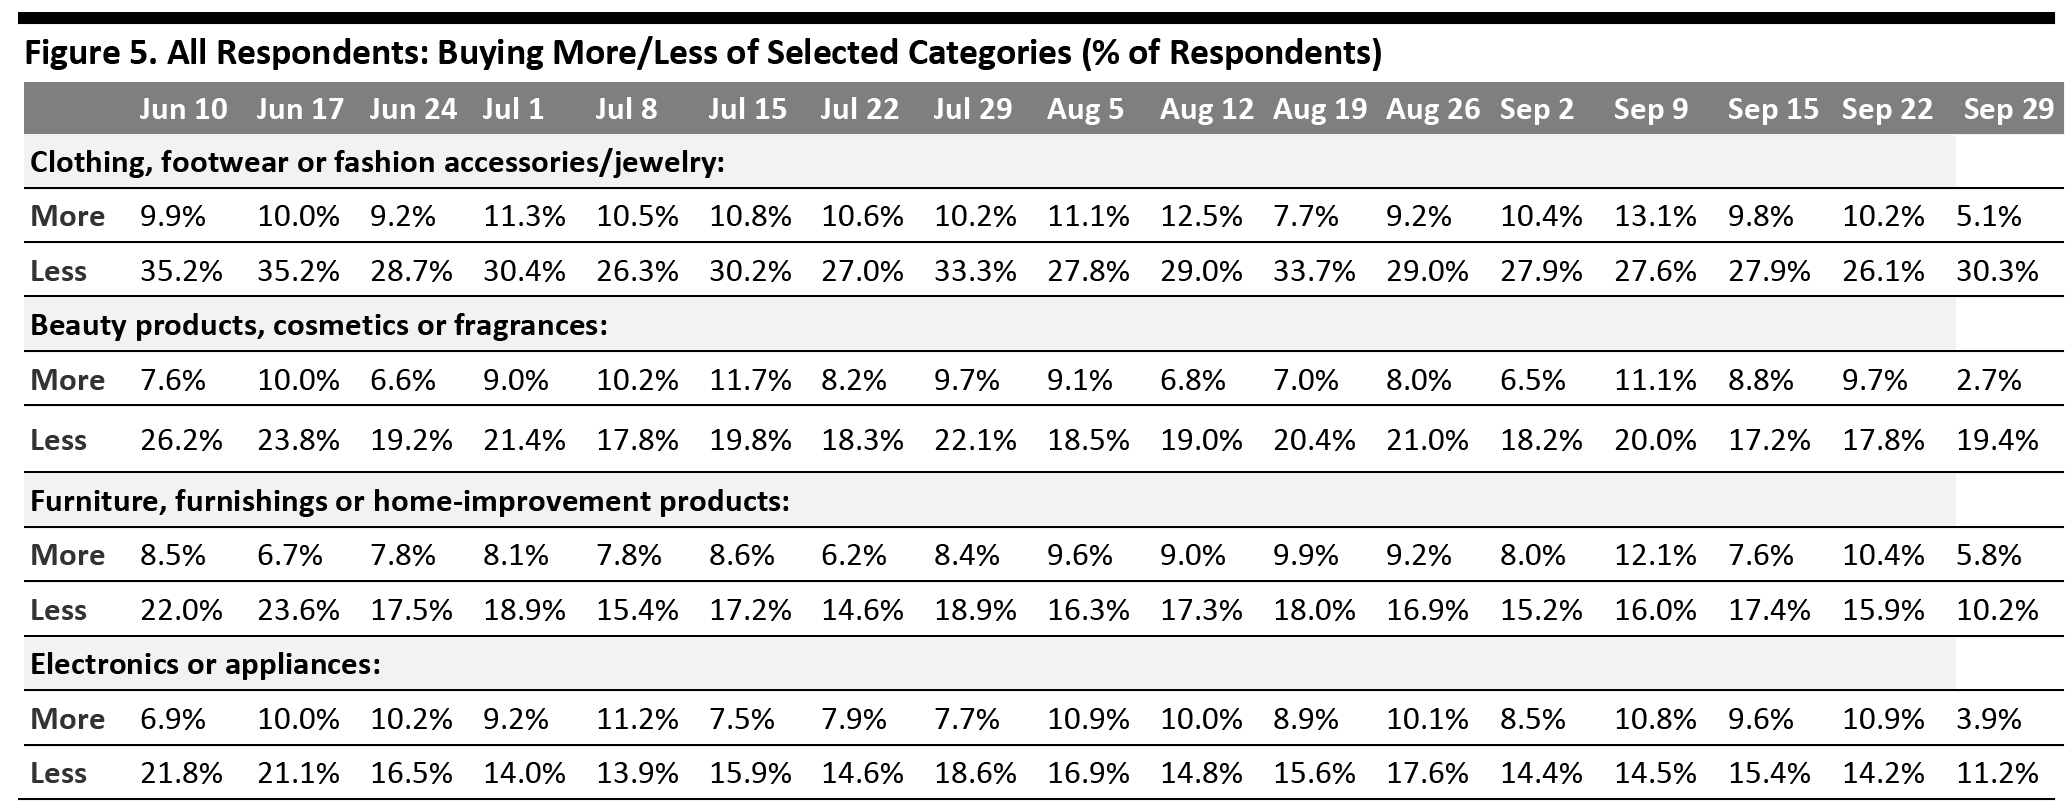
- The ratio for clothing and footwear spiked to 6.0, from 2.6 last week and 2.9 two weeks ago.
- The ratio for beauty surged to 7.3, versus 1.8 last week and 1.9 two weeks ago.
- The ratio for home came at 1.8, compared to 1.5 last week.
- The ratio for electronics stood at 2.9, versus 1.3 last week.
 Respondents could select multiple options
 Base: US Internet users aged 18+
Source: Coresight Research [/caption] [caption id="attachment_117059" align="aligncenter" width="700"]
 Base: US Internet users aged 18+
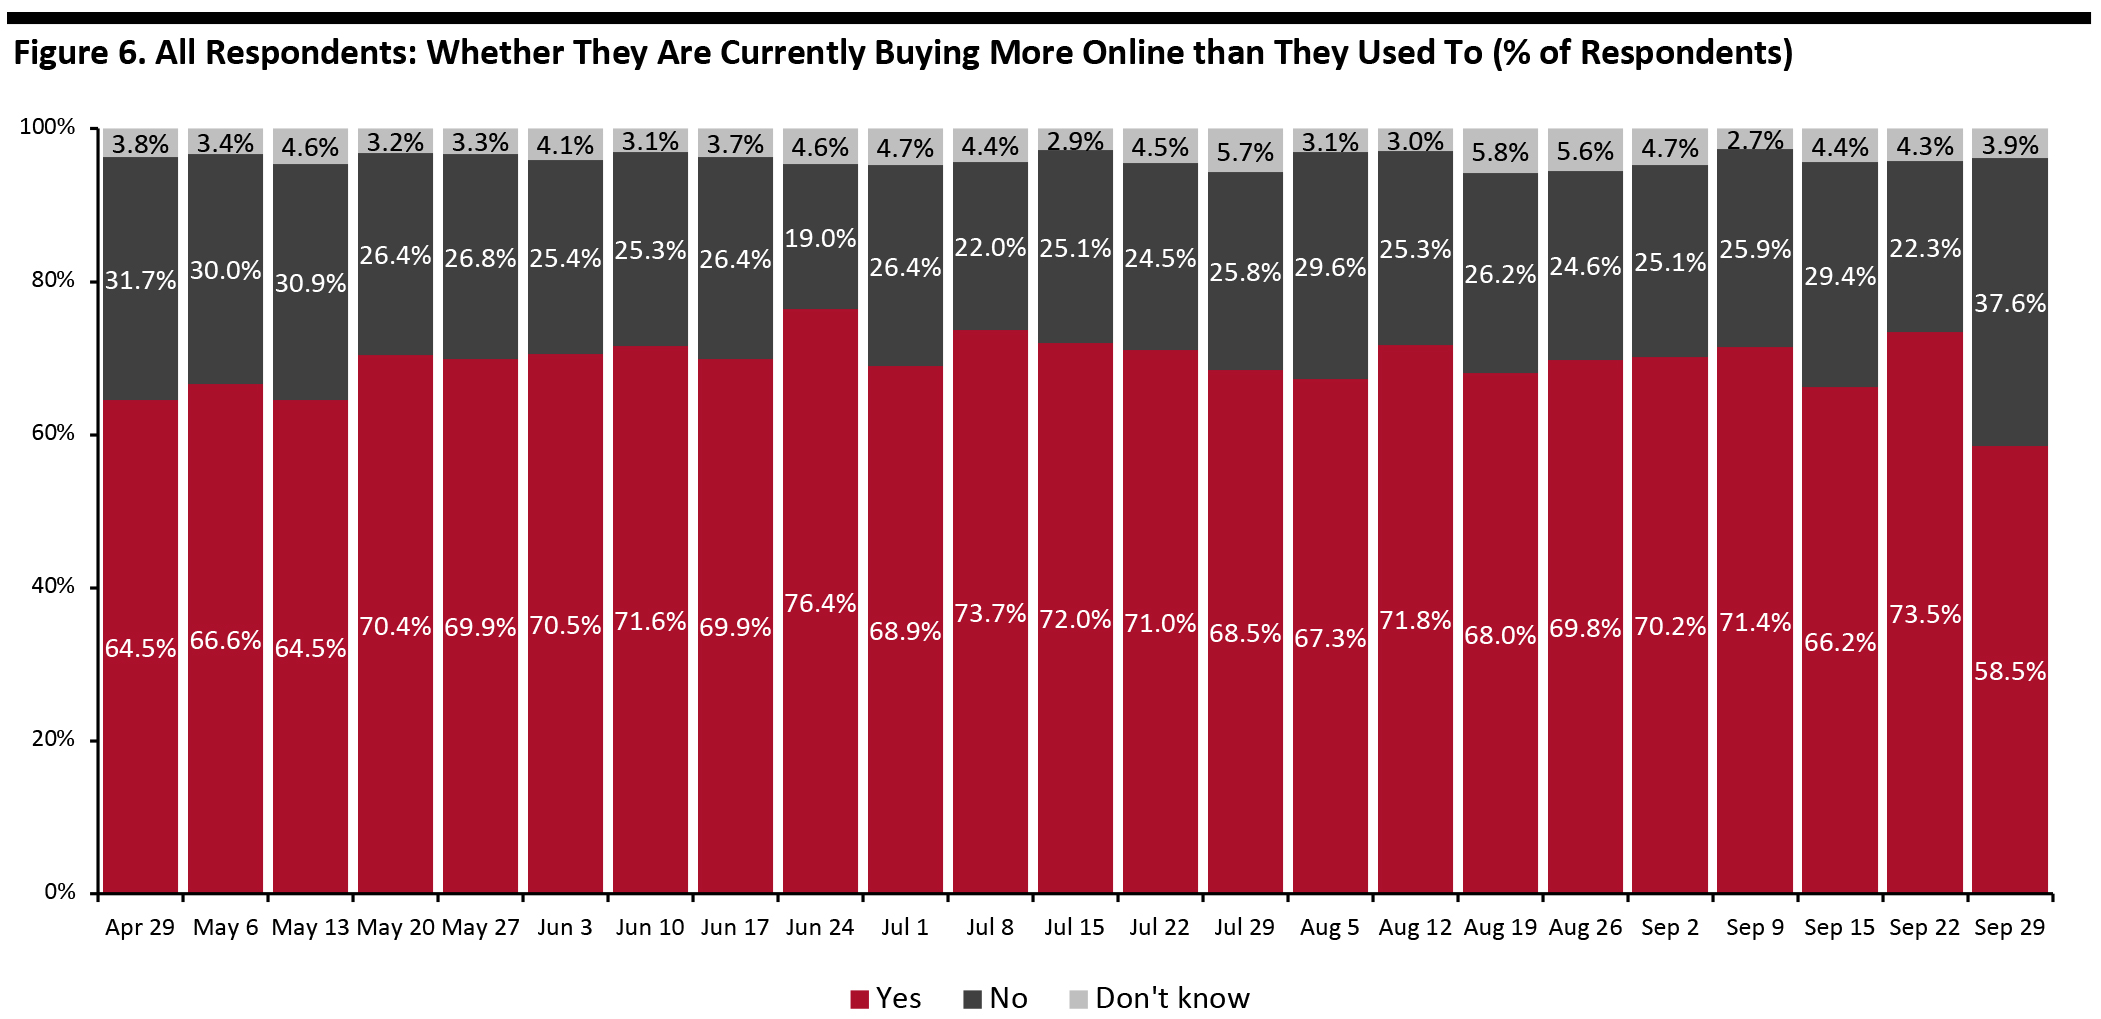
 Source: Coresight Research [/caption] Six in 10 Are Switching Spending Online This week, we saw the proportion of consumers buying more online than they used to plunged to a new low—some 58.5% are currently buying more online, down 15 percentage points from almost three-quarters last week.
- One factor in this sharp decline could be the much lower proportion of consumers that are currently buying more of any category overall than before the crisis, discussed in the previous section.
- Consumers could also be holding off making some online purchases in anticipation of Amazon's Prime Day. In recent weeks, media coverage of an October Prime Day has increased, and Amazon confirmed the October 13–14 timing on September 28. We have previously seen Prime Day have a distorting effect on online sales in the periods surrounding the event. Our separate holiday survey found that 38% of holiday shoppers expect to shop on an October Amazon Prime Day—well ahead of the more traditional Black Friday (21%) and Cyber Monday (33%).
 Base: US Internet users aged 18+
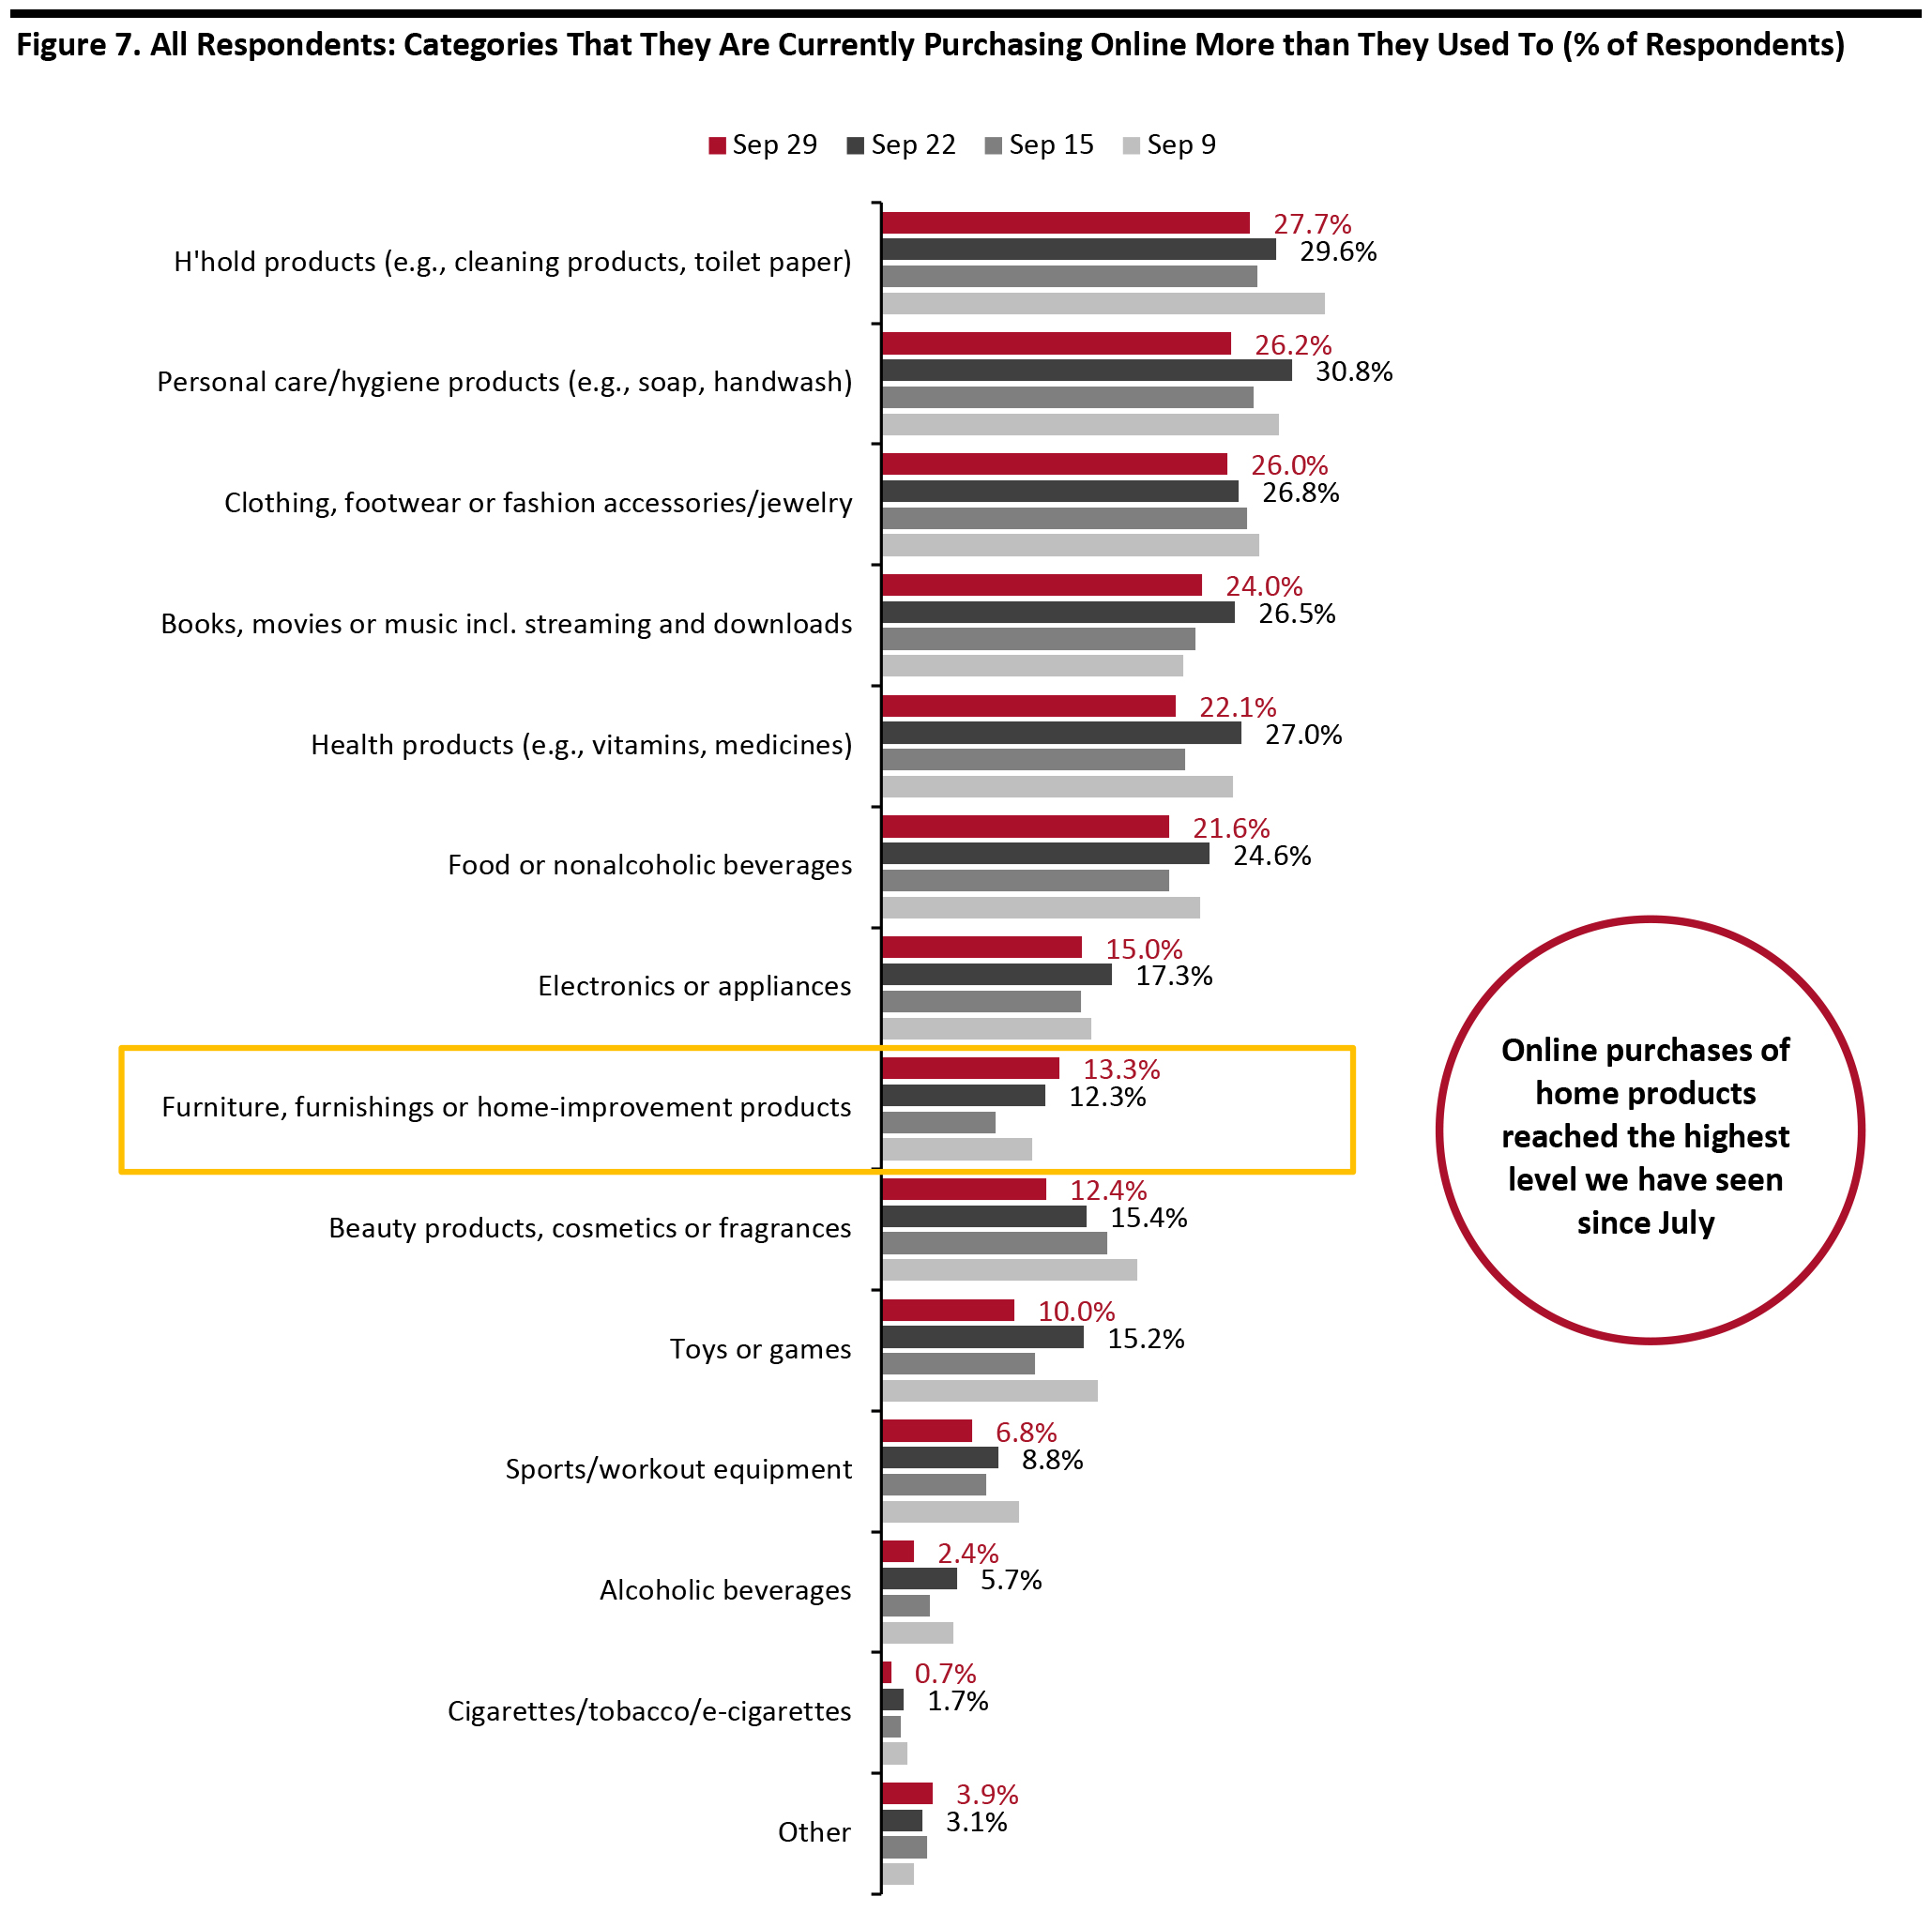
 Source: Coresight Research [/caption] What Consumers Are Currently Buying More Of Online Looking at specific categories, 10 of the 13 categories we provided as options saw week-over-week decreases in consumers buying more online than pre-crisis, although most of the changes were within margin of error. The household product and personal care categories remained the most-purchased categories online. The proportions of consumers that are buying more personal care products or health products online both declined by almost five percentage points, week over week. Online purchases of food decreased to the level we saw two weeks ago, which was the lowest level we have seen in months. Some 21.6% are buying more food online, versus 24.6% last week. The proportion of respondents that are currently buying more apparel online broadly leveled off this week at 26.0%. It became the third-most-purchased category online, as other categories saw larger week-over-week declines. Home was the only discretionary category that saw a very slight increase (week-over-week change was within the margin of error). Some 13.3% are buying more home products online—the highest level we have seen since July. [caption id="attachment_117061" align="aligncenter" width="700"]
 Respondents could select multiple options
 Base: US Internet users aged 18+
Source: Coresight Research [/caption]
What We Think
This week, we saw a number of shifts that suggest volatility in consumer behavior:- Apparel: Clothing and footwear remained the most-cut category, and we saw a much lower proportion of consumers buying more apparel this week than before the crisis. However, we saw online apparel purchases broadly level off this week: A relatively consistent proportion of one-third had bought clothing or footwear online in the past two weeks, and about 26% are currently buying more apparel online than pre-crisis. In-store apparel shopping in the past two weeks came in at 23.5%, versus 21.6% last week.
- Online Grocery: Our survey showed that online grocery activity fell to a new low this week: The proportion that had bought groceries online in the past two weeks went down by five percentage points to 23.5%, from 28.9% last week. In addition, the proportion buying more food online than before the pandemic returned to the level we saw two weeks ago, at 21.6%—the lowest level we have seen in months. This coincided with an increased proportion of respondents visiting food-service establishments (even as a significant proportion say they are avoiding restaurants or coffee shops). For more data on the trajectory of online grocery, see our monthly US CPG Sales Tracker report, for exclusive data on online CPG sales growth.
- E-Commerce: This week, we saw the proportion of consumers that are currently buying more online than they used to plunge by 15 percentage points to a new low of 58.5%, from three-quarters last week. This sharp decline could be partly due to a much lower proportion of consumers buying more of any category overall than before the crisis. However, it could also be a result of Prime Day’s distorting effect, as shoppers defer online purchases (and pull other purchases forward once Prime Day begins). We expect e-commerce to remain at an elevated level as we move toward the holiday season. See our US E-Commerce: Post-Crisis Outlook report for more data and analysis, and our US holiday survey report, publishing later this week for data on consumers’ expected holiday shopping behavior and spending.