Nitheesh NH
What’s the Story?
This report presents the results of Coresight Research’s latest weekly survey of US consumers, including on the impacts of the coronavirus outbreak, undertaken on December 8. We explore the trends we are seeing from week to week, following prior surveys on December 1, November 24, November 17, November 10, November 3, October 27, October 20, October 13, October 6, September 29, September 22, September 15, September 9, September 2, August 26, August 19, August 12, August 5, July 29, July 22, July 15, July 8, July 1, June 24, June 17, June 10, June 3, May 27, May 20, May 13, May 6, April 29, April 22, April 15, April 8, April 1, March 25 and March 17–18.Holiday-Season Shopping Update
As we approach the holiday-season homestretch, we took a final reading of consumer shopping behaviors and expectations for the holiday season. We identify trends in our findings, compared to mid-September, mid-October and mid-November findings. We asked respondents:- About their expected overall holiday-season spending this year—including gifts and expenses related to traveling and dining out—compared to 2019.
- For those who expect to spend less or are spending less this holiday season, what categories they plan to spend less or are spending less on—from 15 product and service options.
- Whether they agreed with any or all of seven attitudinal and behavioral statements related to holiday-season shopping.
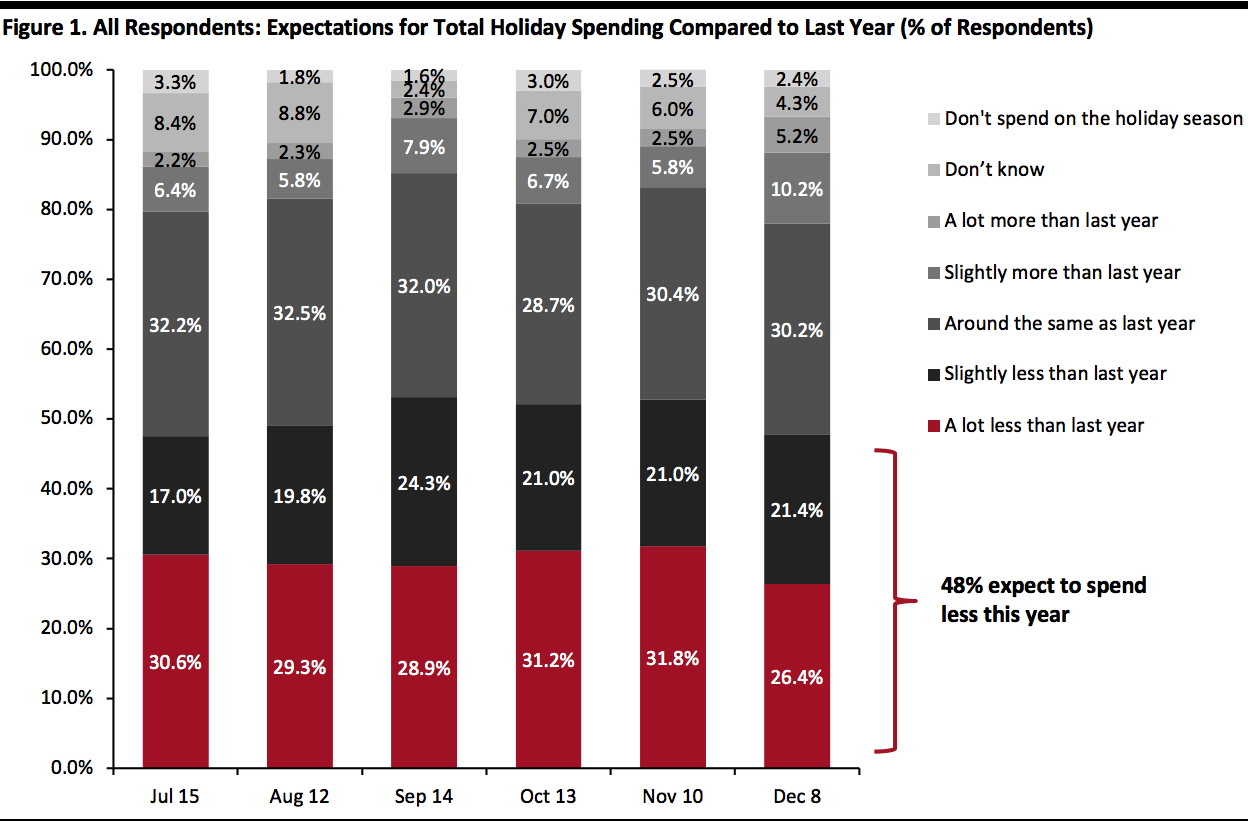 Base: US respondents aged 18+ (463 in December, 447 in November, 401 in October, 1,134 in September, 401 in August, 454 in July)
Source: Coresight Research[/caption] For those who expect their total spending to be less this holiday season, we found the following:
- Nonretail services are, once again, set to be the hardest-hit sector, especially food service. Some 48.9% said that they plan to spend less on or have spent less on dining out or going to a bar/nightclub, up by nine percentage points from 39.8% a month ago. In addition, some 38.9% of respondents expect to reduce or have reduced their spending on traveling to visit other people compared to last year, and the same proportion plan to spend less on days out or vacations.
- Nine of the 12 product categories saw slight month-over-month increases, although some are within the margin of error. Some 35.8% expect to spend less or have spent less on seasonal decorations, making it the most-cut product category for holiday 2020, reflecting the reduced number of events and parties in the context of the coronavirus pandemic this year. Apparel and electronics came in next, with almost three in 10 expecting that they plan to spend less on or have already spent less on both categories. Jewelry and watches saw the greatest decrease to 27.6% from 31.8% last month, while the beauty and home categories recorded month-over-month increases of five percentage points.
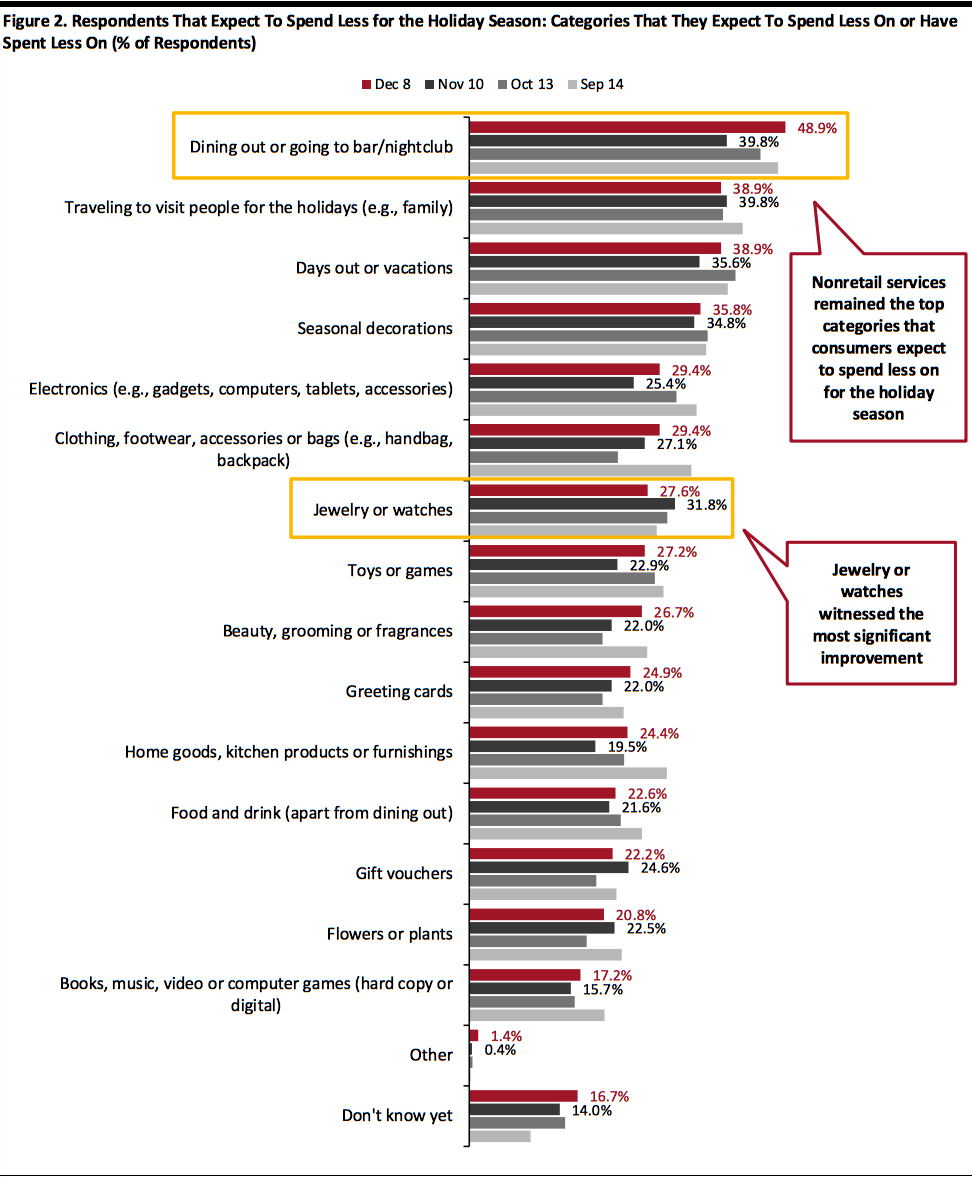 Respondents could select multiple options
Base: US respondents aged 18+ who expect to spend less on the 2020 holiday season than they did last year (221 in December, 236 in November, 209 in October, 603 in September)
Source: Coresight Research[/caption] Three in 10 Shift Their Holiday Shopping from Stores to Online Some 31.2% of holiday shoppers have shopped or are shopping from fewer stores to reduce their trips to brick-and-mortar locations, benefiting formats such as mass merchandisers and warehouse clubs that offer multi-category and multi-brand products. Three in 10 holiday shoppers have switched or are switching some or all of their holiday spending from stores to e-commerce. In responses to a separate survey question, we saw an elevated proportion of respondents (77.1%) report that they are currently buying more online than they used to (as we discuss in more detail later in this report), implying an already high e-commerce level during the holiday season. We saw a very gradual upward trend in adoption of curbside pickup services, with 23.9% reporting that they have used or are using such services. Some 22.4% of respondents have used or are using in-store pickup for some online purchases. Holiday shopping kicked off early in October this year, with the new 10.10 Shopping Festival and Amazon’s Prime Day. However, we saw a partial shift from early to late holiday shopping, compared to results from last month. Some 28.3% of holiday shoppers expect to start or have started shopping earlier than usual, down from one-third last month, versus 16.8% who expect to start or have started shopping later than usual. The near-12-percentage-point difference is the lower than previous months. This could suggest that shoppers still intend to do some last-minute shopping, presenting opportunities for brands and retailers to boost sales. [caption id="attachment_120682" align="aligncenter" width="700"]
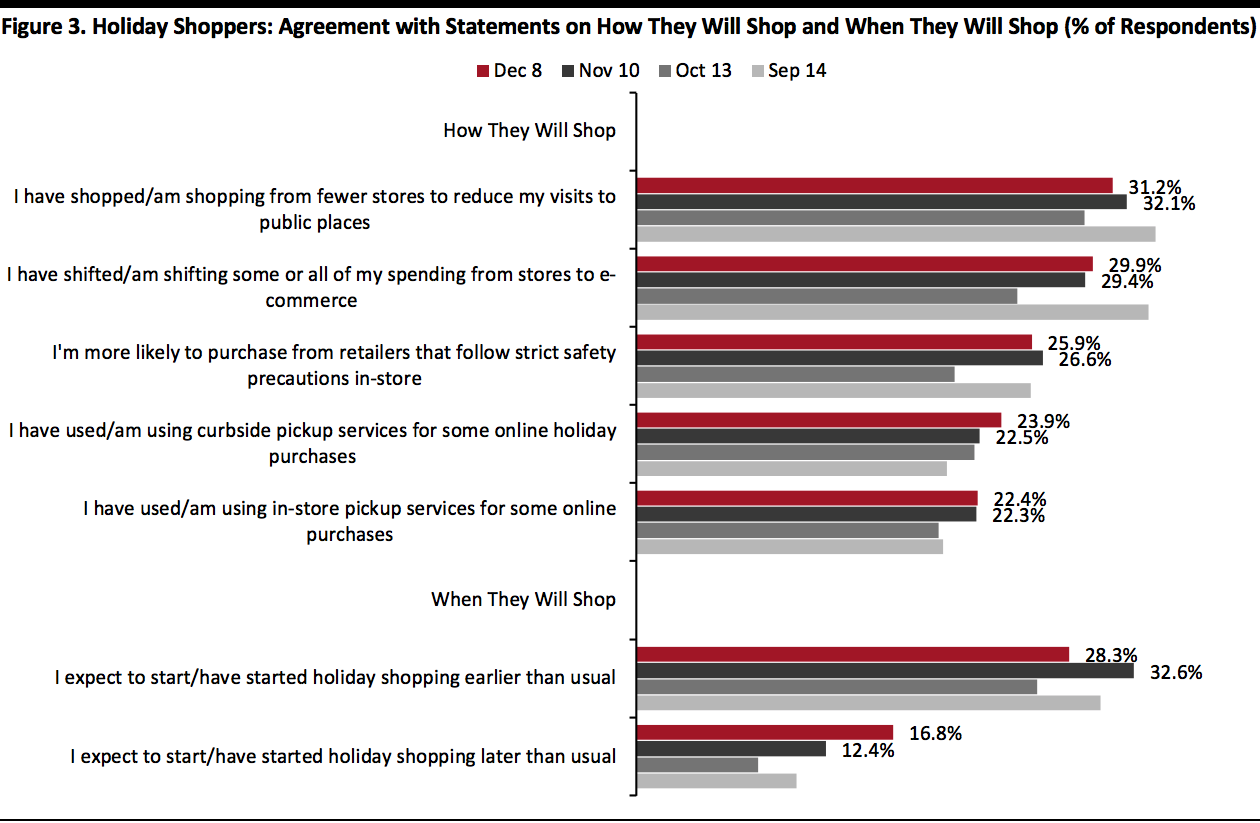 Base: US respondents aged 18+ who expect to spend on the holidays (452 in December, 436 in November, 389 in October, 1,116 in September)
Source: Coresight Research[/caption]
What Shoppers Are Doing and Where They Are Going
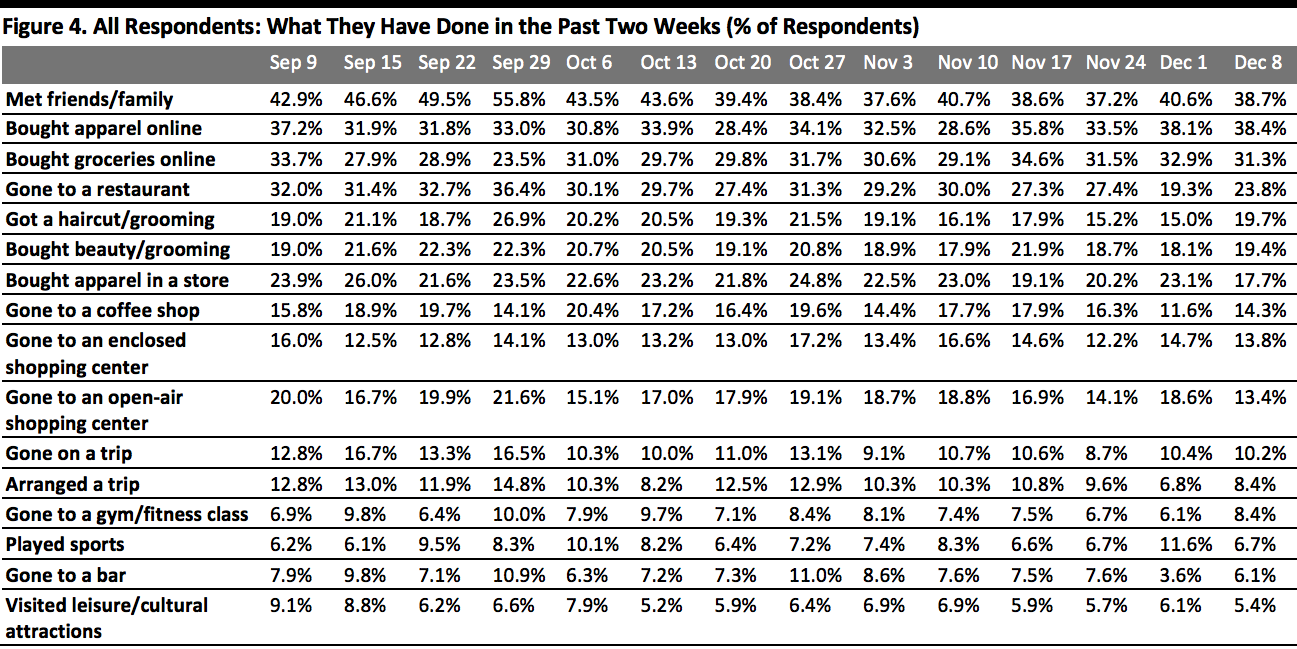
More Consumers Had Bought Apparel Online in the Past Two Weeks Each week, we ask consumers what they have done in the past two weeks. This week, the proportion of respondents slightly increased for seven of the 16 options we provided for recent activities. Some of the week-over-week changes were within the margin of error; however, the directional trends, including over a number of weeks, can prove informative. Following the recent Thanksgiving weekend, we saw a slight rebound in visits to food-service locations, while consumers reduced their in-store shopping:- Online apparel retained its popularity this week, with 38.4% of respondents reporting that they had bought clothing, footwear or accessories online— broadly level with last week. On the other hand, in-store apparel shopping dropped by five percentage points, from 23.1% last week to 17.7% this week—the lowest since September. The difference between online and in-store apparel shopping also jumped to a record high of 20-percentage-points, reflecting consumers’ strong preference for shopping apparel online during the holiday season.
- Visits to food-service locations rebounded slightly after falling significantly last week, although levels still remained low compared to November. Some 23.8% had gone to a restaurant, up by almost five percentage points from 19.3% in the previous week. Some 14.3% had gone to a coffee shop, versus 11.6% last week. Online groceries returned to the level we saw two weeks ago, at 31.3% this week.
- Both open-air and enclosed shopping centers saw declines in the proportion of respondents making visits this week. Some 13.4% had visited an open-air shopping center, down by five percentage points from last week and the lowest level since August. Roughly the same proportion (13.8%) had gone to an enclosed shopping center, compared to 14.7% last week. The low percentage is aligned with the high avoidance rate in such locations, which we discuss later in this report.
 Respondents could select multiple options
Base: US respondents aged 18+
Source: Coresight Research[/caption]
Slightly More Consumers Expect To Buy Apparel In-Store than Actual Behavior Indicates
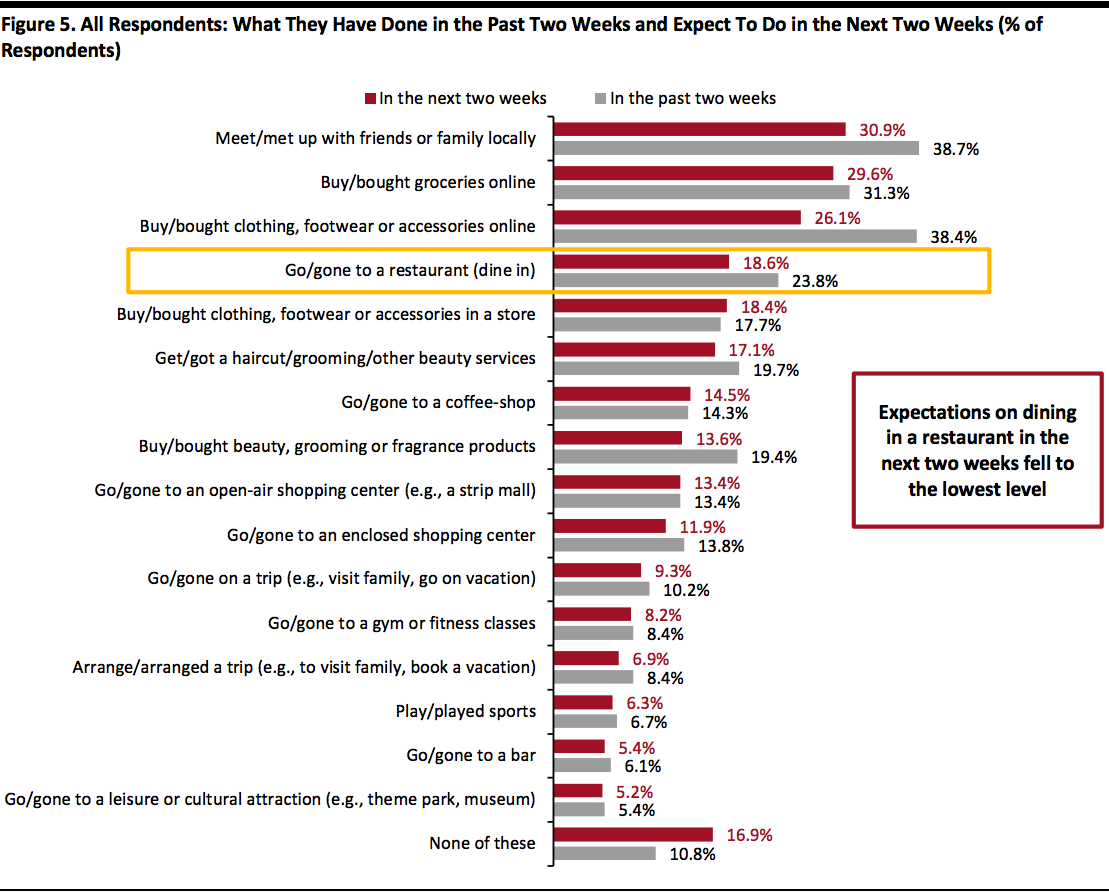
Each week, we also ask consumers what they expect to do in the next two weeks, with a set of options comparable to those for the last two weeks. In Figure 5, we compare these short-term expectations with recent actual behavior. We saw slightly lower proportions of consumers expecting to do half of the 16 options that we provided for activities in the next two weeks than actual behavior in the past two weeks. For the next two weeks, expectations on visits to food-service locations and shopping centers remained low:- Online grocery shopping continued to be the top spending-related activity that consumers expect to do in the next two weeks, with the proportion planning to do as in the next two weeks slightly lower than recent actual behavior indicates. The proportion that plan to dine in a restaurant is five percentage points below the actual behavior indications and is the lowest expected level since we started asking this survey question.
- The proportion of respondents that expect to buy clothing or footwear online came in at 26.1%, versus one-quarter last week and one-fifth two weeks ago. Expectations on purchasing apparel in-store also increased slightly week over week: Some 18.4% of respondents plan to make purchases in the category in a store, versus 16.1% last week. This expected metric is also higher than the actual behavior in the past two weeks. Based on past survey results, we expect to see higher proportions in actual behavior for online apparel shopping than expected levels next week.
- Expectations to visit shopping centers remained low—some 13.4% plan to go to an open-air shopping center and only 11.9% expect to go to an enclosed shopping center.
 Respondents could select multiple options
Base: US respondents aged 18+
Source: Coresight Research[/caption]
Over Eight in 10 Are Currently Avoiding Public Places
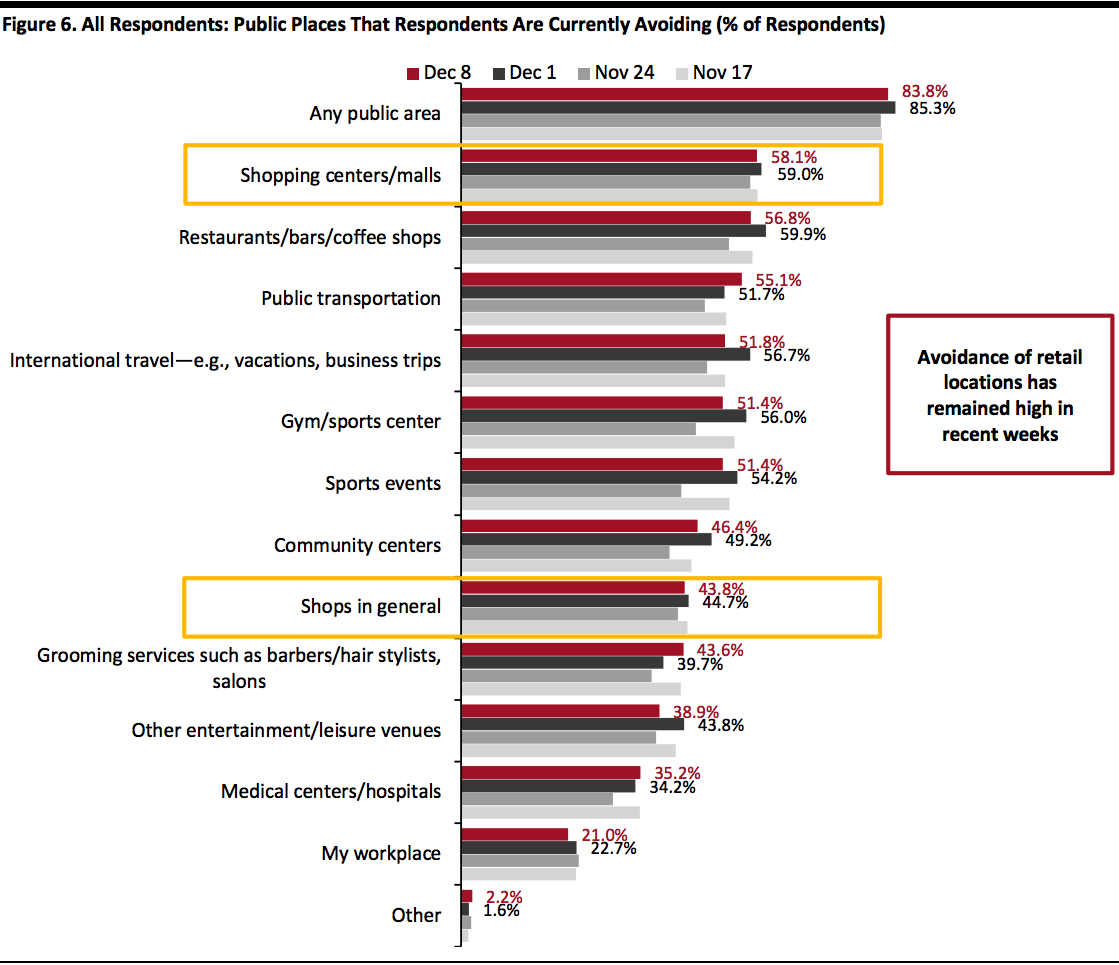
This week, the avoidance rate of any type of public area stood at 83.8%, versus 85.3% last week. The avoidance rate has been high at over 80% over the past few weeks, as Covid-19 cases continue to soar nationwide. However, we saw week-over-week decreases in avoidance for roughly half of the 13 options provided, although some changes were within the margin of error. Avoidance of retail locations remained high, while avoidance of food-service locations fell slightly this week:- The proportion of respondents that are currently avoiding shopping centers/malls broadly leveled with last week, at 58.1%. This location continues to be the most-avoided type of public place.
- Avoidance of shops in general stood at 43.8%, fairly consistent with the proportion last week. The high avoidance in both shopping centers/malls and shops in general is aligned with the increasing online shopping level, which we discuss later in the report.
- Food-service locations saw a slight decline in week-over-week avoidance, from 59.9% last week to 56.8% this week.
- Other entertainment or leisure venues saw the largest week-over-week decrease in avoidance of five percentage points.
 Respondents could select multiple options
Base: US respondents aged 18+
Source: Coresight Research[/caption]
Reviewing Trend Data in Current Purchasing Behavior
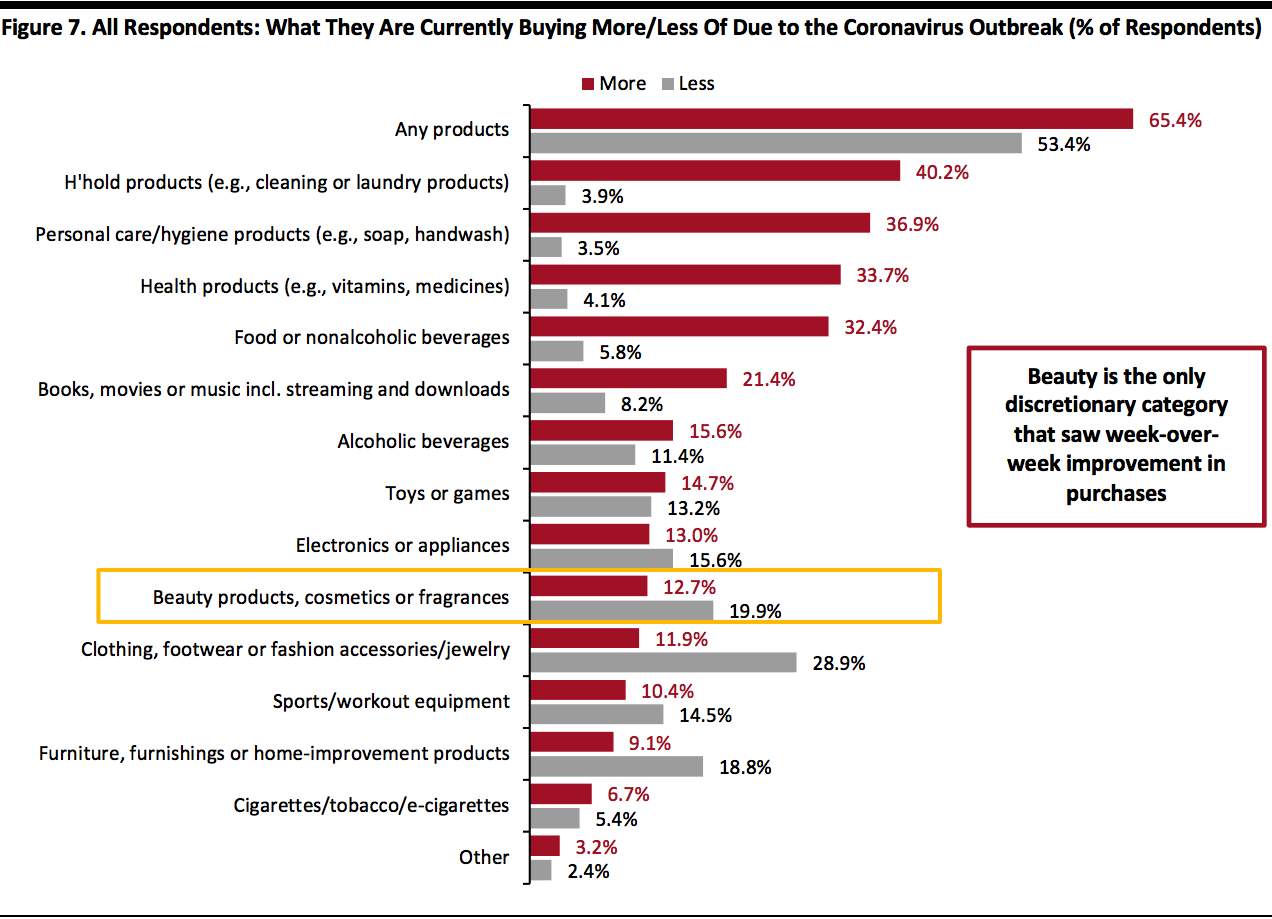
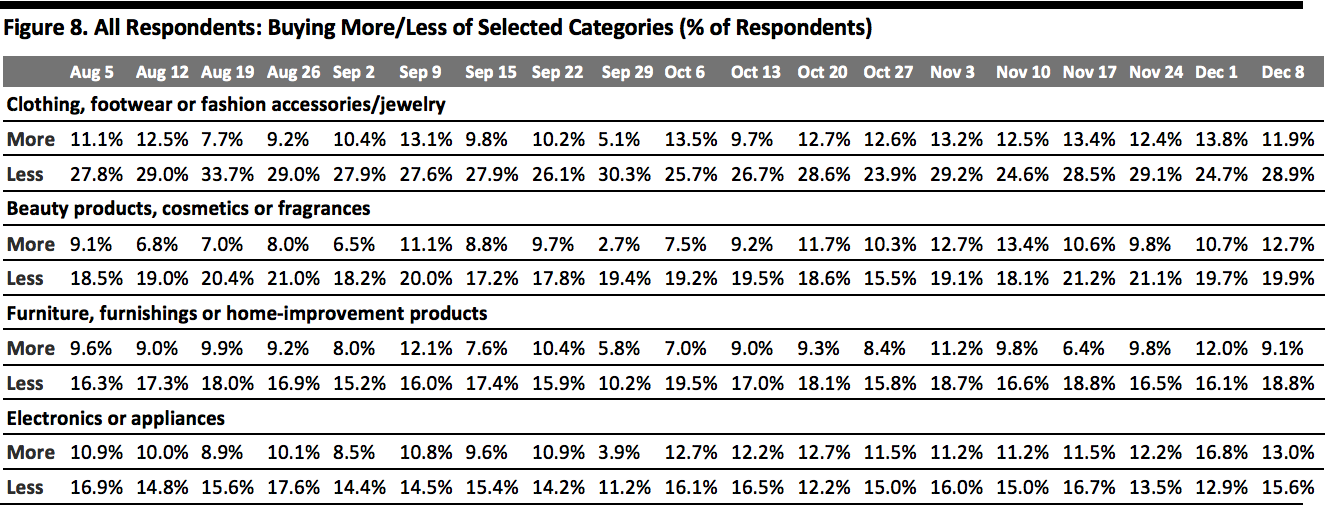
What Consumers Are Currently Buying More Of and Less Of This week, we continue to see a stable proportion of consumers currently buying more of any type of product versus the previous two weeks, at 65%. The proportion of respondents that are currently buying less of any product than pre-crisis returned to the level we saw two weeks ago, at 53.4%, compared to 51.7% last week.- Buying more in any category and buying less in any category were not mutually exclusive options, so respondents could answer yes to both.
- The ratio for clothing and footwear returned to the metric we saw two weeks ago at 2.4, compared to its lowest level of 1.8 last week.
- The ratio for electronics also bounced back after reaching a record low of below 1 last week. The ratio stood at 1.2, versus 0.8 last week and 1.1 two weeks before.
- The ratio for the home category went up to 2.1, from 1.3 last week.
- The ratio for beauty slid to 1.6, from 1.9 last week and 2.2 two weeks ago.
 Respondents could select multiple options
Base: US respondents aged 18+
Source: Coresight Research[/caption] [caption id="attachment_120687" align="aligncenter" width="700"]
 Base: US respondents aged 18+
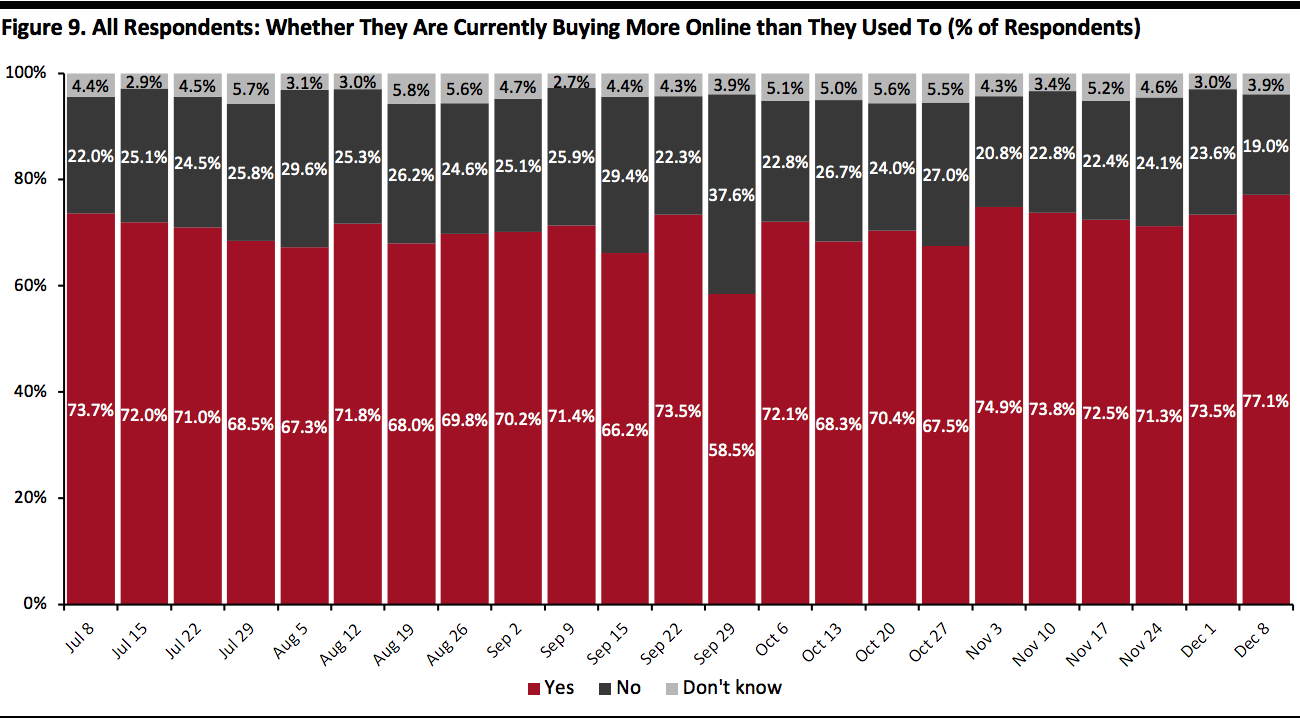
Source: Coresight Research[/caption] Over Three-Quarters Are Switching Spending Online The proportion of consumers buying more online than they used to jumped from 73.5% to 77.1%, the highest level since we started asking this question in April. The high e-commerce level is aligned with high avoidance rate, as discussed earlier. Moreover, the levels we saw in recent weeks confirms the solid demand for online shopping this holiday season. [caption id="attachment_120688" align="aligncenter" width="700"]
 Base: US respondents aged 18+
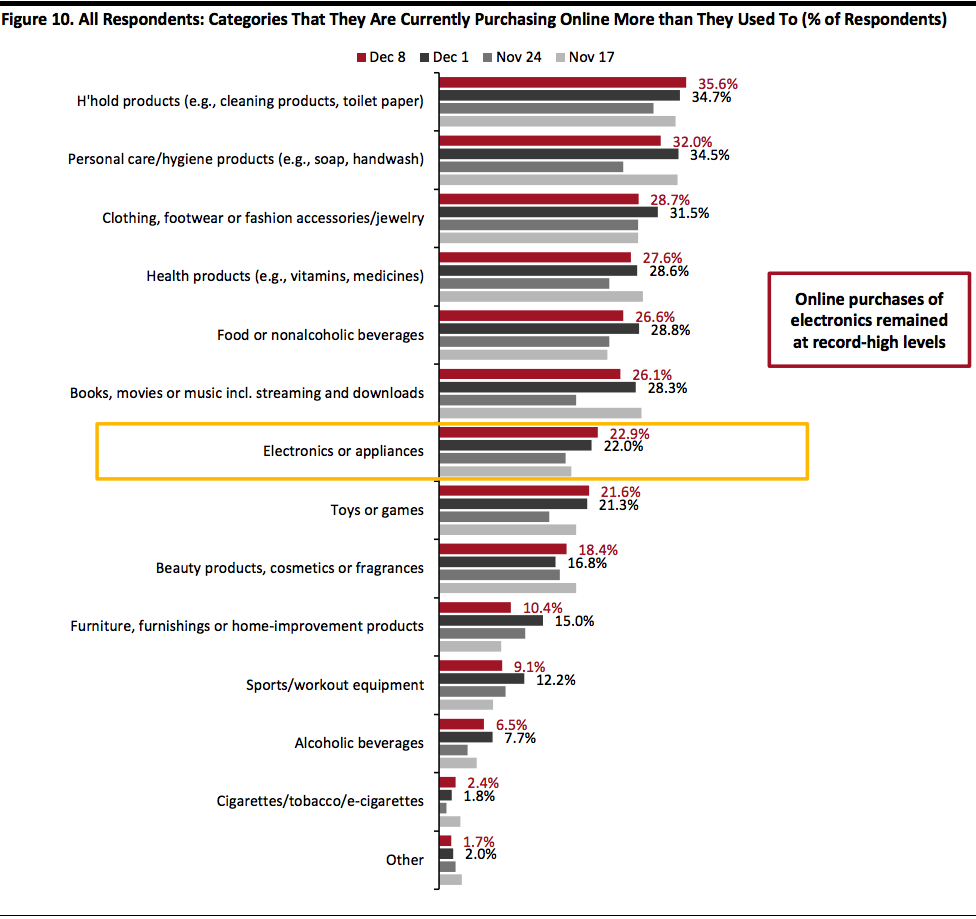
Source: Coresight Research[/caption] What Consumers Are Currently Buying More Of Online Looking at specific categories, around half of the 13 options we provided saw week-over-week decreases in consumers buying more online than pre-crisis, although all of the changes were within the margin of error. Household and personal care products continue to top the list of most-purchased products online, with some 35.6% currently buying more household products and 32.0% purchasing more personal care products online than they used to. The proportion that are buying more food online than they used to fell slightly to 26.6%, from the record high of 28.8% last week. Among discretionary categories, online purchases of home products saw the largest week-over-week decline, of five percentage points, to 10.4% this week. The proportion of consumers buying more clothing and footwear then pre-crisis also fell back to the level two weeks ago. Online purchase of electronics remained high at 22.9%, despite the week-over-week decrease in the proportion that are buying more in this category overall. [caption id="attachment_120689" align="aligncenter" width="700"]
 Respondents could select multiple options
Base: US respondents aged 18+
Source: Coresight Research[/caption]
What We Think
As we head into the holiday homestretch, we are seeing slightly more consumers expecting to start or have started holiday shopping later than usual, compared to the results from a month ago. This could present further opportunities for brands and retailers to capture more last-minute holiday purchases than may have been previously expected. Encouragingly, consumers’ holiday spending intentions improved this month. Fewer respondents said that they expect to spend less than last year, and some 15.3% expect to spend more for the holiday season, up by seven percentage points from last month to the highest level we have seen. This week, we saw the following from our recurring weekly questions:- Apparel: Following the Thanksgiving weekend, when we saw strong improvement in apparel purchases, demand for this category slowed slightly. The ratio of buying less to more than pre-crisis for apparel increased week over week. Apparel purchases were made disproportionately online: 38.4% of respondents reported that they had bought apparel online, more than doubled the proportion that had bought apparel in-store (17.7%) in the past two weeks.
- Online Grocery: Showing great resilience, it looks like this trend is here to stay. This week, the proportion of shoppers that had bought groceries online stood at 31.3%, versus one-third last week. Looking at the metrics since October, we see a consistent trend of roughly 30% having bought groceries online in the latest two-week period. This supports our expectation of 60+% year-over-year growth in online food sales during the holiday period. Our latest monthly US CPG Sales Tracker recorded an upward trend in year-over-year growth rates of online food sales.
- E-Commerce: Over the past few weeks, we have seen a consistent proportion of over 70% of consumers buying more online than they used to. This week, the proportion surged to 77.1%—the highest level since we started asking this question in April. In the nearer term, we also saw that three in 10 consumers expect to switch or have switched some or all of their holiday spending from stores to e-commerce. As consumers continue to avoid shopping centers/malls and shops in general, the online shopping level could remain elevated in the next few weeks. We expect total online sales to climb by around one-third in the holiday season. Read Our Predictions for a Digital December report for analysis of recent traffic trends and online sales during holiday 2020. Read our US E-Commerce: Post-Crisis Outlook report for more e-commerce data and analysis.