Nitheesh NH
Executive Summary
Coresight Research expects store closures in 2019 to look a lot like store closures in 2017–2018.
Surprisingly, extreme disruption continues in the retail sector amid a time of bounty. According to the recent forecast from the National Retail Federation (NRF), U.S. retail sales grew 4.6% in 2018, exceeding its 4.5% forecast, and the NRF forecasts that retail sales will grow 3.8–4.4% in 2019, both ahead of the Fed’s estimate for U.S. GDP of 3.0% in 2018 and forecast of 2.3% in 2019. The near-perfect state of U.S. employment, income, and GDP has led many to conclude that the current environment represents “peak retail,” i.e., this is the best environment that retail sales can experience within the constraints of the U.S. economy.
Despite this near-ideal environment, its benefits are not being enjoyed equally, with some retailers flourishing and others languishing. In stark contrast to the NRF’s projection of a 4.3-4.8% increase in holiday sales, several major department stores posted holiday sales gains of under 1.5%, although Target posted a sales gain of 5.7%.
At the time of this report’s writing, five companies in the consumer discretionary sector have filed for bankruptcy, Sears was working its way through the bankruptcy process, and there are expectations of other large retailers filing for Chapter 11 in the coming months.
One and a half months into 2019, U.S. retailers have announcements of 1,678 store closures, which, annualized, would equal roughly double the 5,500-7,000 store closures announced in 2017-2018.
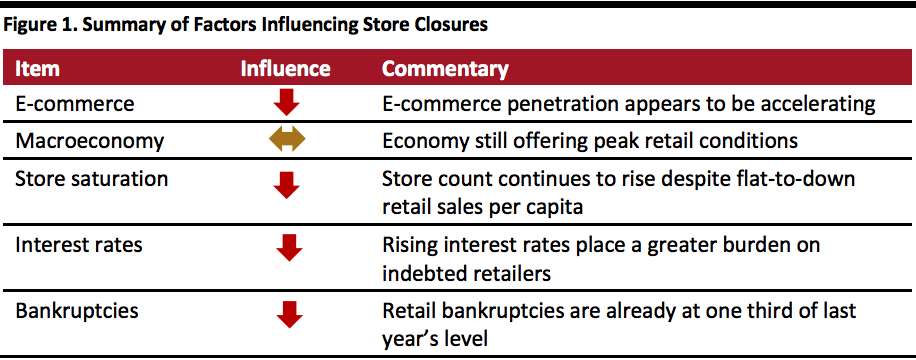
The flood of store closures will likely continue for quite some dime due to the following factors:
 Source: Coresight Research[/caption]
Year-to-Date Store Closings
There have been 2,187 U.S. store closing announcements thus far in 2019, with Gymboree (749) and Ascena Retail (400) accounting for more than half the total. This year’s total is up 23% from the 1,776 announcements a year ago. Year-to-date, retailers have announced 1,411 store openings, offsetting 65% of store closures.
[caption id="attachment_75311" align="aligncenter" width="620"]
Source: Coresight Research[/caption]
Year-to-Date Store Closings
There have been 2,187 U.S. store closing announcements thus far in 2019, with Gymboree (749) and Ascena Retail (400) accounting for more than half the total. This year’s total is up 23% from the 1,776 announcements a year ago. Year-to-date, retailers have announced 1,411 store openings, offsetting 65% of store closures.
[caption id="attachment_75311" align="aligncenter" width="620"]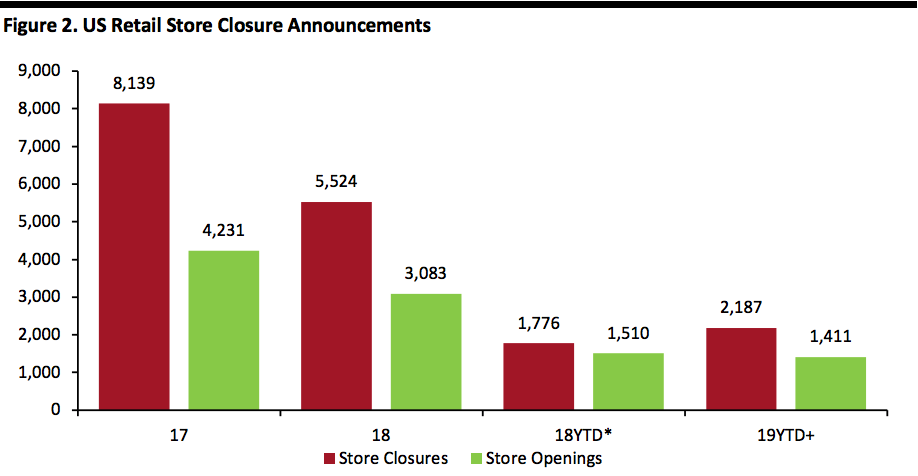 * Through 2/9/18.
+ Through 2/8/19.
Source: Company reports/Coresight Research.[/caption] U.S. store closures in 2018 were led by apparel specialist stores, with 766 closures, whereas general-merchandise stores (led by dollar stores) led store openings in the year. Figure 9 in the appendix illustrates 2018 store openings by sector side-by-side. Drivers of Store Closings There are several reasons a retailer might want to close stores, even simply for profit-margin maximization. Below, we discuss the key drivers of U.S. retail closings, which include: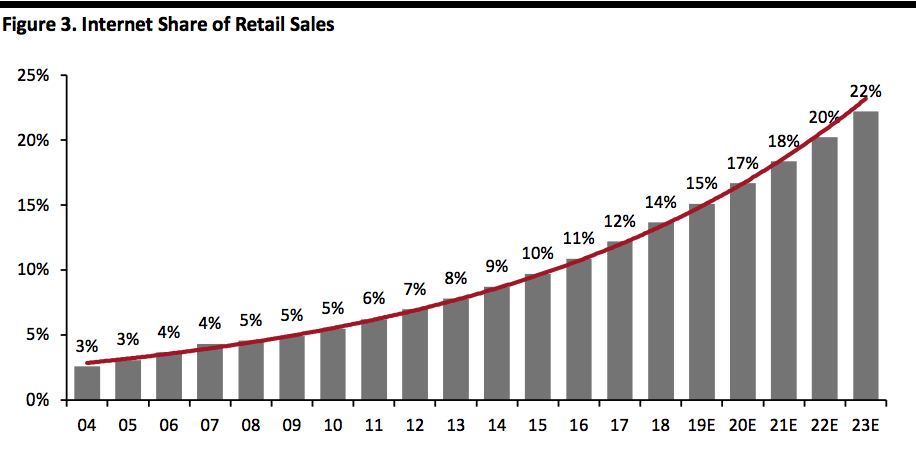 Source: Euromonitor International/Coresight Research.[/caption]
The US Remains Overstored
The U.S. has significantly more retail space per person than most countries, with 23.5 square feet per capita versus 16.4 square feet in Canada and 11.1 in Australia, according to a 2016 report from Morningstar.
The figure below shows a dramatic increase in U.S. retail outlets during 2004–2017, which retreated during the Global Financial Crisis, before increasing again and setting new records starting in 2015. At the same time, in-store retail sales per capita declined sharply through 2009 and have been flattish, though with some ups and downs, with declines during 2016–2018.
[caption id="attachment_75333" align="aligncenter" width="620"]
Source: Euromonitor International/Coresight Research.[/caption]
The US Remains Overstored
The U.S. has significantly more retail space per person than most countries, with 23.5 square feet per capita versus 16.4 square feet in Canada and 11.1 in Australia, according to a 2016 report from Morningstar.
The figure below shows a dramatic increase in U.S. retail outlets during 2004–2017, which retreated during the Global Financial Crisis, before increasing again and setting new records starting in 2015. At the same time, in-store retail sales per capita declined sharply through 2009 and have been flattish, though with some ups and downs, with declines during 2016–2018.
[caption id="attachment_75333" align="aligncenter" width="620"]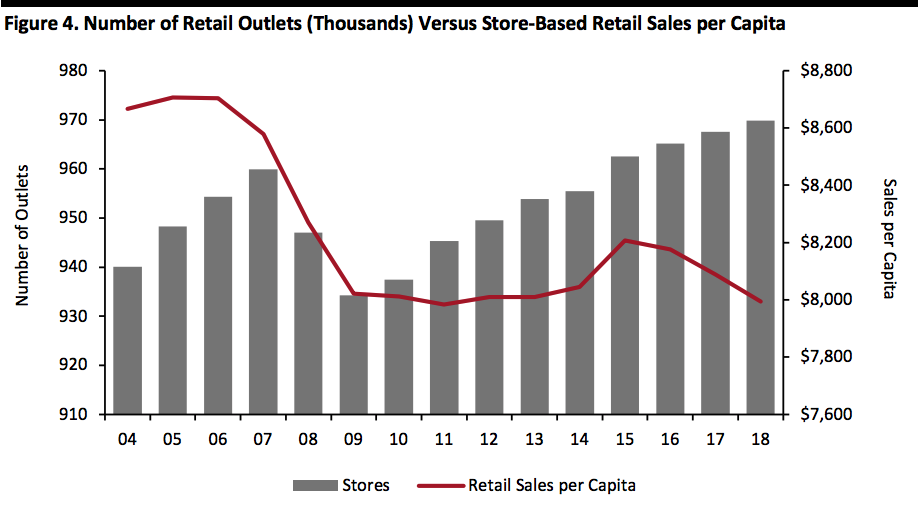 Note: Figures in fixed 2018 dollars.
Source: Euromonitor International.[/caption] High Debt Levels in a Rising Interest-Rate Environment Debt is a double-edged sword: Companies (and retailers) can access cheap funding when economies are strong and lending standards are loosened, and debt is a primary financing medium for private equity. However, debt can come back to bite a company during an economic downturn, or in a dynamic environment under pressure, such as e-commerce’s relentless attack on retail. The figure below shows interest coverage ratios for selected retailers, grouped by sector. The metric is defined as earnings before interest and taxes (EBIT), divided by total interest payable, also known as times interest earned representing the number of times operating earnings can pay interest expense. A ratio below 2.0 is considered a warning sign, and a ratio below 1.0 indicates that a company has insufficient operating earnings to cover its interest payments, and there are four retailers in the graph that have interest-coverage ratios below 1.0. Retailers with negative operating earnings are not included in the graph, and their outlooks are even more unfavorable. [caption id="attachment_75336" align="aligncenter" width="620"]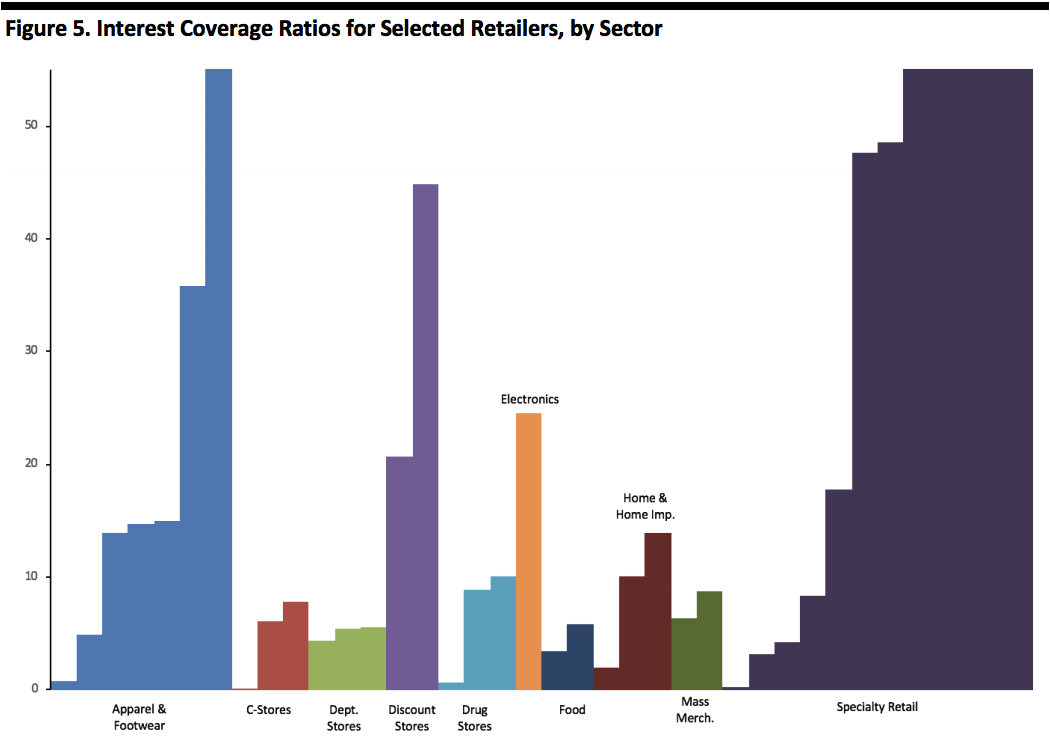 Note: Each vertical bar represents one company within its respective segment. The graph has been truncated at the high end to improve readability.
Source: Bloomberg/Coresight Research.[/caption] In the current environment of rising interest rates, retailers with insufficient operating earnings will face challenges making payments on their debt. After several years of near-0% interest rates aimed at combating the Global Financial Crisis (GFC), the U.S. Federal Reserve has embarked on a steady stream of interest rate increases, raising the benchmark for federal funds to 2.25-2.5%, still above the 2.40% in January 2019. The language from the most recent Fed meeting in January 2019 called for being “patient” on future rate hikes, following previous plans for two subsequent rate hikes in 2019. These targets were based on the Fed’s estimate for 3% GDP growth in 2018 and 2.3% in 2019 (down 20 basis points from the previous estimate), alongside a long-run estimate for GDP growth of 1.9% (up 10 basis points from the previous estimate). The graph below shows the roughly 200-basis point rise in interest rates from 0.41% in November 2016 to 2.40% currently. [caption id="attachment_75337" align="aligncenter" width="620"]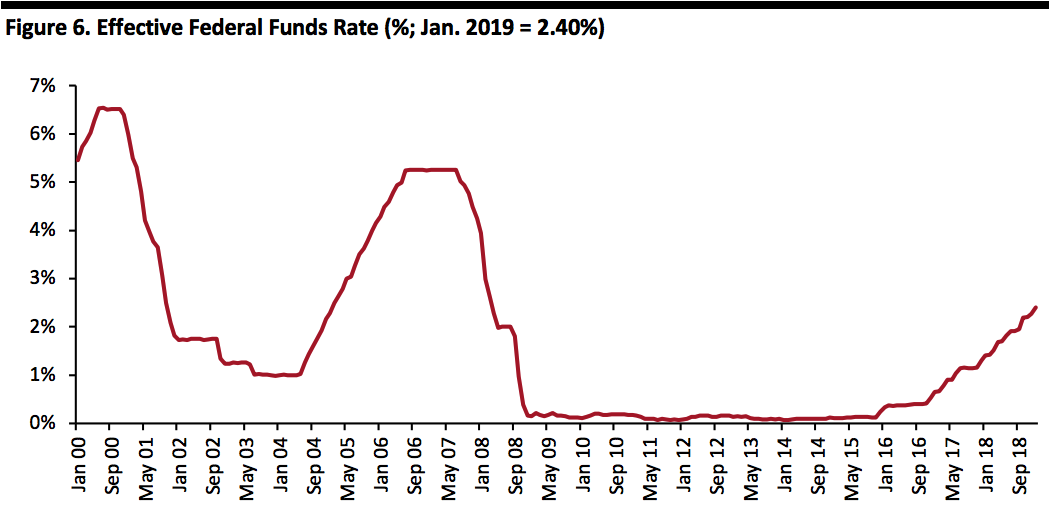 Source: Board of Governors of the Federal Reserve System (U.S.).[/caption]
The Multiplier Effect of Bankruptcies
Bankruptcies in the consumer discretionary sector numbered in the single digits during 2013–2016. However, the total climbed into the teens during 2017–2018, and there have been five filings year to date, according to Bloomberg data. The figure below shows the number of bankruptcies in the consumer discretionary sector from 2013 through year-to-date.
[caption id="attachment_75340" align="aligncenter" width="620"]
Source: Board of Governors of the Federal Reserve System (U.S.).[/caption]
The Multiplier Effect of Bankruptcies
Bankruptcies in the consumer discretionary sector numbered in the single digits during 2013–2016. However, the total climbed into the teens during 2017–2018, and there have been five filings year to date, according to Bloomberg data. The figure below shows the number of bankruptcies in the consumer discretionary sector from 2013 through year-to-date.
[caption id="attachment_75340" align="aligncenter" width="620"]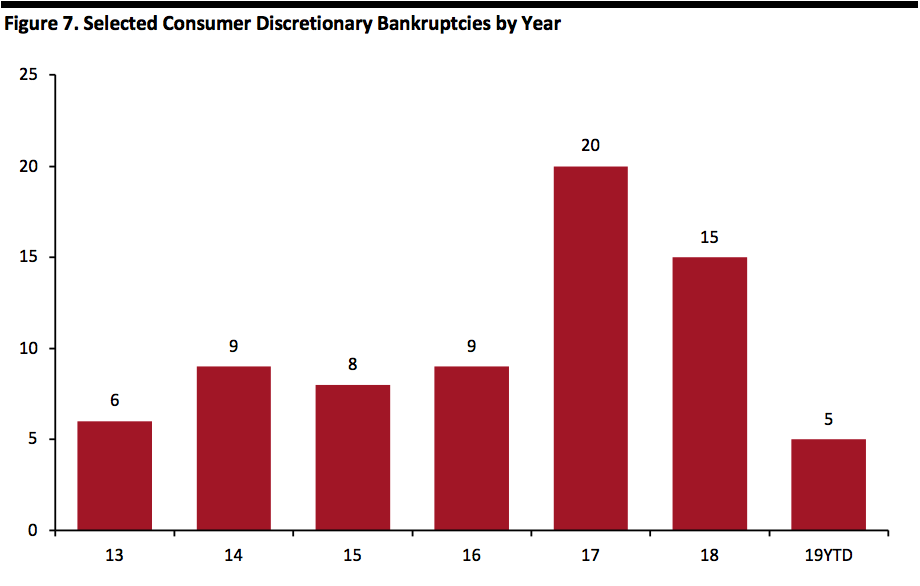 Note: Excludes automotive, restaurants and professional services.
Source: Bloomberg.[/caption] The table below lists year-to-date bankruptcy filings. [caption id="attachment_75341" align="aligncenter" width="620"]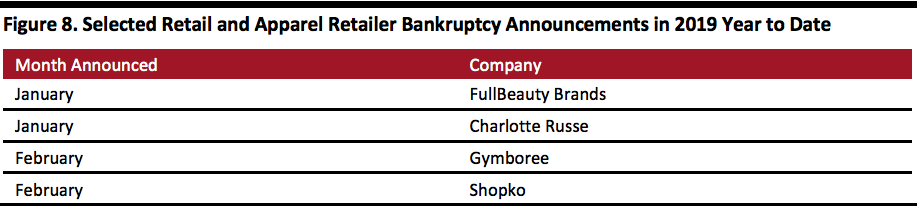 Source: Bloomberg[/caption]
Conclusion
U.S. store closure announcements continued in 2018, despite the year being a banner one for retail. Store closure announcements are also off to a strong start in 2019, up 23% from the same time a year ago, on the heels of this positive year and despite forecasts of another year of healthy retail sales. Factors driving store closure announcements — in addition to profit-margin enhancement — include the continuing encroachment of e-commerce into retail, continuing to open new stores despite flattish retail sales per capita, rising U.S. interest rates (which puts increasing pressure on retailers with high debt loads) and the continuation of a high level of retail bankruptcies, with the annualized number of filings year-to-date in 2019 already outpacing the number in 2018.
Appendix
[caption id="attachment_75342" align="aligncenter" width="620"]
Source: Bloomberg[/caption]
Conclusion
U.S. store closure announcements continued in 2018, despite the year being a banner one for retail. Store closure announcements are also off to a strong start in 2019, up 23% from the same time a year ago, on the heels of this positive year and despite forecasts of another year of healthy retail sales. Factors driving store closure announcements — in addition to profit-margin enhancement — include the continuing encroachment of e-commerce into retail, continuing to open new stores despite flattish retail sales per capita, rising U.S. interest rates (which puts increasing pressure on retailers with high debt loads) and the continuation of a high level of retail bankruptcies, with the annualized number of filings year-to-date in 2019 already outpacing the number in 2018.
Appendix
[caption id="attachment_75342" align="aligncenter" width="620"]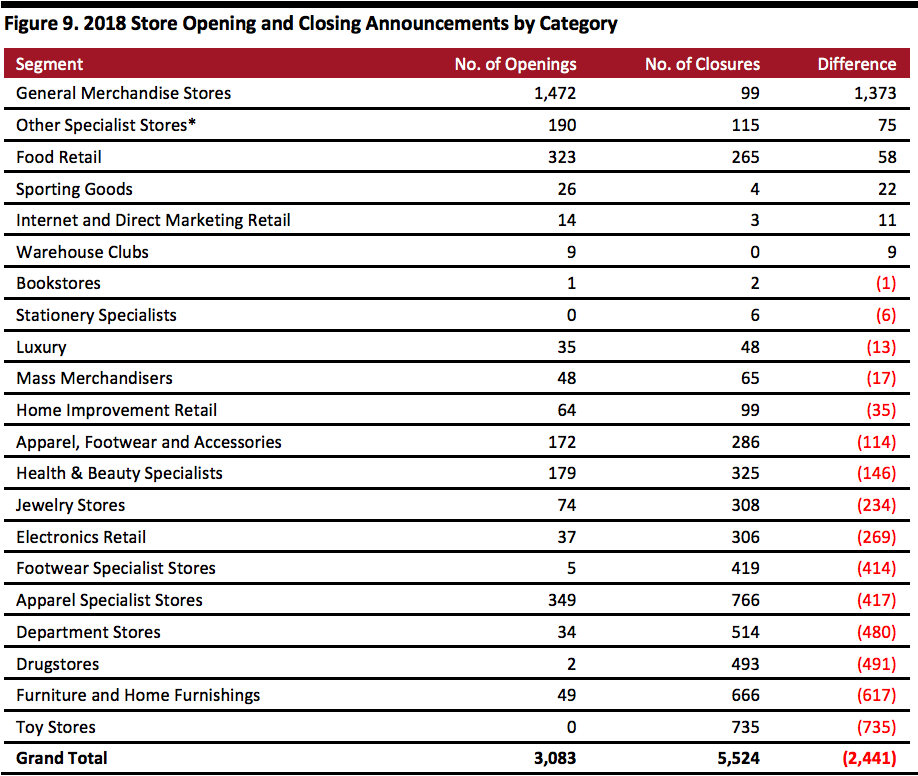 Note: *Includes niche retailers such as frames seller Aaron Brothers, camping gear retailer Camping World, outdoor activity retailer Gander Outdoors and crafts retailer Hobby Lobby.
Source: Company reports/Coresight Research.[/caption]
- E-commerce continuing to take share from brick-and-mortar retail.
- A continuing excess of store locations in the U.S. (exacerbated by item #1).
- Weak financial conditions among retailers, owning to high debt levels.
Source: Coresight Research[/caption]
Year-to-Date Store Closings
There have been 2,187 U.S. store closing announcements thus far in 2019, with Gymboree (749) and Ascena Retail (400) accounting for more than half the total. This year’s total is up 23% from the 1,776 announcements a year ago. Year-to-date, retailers have announced 1,411 store openings, offsetting 65% of store closures.
[caption id="attachment_75311" align="aligncenter" width="620"] * Through 2/9/18.+ Through 2/8/19.
Source: Company reports/Coresight Research.[/caption] U.S. store closures in 2018 were led by apparel specialist stores, with 766 closures, whereas general-merchandise stores (led by dollar stores) led store openings in the year. Figure 9 in the appendix illustrates 2018 store openings by sector side-by-side. Drivers of Store Closings There are several reasons a retailer might want to close stores, even simply for profit-margin maximization. Below, we discuss the key drivers of U.S. retail closings, which include:
- The relentless encroachment of e-commerce
- An excess of stores in the U.S.
- Over-indebtedness or retailers
Source: Euromonitor International/Coresight Research.[/caption]
The US Remains Overstored
The U.S. has significantly more retail space per person than most countries, with 23.5 square feet per capita versus 16.4 square feet in Canada and 11.1 in Australia, according to a 2016 report from Morningstar.
The figure below shows a dramatic increase in U.S. retail outlets during 2004–2017, which retreated during the Global Financial Crisis, before increasing again and setting new records starting in 2015. At the same time, in-store retail sales per capita declined sharply through 2009 and have been flattish, though with some ups and downs, with declines during 2016–2018.
[caption id="attachment_75333" align="aligncenter" width="620"] Note: Figures in fixed 2018 dollars.Source: Euromonitor International.[/caption] High Debt Levels in a Rising Interest-Rate Environment Debt is a double-edged sword: Companies (and retailers) can access cheap funding when economies are strong and lending standards are loosened, and debt is a primary financing medium for private equity. However, debt can come back to bite a company during an economic downturn, or in a dynamic environment under pressure, such as e-commerce’s relentless attack on retail. The figure below shows interest coverage ratios for selected retailers, grouped by sector. The metric is defined as earnings before interest and taxes (EBIT), divided by total interest payable, also known as times interest earned representing the number of times operating earnings can pay interest expense. A ratio below 2.0 is considered a warning sign, and a ratio below 1.0 indicates that a company has insufficient operating earnings to cover its interest payments, and there are four retailers in the graph that have interest-coverage ratios below 1.0. Retailers with negative operating earnings are not included in the graph, and their outlooks are even more unfavorable. [caption id="attachment_75336" align="aligncenter" width="620"]
Note: Each vertical bar represents one company within its respective segment. The graph has been truncated at the high end to improve readability.Source: Bloomberg/Coresight Research.[/caption] In the current environment of rising interest rates, retailers with insufficient operating earnings will face challenges making payments on their debt. After several years of near-0% interest rates aimed at combating the Global Financial Crisis (GFC), the U.S. Federal Reserve has embarked on a steady stream of interest rate increases, raising the benchmark for federal funds to 2.25-2.5%, still above the 2.40% in January 2019. The language from the most recent Fed meeting in January 2019 called for being “patient” on future rate hikes, following previous plans for two subsequent rate hikes in 2019. These targets were based on the Fed’s estimate for 3% GDP growth in 2018 and 2.3% in 2019 (down 20 basis points from the previous estimate), alongside a long-run estimate for GDP growth of 1.9% (up 10 basis points from the previous estimate). The graph below shows the roughly 200-basis point rise in interest rates from 0.41% in November 2016 to 2.40% currently. [caption id="attachment_75337" align="aligncenter" width="620"]
Source: Board of Governors of the Federal Reserve System (U.S.).[/caption]
The Multiplier Effect of Bankruptcies
Bankruptcies in the consumer discretionary sector numbered in the single digits during 2013–2016. However, the total climbed into the teens during 2017–2018, and there have been five filings year to date, according to Bloomberg data. The figure below shows the number of bankruptcies in the consumer discretionary sector from 2013 through year-to-date.
[caption id="attachment_75340" align="aligncenter" width="620"] Note: Excludes automotive, restaurants and professional services.Source: Bloomberg.[/caption] The table below lists year-to-date bankruptcy filings. [caption id="attachment_75341" align="aligncenter" width="620"]
Source: Bloomberg[/caption]
Conclusion
U.S. store closure announcements continued in 2018, despite the year being a banner one for retail. Store closure announcements are also off to a strong start in 2019, up 23% from the same time a year ago, on the heels of this positive year and despite forecasts of another year of healthy retail sales. Factors driving store closure announcements — in addition to profit-margin enhancement — include the continuing encroachment of e-commerce into retail, continuing to open new stores despite flattish retail sales per capita, rising U.S. interest rates (which puts increasing pressure on retailers with high debt loads) and the continuation of a high level of retail bankruptcies, with the annualized number of filings year-to-date in 2019 already outpacing the number in 2018.
Appendix
[caption id="attachment_75342" align="aligncenter" width="620"] Note: *Includes niche retailers such as frames seller Aaron Brothers, camping gear retailer Camping World, outdoor activity retailer Gander Outdoors and crafts retailer Hobby Lobby.Source: Company reports/Coresight Research.[/caption]