
Web Developers
This report provides an overview of the evolution and current landscape with a focus on retail REITs.
Introduction
The environment for REITs (companies that own, finance or manage real estate) in the US has changed significantly over the past few years, after being marked by some heady highs in previous decades. This report examines US REITs, with a primary focus on retail REITs. It provides some perspective on the historical factors that led to the current environment and examines the future outlook for US retail REITs.How It All Began
REITs in the US date back to 1960, when Congress enacted the Real Estate Investment Trust Act to enable all kinds of investors to access large-scale, diversified portfolios of income-producing real estate. This legislation gave rise to an investment vehicle that combined aspects of real estate and stock-based investments. Since then, REITs have evolved significantly, and the US model has been the inspiration for various other REIT models across the world.A Slow and Steady Evolution for US REITs
Although the first REIT was formed in 1961, it took a while for REITs to catch on and gain acceptance as a sustainable asset class. The 1980s set the tone for the current industry. During that decade, the real estate market in the US saw a boom followed by a bust. Property values declined in the latter half of the decade, driven by overbuilding and the Tax Reform Act of 1986, which eliminated some key tax advantages to investing in REITs. This decline translated into a great opportunity for REITs, and they began acquiring properties at economical rates, which facilitated their positive market performance. The S&P US REIT Index delivered an average annualized return of approximately 20% from 1991 to 1993. Amid growing demand for their shares, several REITs converted from private entities to public companies in order to leverage the high valuations that they were able to draw. Some of today’s leading REITs, such as Simon Property Group, Duke Realty and Kimco Realty, went public in the early 1990s. In 1994, the US REIT industry’s market capitalization soared to roughly $44 billion, which was almost six times higher than in 1990. Today, the US REIT industry (including non-retail REITs) has a total market capitalization of more than $1 trillion and holds more than $3 trillion in gross real estate assets. Some of the key drivers that influence the REIT industry are population growth, the rise in economic activities, job market improvement, mortgage rates, and commercial and industrial growth, among others.A Challenging 2017 for US REITs
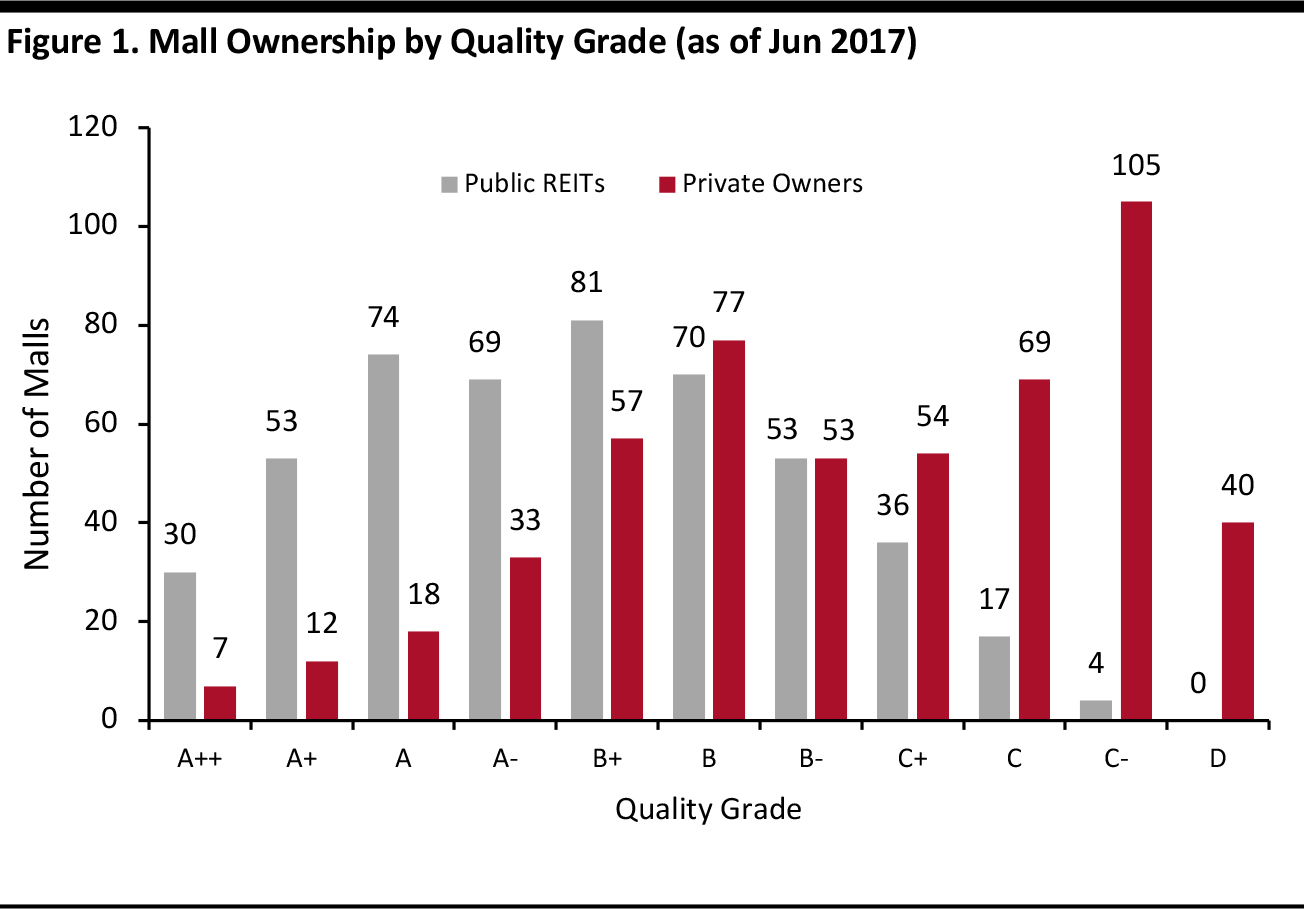
Mass store closures in 2017 translated into a challenging period for US REITs. Last year was the first year since the Great Recession that saw more stores closing than opening, and store closures and bankruptcies had a particularly debilitating impact on REITs. Naturally, news of thousands of store closures led to a change in investor sentiment toward REITs as well. Among all the REIT subsectors, retail REITs (which own and manage malls and shopping centers) were the worst performers in 2017, generating a negative total return of 4.77% for the year. However, despite ongoing, significant changes in the industry, retail REITs in the US have fared surprisingly well in terms of operational performance, as measured by metrics such as funds from operations (FFO), net operating income (NOI), occupancy rates and dividend yields. This is ostensibly due to the fact that REITs typically invest in properties in higher-income areas, which have not felt the impact of store closures as acutely as other areas. Also, many retail REITs own malls and open-air shopping centers that have effectively strategized to deal with the changing environment. The graph below provides a glimpse into the distribution of malls among REITs and private owners, broken out by quality grade, which ranges from A++ to D, based on sales per square foot. While definitions may vary across the industry and evolve over time, class A malls are often classified as those that generate $500 or more in sales per square foot, as also in the case of a categorization used by retail real estate operator, Pacific Retail Capital Partners.
Source: International Council of Shopping Centers (ICSC)/Green Street Advisors/Brookfield/Nareit
Retail REITs
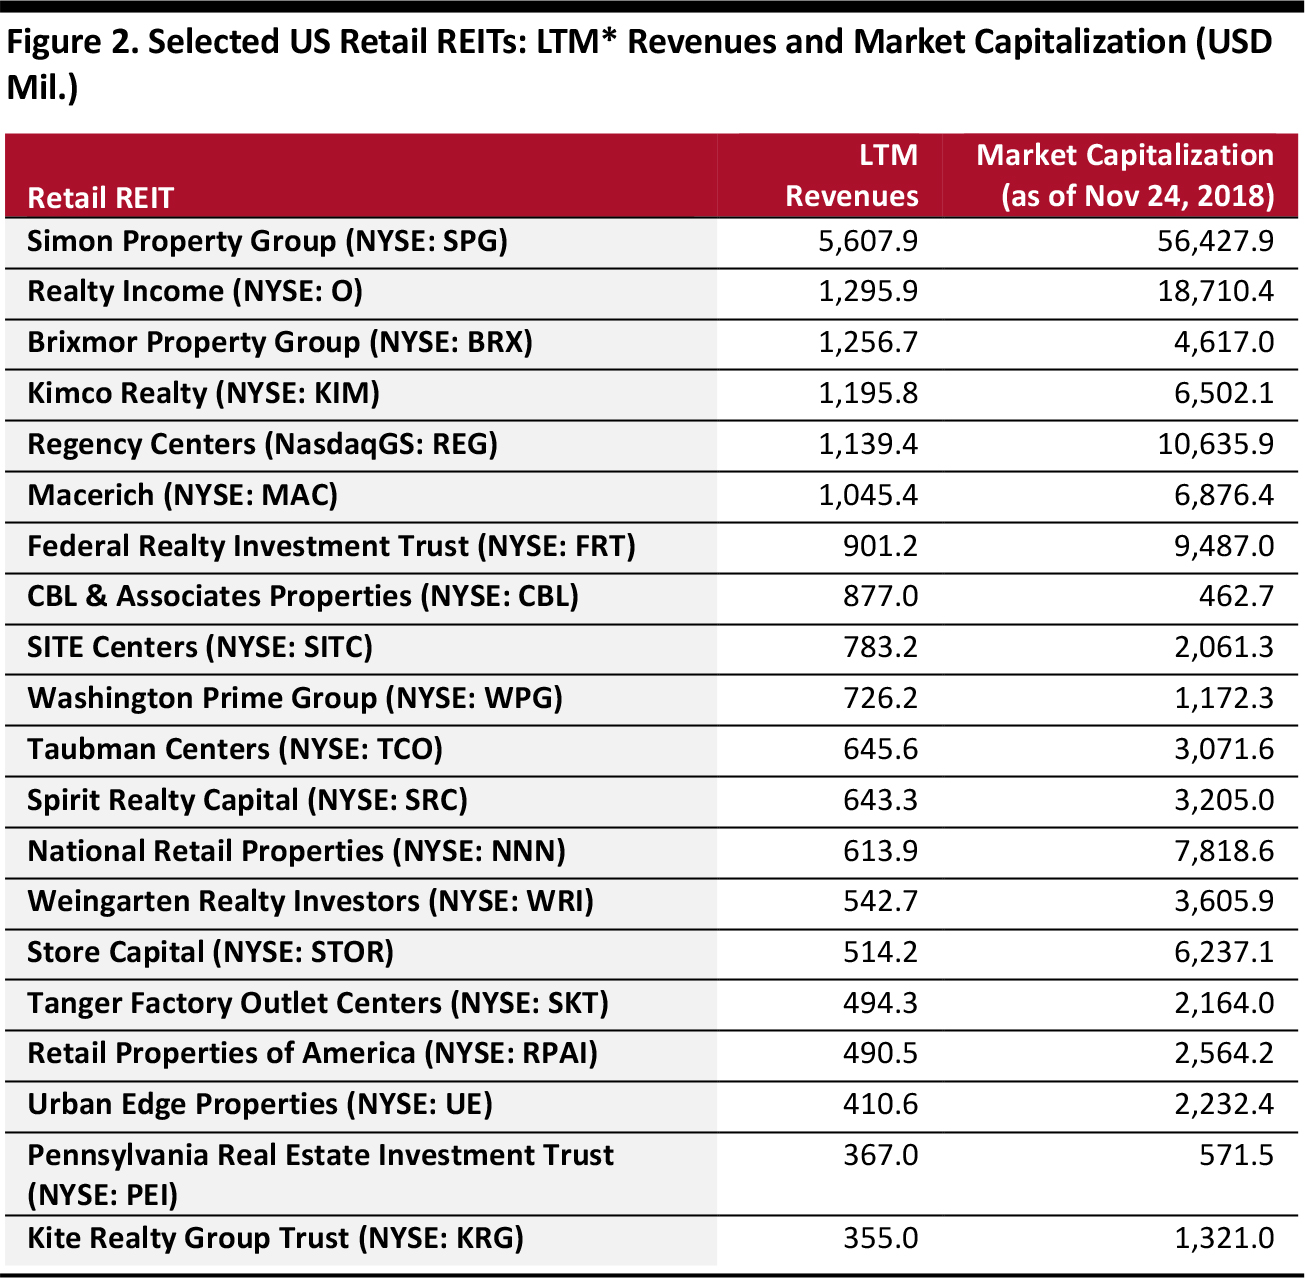
Retail REITs earn revenue in the form of rental income through the lease of properties to retail tenants. Several retail REITs also manage retail centers owned by third parties and claim a management fee that consists of a percentage of each center’s revenue. REITs whose interests lie in large regional malls, grocery-anchored shopping centers, outlet centers and power centers (large, 250,000–750,000-square-foot outdoor shopping malls that typically include three or more big-box stores) all fall under the retail REITs designation. As of November 30, 2018, there were 36 retail REITs in the US, with a total market capitalization of approximately $171 billion. Some well-known retail REITs include Simon Property Group, Kimco Realty, Macerich and Taubman Centers. The table below lists 20 leading retail REITs in the US by revenues for the last 12 months (LTM), according to S&P Capital IQ, along with their market capitalizations.
Excludes diversified REITs that have a presence in retail real estate. *Last 12 months total revenues as per last income statement filing date varying between Oct 26 and Nov 9 across the 20 companies. Source: S&P Capital IQ/company reports
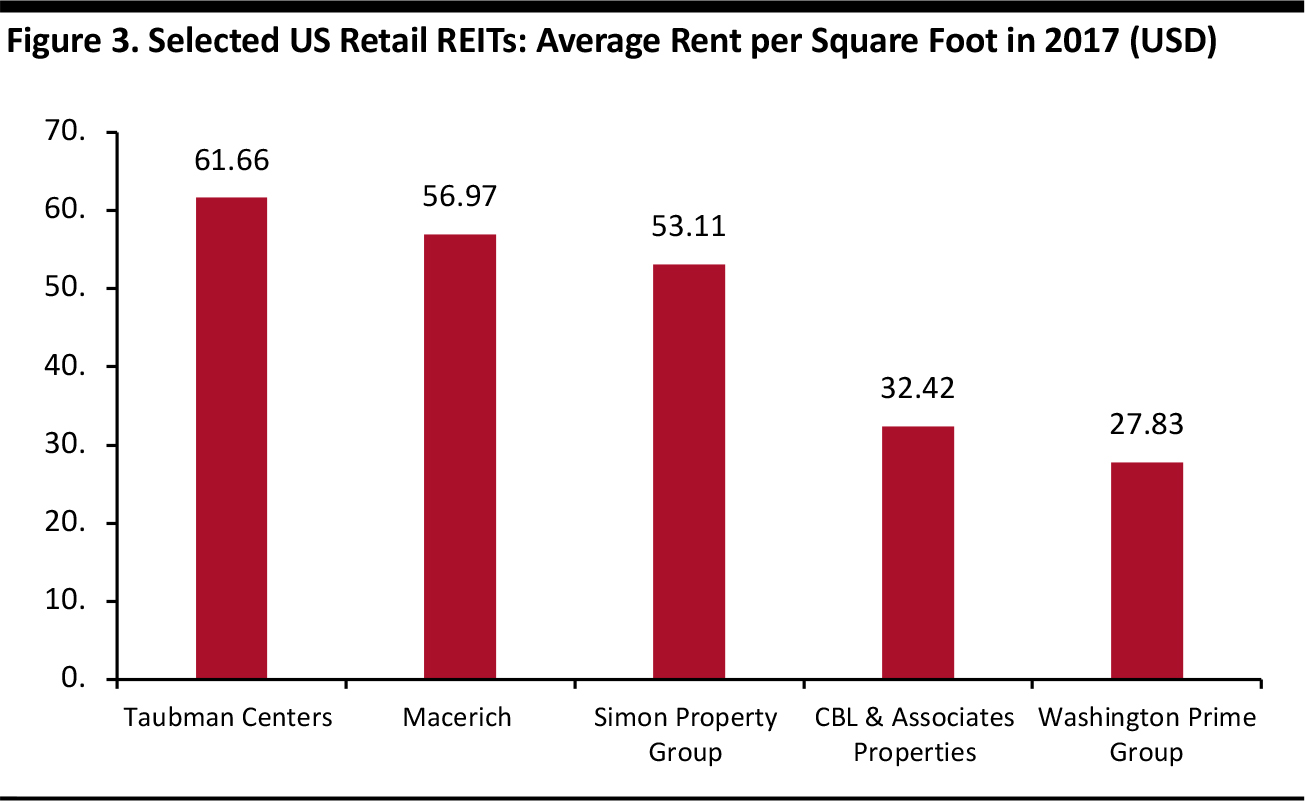
The graph below depicts some of today’s leading retail REITs by average rent in US dollars per square foot.
Source: Taubman Centers/Statista
Despite challenging times, top-tier retail REITs turned in positive performances in 2017 as a result of strategies they adopted in anticipation of the difficult environment. These include: Simon Property Group, which is the largest REIT of any kind by revenue, has a broad portfolio of high-quality malls and a significant market share in outlet centers. The company has executed a successful strategy of adapting its properties to evolving consumer trends. It has redeveloped shuttered department stores within malls as hotels, fitness centers, entertainment centers and modern dining outlets. The REIT has also bet on mixed-use mall properties to great effect. Brookfield Properties Retail Group (BPRG), which was known as General Growth Properties (GGP) before Brookfield acquired it in August 2018, has enhanced its exposure to food service and entertainment centers. Food service accounted for 22% of new deals in 2017, up from 20% in 2013. BPRG expects food service to account for 16% of gross leasable area at its top-tier A centers in 2027, up from 13% in 2017. Entertainment concepts accounted for just 4% of the REIT’s new deals in 2013, but that share grew significantly, to 18%, in 2017. BPRG expects entertainment outlets to account for 11% of gross leasable area at its premium A centers in 2027, versus 7% in 2017. BPRG also signed a deal with co-working space WeWork in 2017, in line with a growing trend among some mall owners to lease space to shared offices, especially on the upper floors in shopping centers, which are typically less productive. Macerich has welcomed premium fitness lifestyle brands such as SoulCycle and Equinox as new tenants in its shopping centers. Some of these fitness centers have been developed out of department store anchors that were closed or downsized. In August, Macerich announced that it will be teaming up with coworking company Industrious to bring shared office spaces into some of its shopping centers. Taubman Centers sold its lowest-productivity centers (which accounted for around one-third of its portfolio) in late 2014. It also focused on expansion and strengthening the experiential element in its centers by reinvesting in physical buildings and the merchandising of assets in its portfolio. Taubman has developed, expanded or renovated upwards of 80% of its portfolio since 2008, according to the company’s President and CEO, Robert S. Taubman. The REIT has also strategically added destination retailers and anchors such as Sea Life Aquarium, Legoland, RH Gallery, Round1, Sports Monster and Aquafield to its centers. National Retail Properties is a net-lease REIT, which means that it offers tenants long-term lease agreements that require the tenants to pay for certain property expenses. The REIT has a 100% retail-oriented portfolio and is invested in properties that are occupied by both investment-grade and non-investment-grade tenants. Although being open to non-investment grade tenants has brought higher risk, it has also led to better returns and quicker rent growth, as National Retail has been able to command more favorable lease terms from these lower-credit tenants. The REIT enjoys a commendable 99.2% occupancy rate, which hedges it to an extent against default risk.Growth in FFO and NOI
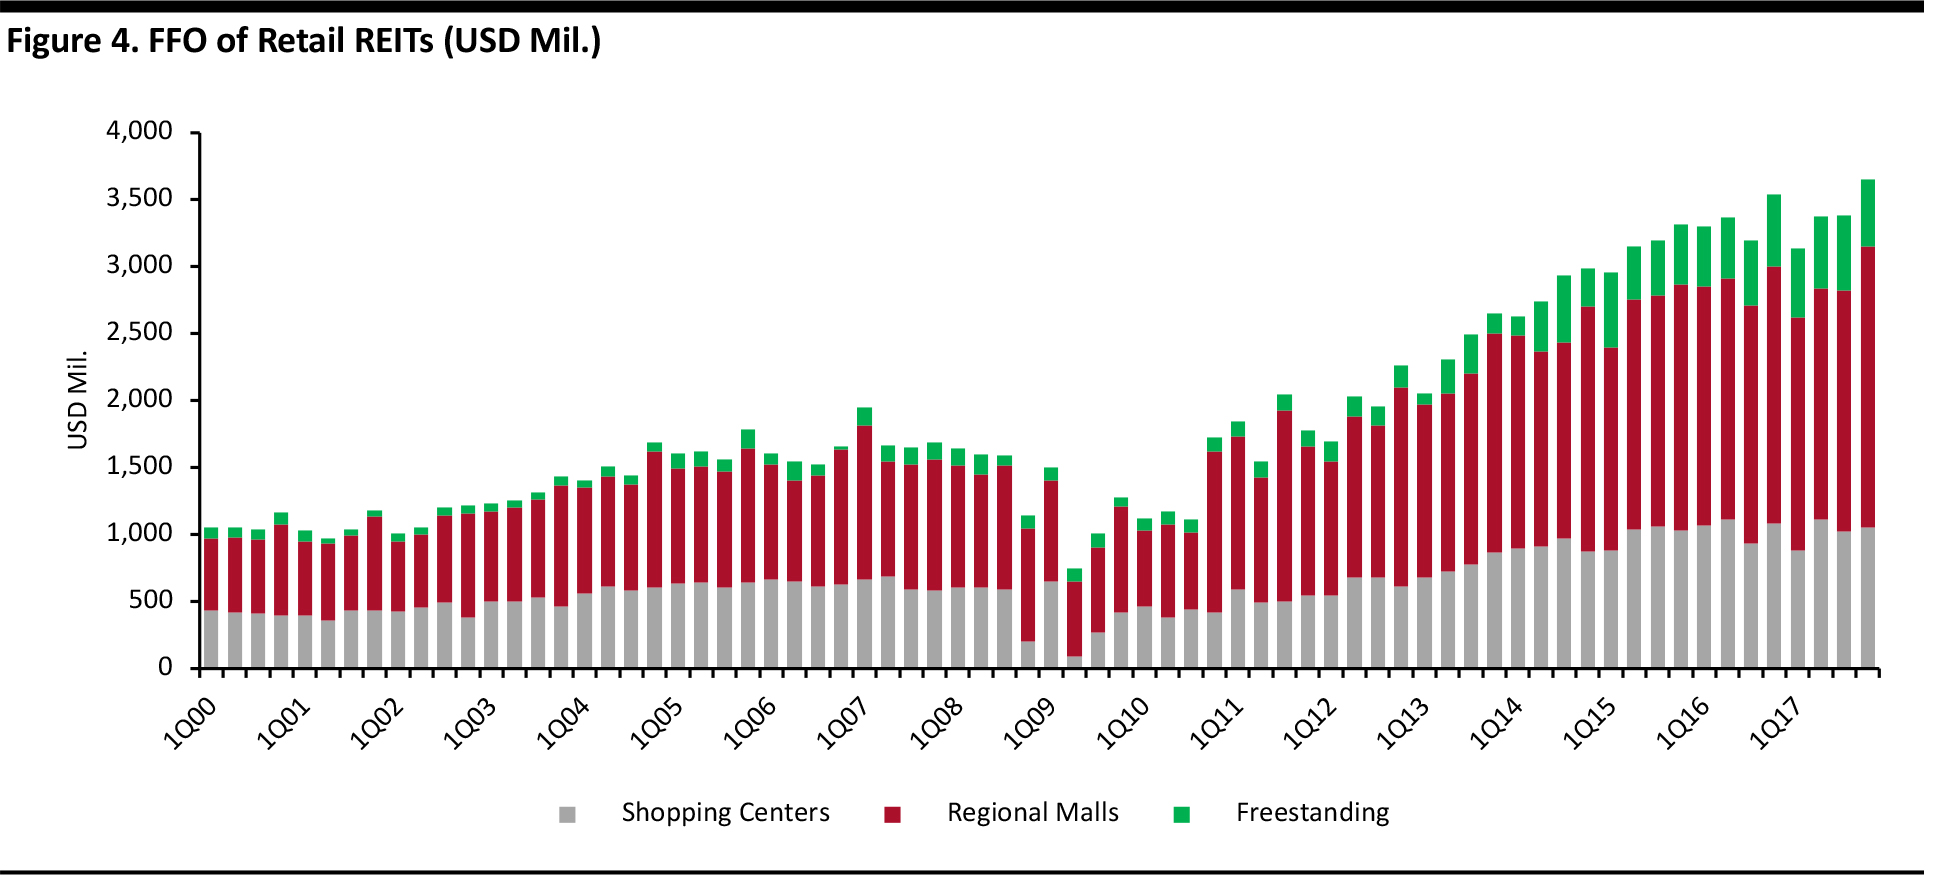
FFO growth is a metric commonly used to assess the operating performance of REITs in the US. With most kinds of companies, net income and earnings per share can be used as fair measures of profitability, but these metrics are not effective in the context of REITs. The crux of this unsuitability lies in the way companies account for depreciation. All businesses are allowed to treat depreciation as a business expense, but for REITs, depreciation suggests that properties are losing value over time, whereas in reality there is no real cost or expense involved. Moreover, properties tend to generally increase in value over time. Since depreciation is included in the calculation of net income and earnings per share, these two metrics do not give an accurate picture of cash flowing into REITs. FFO is considered a better measure of REIT performance than net income is because it discounts the influence of depreciation. FFO is calculated by adding depreciation expense back into net income, along with a few other adjustments, in order to give investors a more accurate picture of a REIT’s cash flow. FFO for US equity REITs as a whole in the second quarter of 2018 grew to $16.4 billion, which represented a 5.5% rise quarter over quarter and a 6% rise year over year. For retail REITs specifically, FFO grew by more than 10% over the five-year period ended 2017, highlighting positive operational performance, although there was a flattening toward the end, which can be seen in the graph below. Regional mall REITs contributed the highest share toward total FFO of retail REITs between 2000 and 2017, followed by shopping center REITs and freestanding REITs. In 2017, FFO from shopping center REITs declined by 2.9% year over year, whereas FFO from regional mall and freestanding REITs grew by 1.2% and 9.2%, respectively.
Source: Nareit T-Tracker
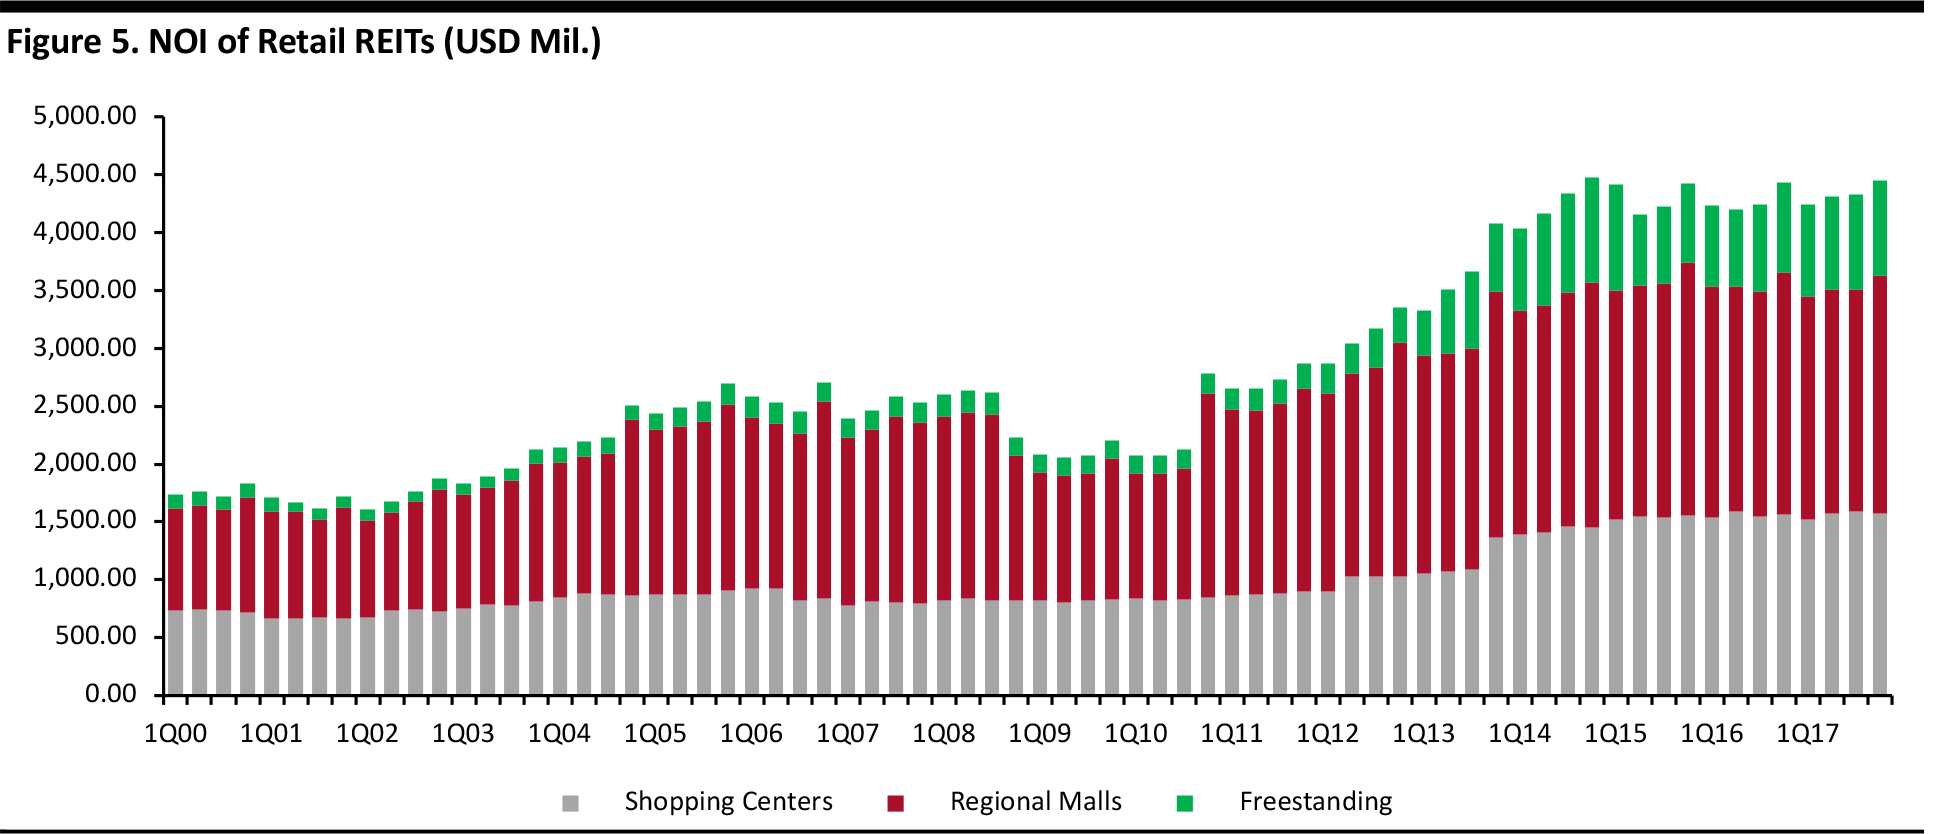
NOI growth for retail REITs was similar to FFO growth between 2000 and 2017, as shown in the graph below. NOI in the context of retail REITs represents total revenue generated from retail real estate properties minus all reasonably necessary operating expenses. Although NOI is one of the indicators of REIT performance, it has to be viewed in conjunction with other indicators in order to provide a clear picture. NOI for US REITs as a whole in second quarter of 2018 totaled $24.5 billion, representing a 2.5% rise quarter over quarter and a 4.3% rise year over year, signaling steady operational performance. Regional mall REITs contributed the highest share toward total NOI of retail REITs between 2000 and 2017, followed by shopping center REITs and freestanding REITs. In 2017, NOI from shopping center REITs rose negligibly, by 0.5% year over year, whereas NOI from regional mall REITs declined by 1.9%. Freestanding REITs, however, registered 11.7% year-over-year growth.
Source: Nareit T-Tracker
Initial public offerings and conversions to REIT status were the principal contributors to NOI growth for equity REITs as a whole (including retail REITs) between 2011 and 2015, followed by net acquisitions. Since 2015, however, the number of initial public offerings, conversions and net acquisitions has fallen significantly. Although acquisitions and consolidation in the industry played a notable part in the growth of retail REIT FFO and NOI between 2011 and 2017, same-store results (which consider NOI only for properties held for over a year) also showed steady growth over the period. Same-store NOI for retail REITs grew by 2%–4% between 2011 and 2017. Although growth in same store NOI has declined since early 2016, retail REITs have, in general, been in line with other property sectors and, occasionally, ahead of them on this metric.Dividend Yields
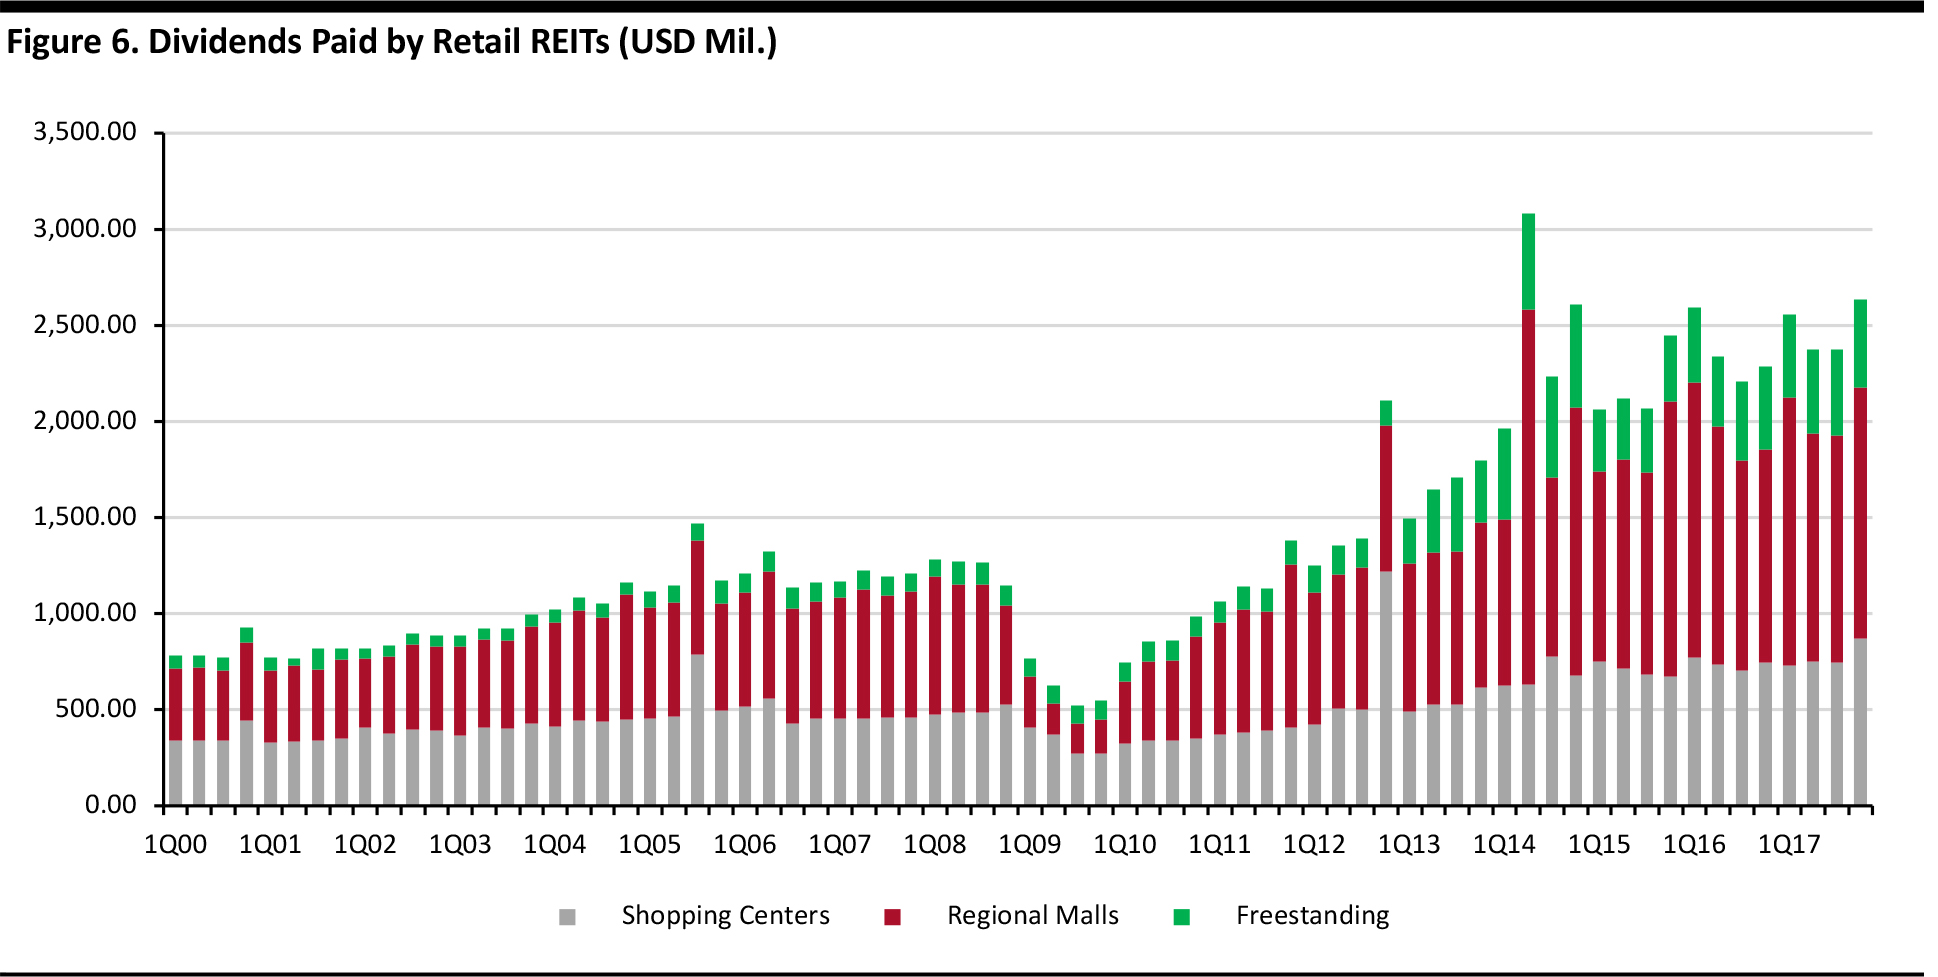
Across the four quarters through 2017, retail REITs distributed close to $10 billion as dividends. As illustrated below, dividend payouts grew at an 11.3% annual rate over the five-year period ended 2017. Regional mall REITs paid the highest dividends among all retail REITs between 2000 and 2017, followed by shopping center REITs and freestanding REITs. In 2017, dividend payouts by shopping center REITs grew by 4.8% year over year and payouts by regional mall REITs grew by 4%. Freestanding REITs recorded 11.3% growth in dividend payouts last year. As of November 30, the dividend yield for retail REITs this year was 4.77%.
Source: Nareit T-Tracker
Occupancy
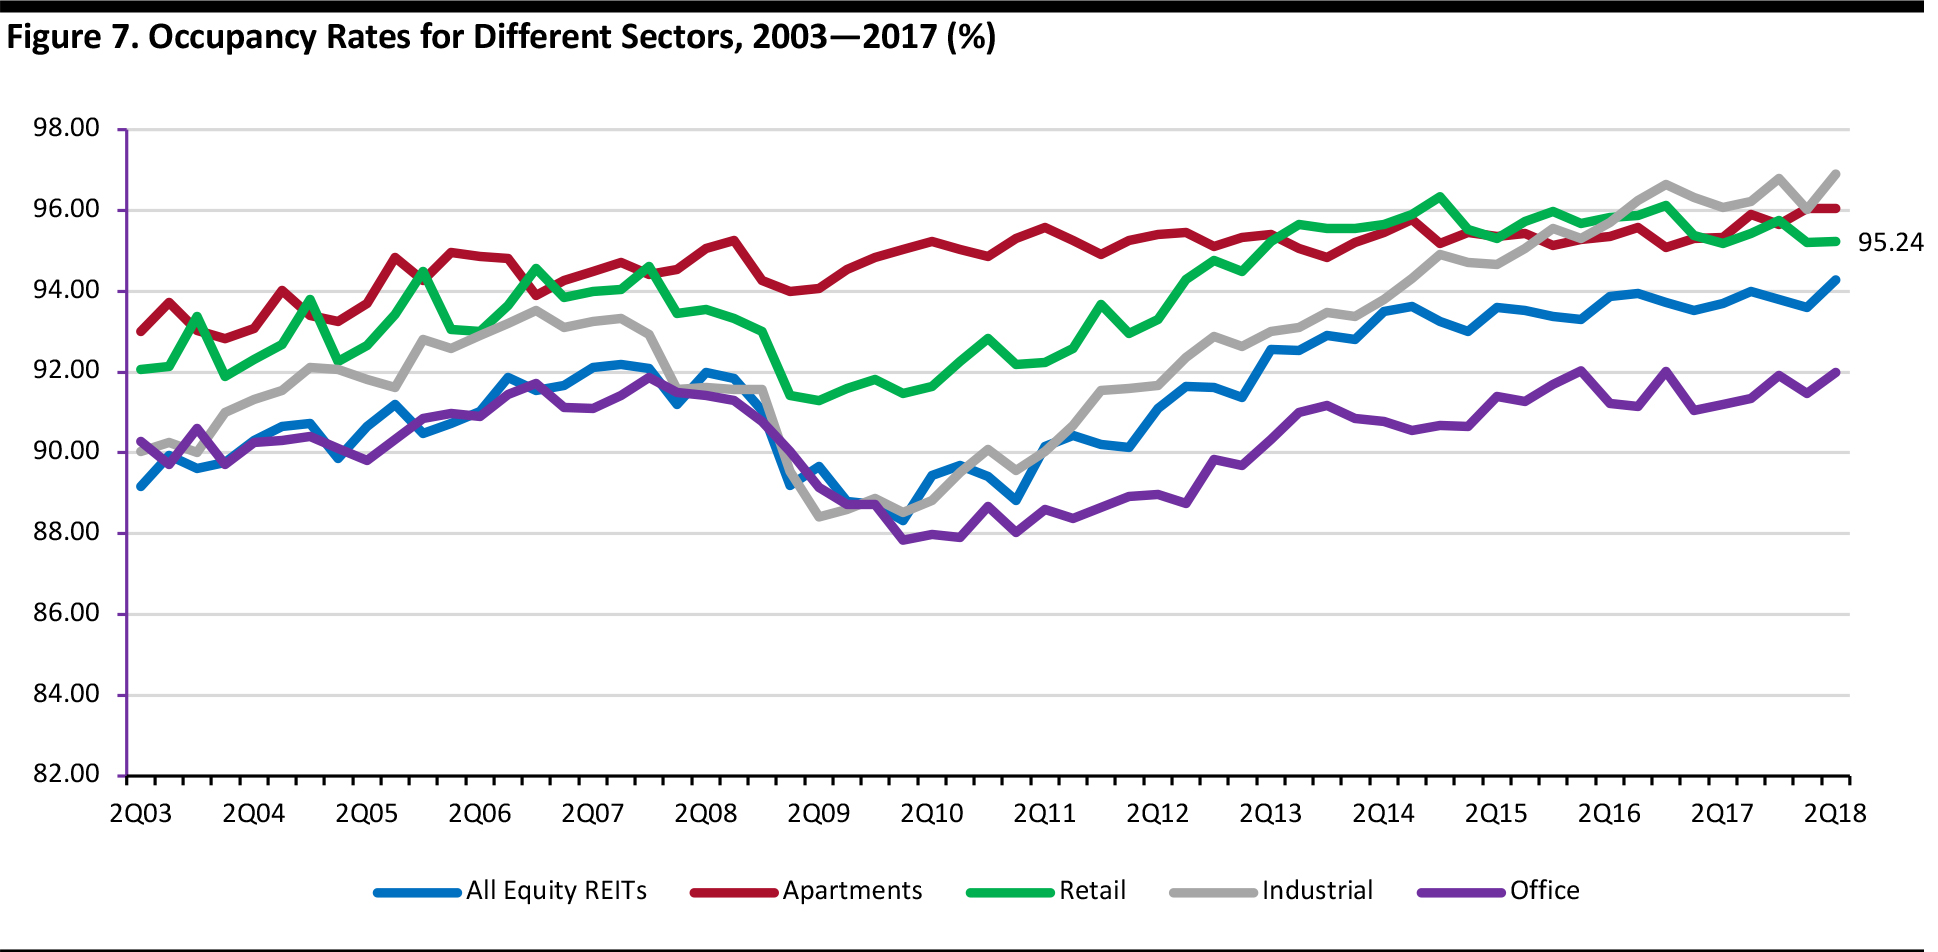
According to SEC filings from US REITs, the occupancy rate for malls and shopping centers owned by REITs has shifted upward, growing from 92% in 2010 to 95% or higher in recent years, as depicted in the graph below. The increase in occupancy from 2003 until 2017 among retail REITs was second only to the increase seen by industrial REITs, which were buoyed by demand for logistics services needed to fulfill e-commerce orders. As of the second quarter of 2018, the occupancy rate for retail REITs was 95.2%; for all equity REITs, the rate was lower at 94.3%.
Source: Nareit T-Tracker
Shopping Center REITs versus Mall REITs
A shopping center is typically defined as a collection of retail and other commercial establishments that sell merchandise to the public in an enclosed space that is planned, developed, owned and managed as a single property. A mall, on the other hand, can be a shopping mall, a strip mall or a pedestrian street and need not necessarily be in an enclosed space. From 1994 until 2017, shopping center REITs’ total returns were about 130 basis points lower per year than the broader REIT average return. This has been a common trend in the shopping center sector and other sectors that have seen above-average capital expenditures. The average annual return of shopping center REITs was 10.9% over the 1994–2017 period, versus a 12.2% return on the FTSE Nareit All Equity REITs Index. After experiencing a tough 2017, the shopping center REITs grew by more than 13% in terms of total returns over the first quarter of 2018, on the back of an improvement in economic growth. Out of 11 shopping center REITs, five beat adjusted FFO and NOI earnings estimates in the first quarter of 2018, while the other six reached expectations on these metrics. Mall REITs performed well in terms of total returns in the period right after the 2008 recession, but they have been under-performing since the beginning of 2016. As measured by total returns, the sector was the second worst performer among all REITs in 2016 and 2017. In 2018, mall REITs’ total returns had plunged by more than 12% by mid-May, leaving the sector ahead of only shopping centers among all REIT sectors. Among mall REITs, there has been a discernible difference in the performance of top-tier and lower-tier REITs. Top-tier mall REITs reported strong results for the fourth quarter of 2017 and the first two quarters of 2018, whereas lower-tier mall REITs generated disappointing results over the same period. While the former showed strong fundamentals and positive signs for continued growth, the latter continued to fight for survival. 2017’s store closures are still negatively impacting power center REITs, but grocery-anchored REITs and higher-quality power center REITs are expected to experience continued growth.New Tenants Coming into the Mix
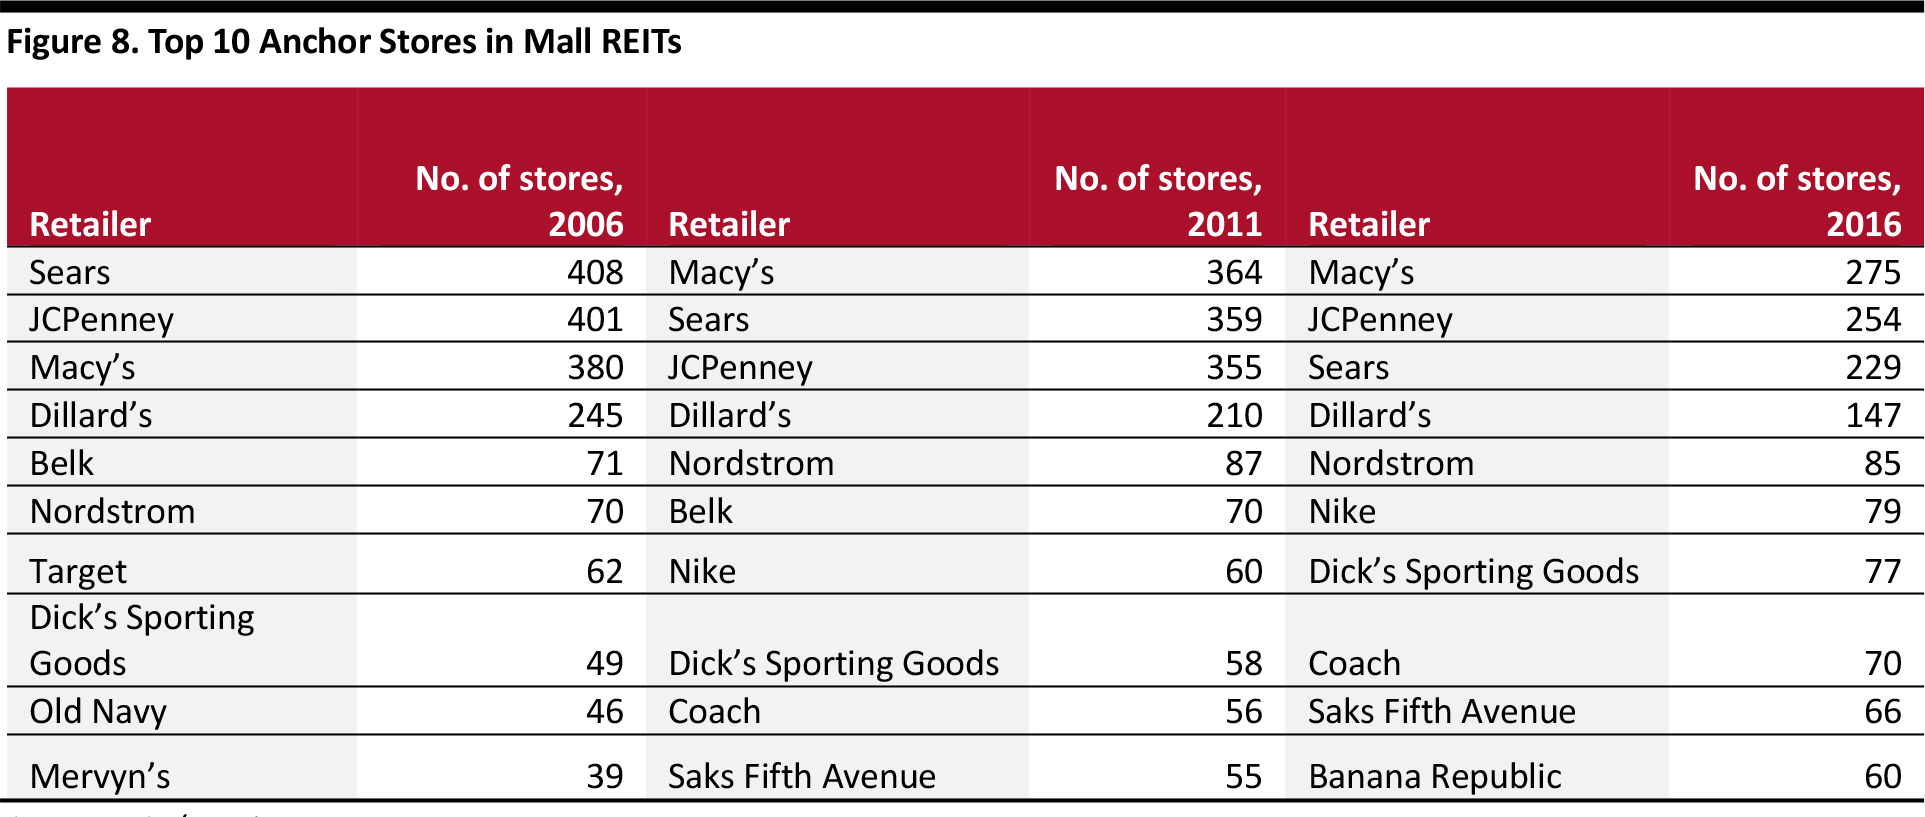
One of the ways that retail REITs have countered the challenging retail environment has been to reexamine and reshape their tenant mixes. Many REITs have welcomed new tenants, to ensure that occupancy rates remain high, and also factored in shoppers’ desire for experiences when choosing tenants. Retail REITs are also investing in making improvements to their properties in order to enhance their appeal to shoppers and visitors. An analysis of how tenant mixes have changed over time provides some interesting insights. The table below looks at the top 10 anchor stores at mall REITs in 2006, 2011 and 2016. The table shows the number of store locations in mall REITs’ property portfolios in total, but not those stores’ square footage. We note that the size of stores differs from tenant to tenant and that changes may have happened over time. Nevertheless, following are the key trends: Sears, JCPenney, Macy’s and Dillard’s were the top four tenants, accounting for the largest number of stores in mall REITs in each of the three years.- Six retailers made the top 10 in all three years.
- The list has become less skewed toward the top, implying that there is less dependence comparatively on the top anchors.
Source: ICSC/Nareit
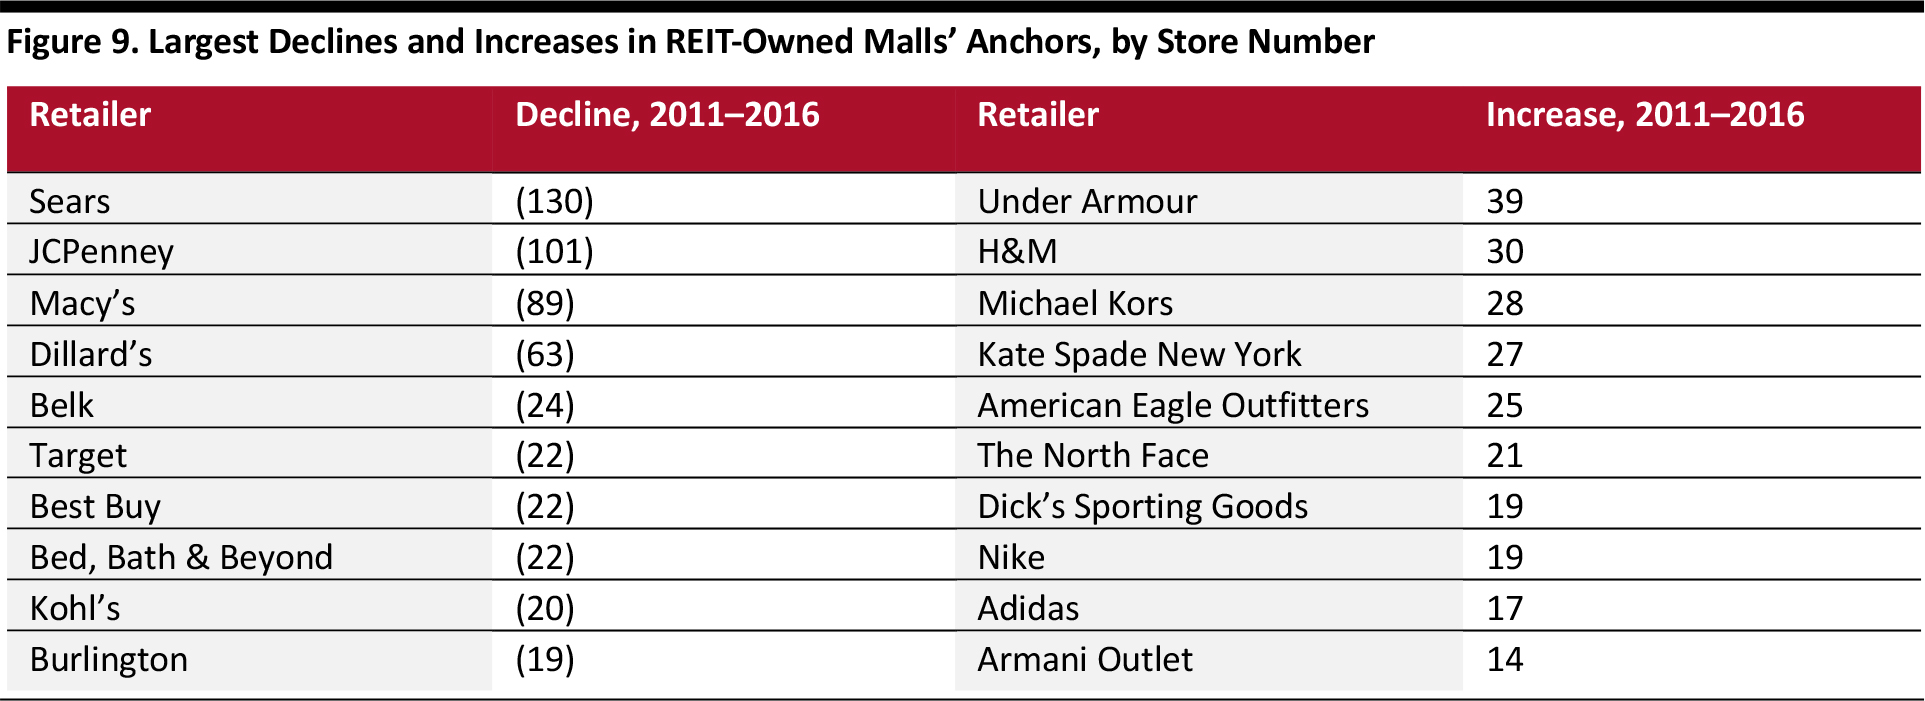
The table below depicts the largest declines and increases in REIT-owned malls’ anchors over the 2011–2016 period. These listings also provide some interesting insights.Largest Number of Store Closures
- Sears, JCPenney, Macy’s and Dillard’s, which had the highest number of anchor stores in mall REITS in 2006, 2011 and 2016, were also the retailers that saw the highest numbers of store closures over the 2011–2016 period.
- Reflecting the growth of e-commerce, many department stores and household goods retailers that sell products that can be comfortably purchased online have seen a high number of store closures.
Largest Number of Store Openings
- The number of sporting goods and outdoor equipment stores in malls rose significantly between 2011 and 2016.
- Some fashion and clothing stores, including Under Armour, H&M and Michael Kors, also show a large increase over the period.
- A common theme among all the retailers whose mall store numbers have increased is that they sell products that shoppers choose carefully, based on size, fit and appearance. Those categories tend to attract more in-store traffic and their sales are less affected by e-commerce than are sales in some other categories.