Excluding motor vehicles and parts
Source: comScore/US Census Bureau
comScore’s quarterly e-commerce data include sales for retail desktop and mobile (smartphone and tablet) transactions (excluding auction site, event ticket and nonretail travel transactions).
4Q15 RECAP
Despite a challenging environment that was marked by unseasonably warm weather, economic uncertainty and a shift in spending toward services, consumers did not pull back as much as retailers had feared they would during the holidays and fourth quarter. Overall, US retail sales (online and offline, excluding autos) were up 1.3% compared to the year-ago quarter, according to the US Census Bureau’s quarterly retail sales report.
December retail sales detracted from quarterly gains, unexpectedly decreasing by 0.2% (seasonally adjusted) month over month. According to the US Department of Commerce, December sales were weighed down by a 1.6% decline in electronics and appliance store sales and a 0.3% decline in clothing store sales. Online sales slipped by 0.3% in the month. We believe this was driven by consumers doing more of their holiday shopping earlier in the quarter (retailers started discounting earlier due to an elongated holiday season, as Hanukkah began 10 days earlier in 2015 than it did in 2014) and by retailers’ need to keep inventories low due to the deflationary atmosphere.
Sales in November led fourth-quarter growth. According to the Department of Commerce, November sales were up 0.5% (seasonally adjusted) month over month and up 3.0% (unadjusted) year over year. A closer look at the numbers reveals that, although fewer dollars came in than had been expected, demand was actually up. In fact, unit volume was up. The price index generated by the US Bureau of Economic Analysis shows that retail prices were 2.9% lower in November 2015 than they were in November 2014. Consumers received great values during the month, and overall buying attitudes toward retail were positive.
Holiday sales in 2015, including online sales, increased by 3%, to $626.1 billion, according to the National Retail Federation (NRF). Nonstore retail sales (online, mobile and catalog) grew by 9%, to $105 billion, over the period.
E-commerce sales growth outpaced that of the brick-and-mortar channel over the holiday period. From Thanksgiving weekend through Cyber Monday, e-commerce sales were up 20%, whereas brick-and-mortar sales were down 10%, according to MasterCard Advisors’ SpendingPulse. Retailers’ promotional strategies, such as online discounts and free shipping, contributed to a 26% increase in online sales over the Thanksgiving weekend, according to IBM. In contrast, foot traffic fell by 6.4% in November and December, according to RetailMetrix.
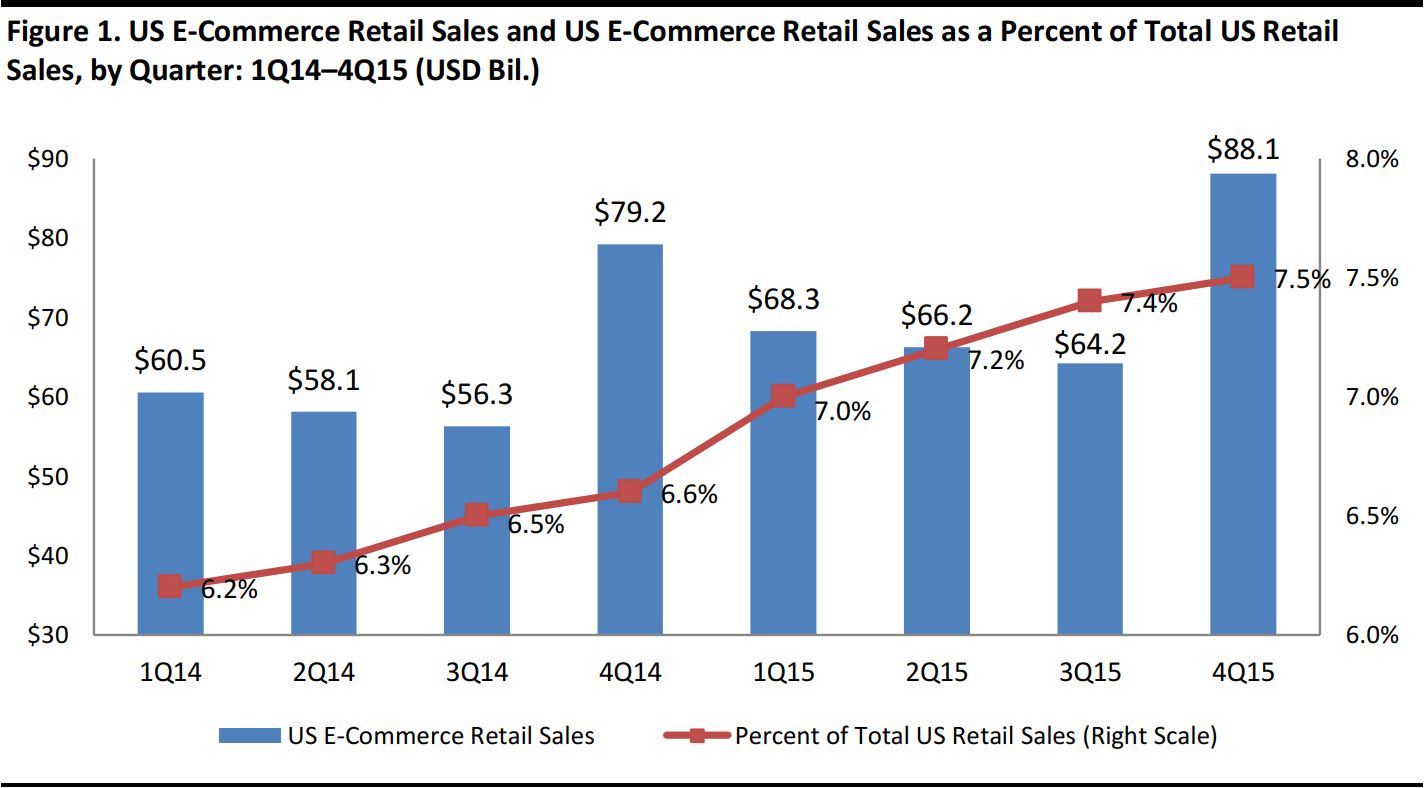
During the fourth quarter, online retail sales continued to grow as a share of total retail sales, accounting for 7.5% of total sales, up from 6.6% in the year-ago quarter. E-commerce sales (excluding nonretail categories) increased by 11.2% year over year, to $88.1 billion.
Mobile devices were a key driver of growth; sales made via smartphones and tablets grew by 41% and 46%, respectively, year over year in the quarter. Mobile commerce (m-commerce) has grown its share of total digital commerce dollars: mobile’s 19.2% share in the fourth quarter of 2015 was 620 basis points higher than its share in the same quarter in 2014.
According to comScore, e-commerce sales for 2015 totaled approximately $341.7 billion, an increase of 14.6% over the prior year, while total retail sales increased by 1.4% over the prior year. The positive e-commerce results were seen across many categories.
THE 4Q15 RUNDOWN BY CATEGORY
Source: comScore/FBIC Global Retail & Technology
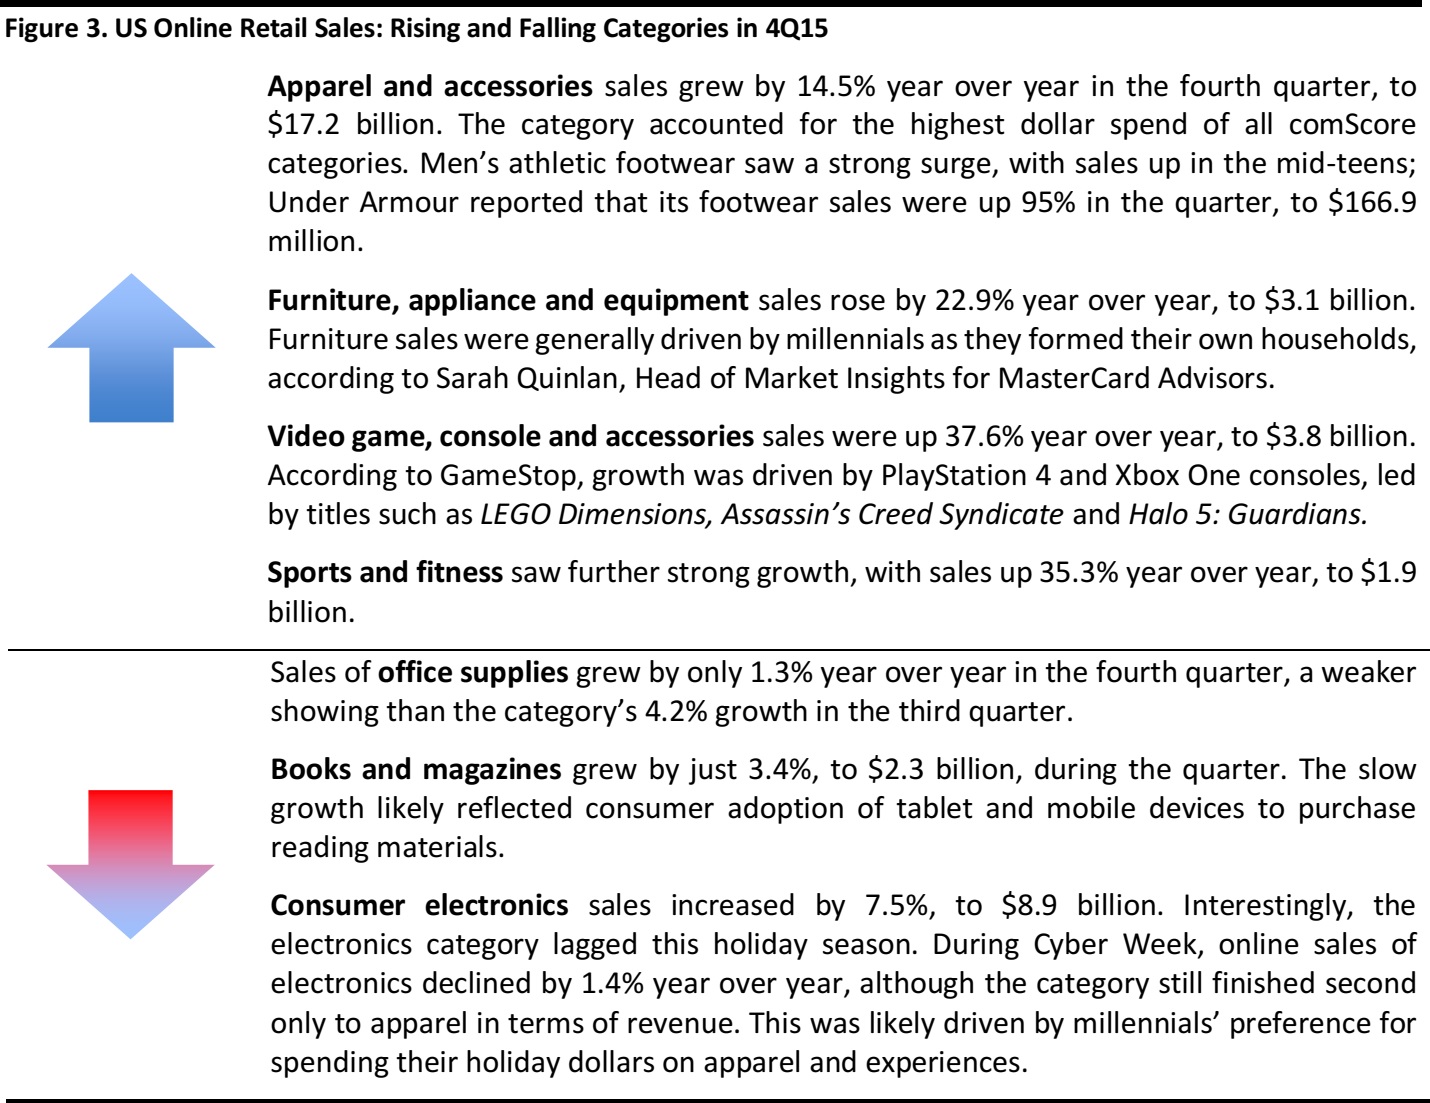
WINNERS AND LOSERS
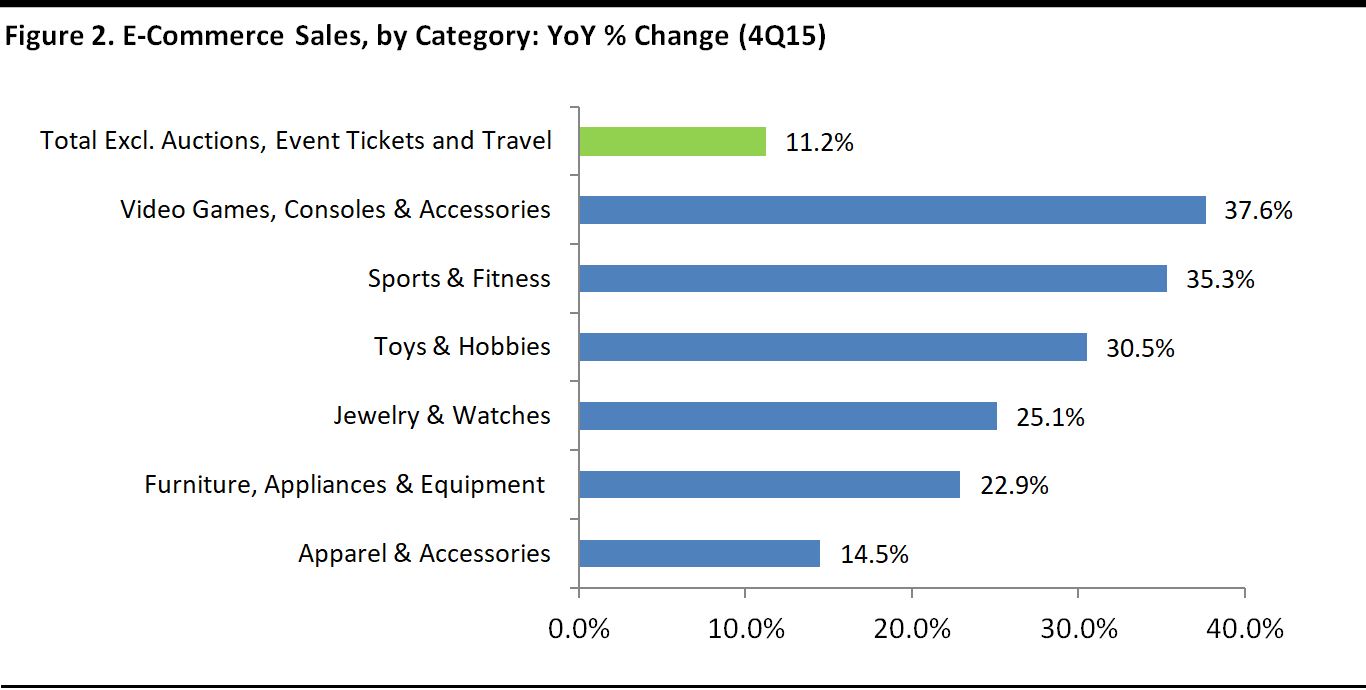
In the fourth quarter, e-commerce (including m-commerce) retail spending increased by 11.2% year over year, to $88.1 billion, excluding auction sites, event tickets and travel
QUARTERLY COMSCORE DATA VS. US CENSUS BUREAU DATA
comScore and the US Census Bureau both provide quarterly data on e-commerce sales, which include transactions made via desktop and mobile devices. The Census Bureau reported that total e-commerce sales, adjusted for seasonal variation, grew by 14.7% year over year in the fourth quarter, to $89.1 billion (Census Bureau data include travel and event ticket online purchases).
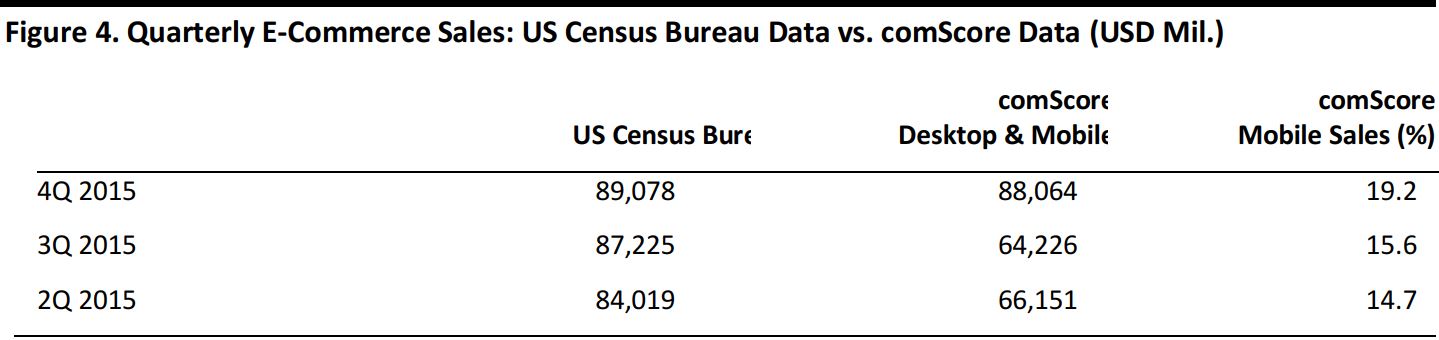
comScore data are for retail only, excluding auctions, event tickets and travel.
Source: comScore/US Census Bureau/FBIC Global Retail & Technology
In the fourth quarter, total m-commerce (smartphone and tablet) retail sales accounted for 19.2% of all digital sales, a noteworthy 5% increase from the same period a year ago. However, there is still a significant opportunity in terms of the mobile monetization gap for those retailers that are investing in mobile and tablet apps, as dollars are lagging the time spent on mobile devices. According to comScore data, in the third quarter of 2015, consumers spent 84% of their time browsing and searching products, but only 16% of their time purchasing products.
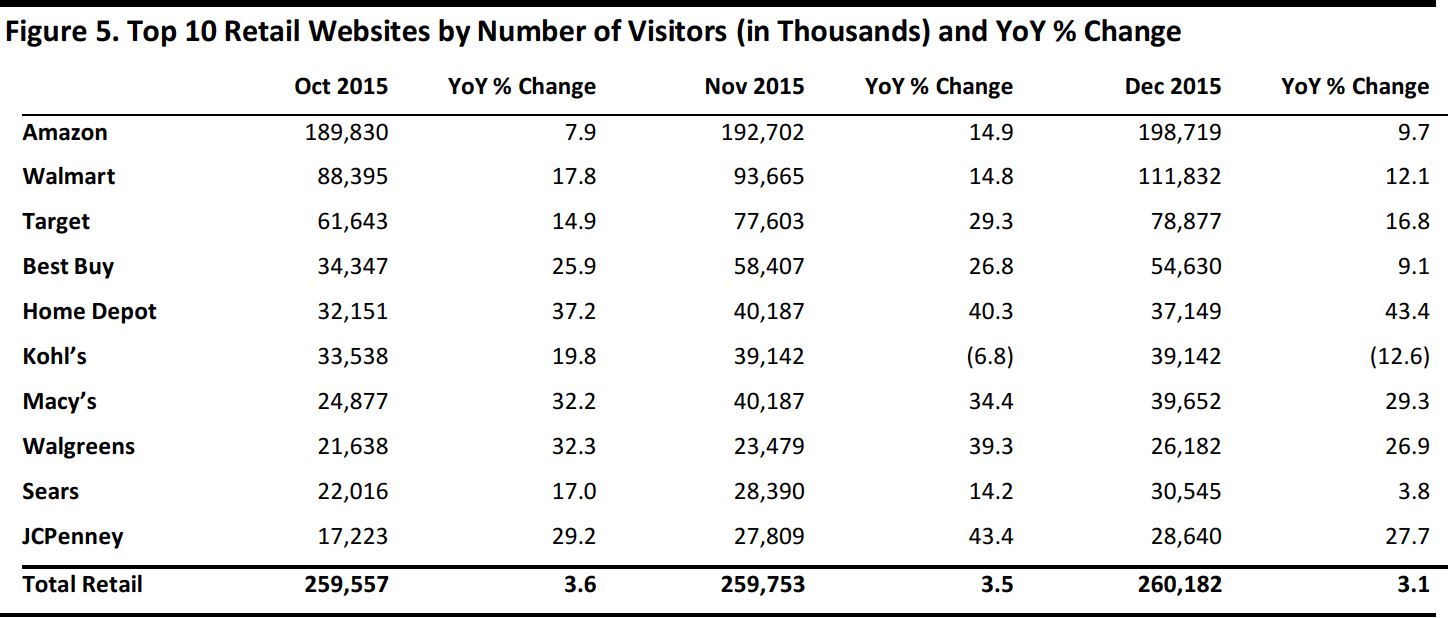
COMSCORE VISITOR DATA
comScore visitor data track desktop, smartphone and tablet usage. The firm says that the number of total unique visitors to all retail websites grew by 1.2% year over year in the fourth quarter of 2015, reflecting the maturity of the Internet channel in the US. Value growth online is principally being driven by existing Internet users spending more online.
Total includes visitors of multiple websites.
Source: comScore
Amazon: With an average of over 180 million unique visitors each month, Amazon.com remained the most-visited website for the entirety of 2015. During the fourth quarter, Amazon Underground, a new app for Android phones that includes the same functionality as the Amazon iOS mobile shopping app, drove mobile traffic. In addition, the company added Prime Now service to eight metro areas in the fourth quarter. Prime members can now choose from tens of thousands of daily essentials with free two-hour and paid one-hour delivery in 17 locations.
JCPenney: During the fourth quarter, JCPenney experienced the strongest year-over-year visitor growth—33.4%—of the 10 top retailers. The company has increased the speed on its online site by 30%, and it now has 40% more product reviews, according to management.
Walmart: Walmart.com was the second-most-visited website behind Amazon.com. The solid results were driven by the company’s recent efforts to improve its app and simplify the checkout process on Walmart.com. According to comScore, the Walmart mobile app has seen a 34% increase in use year over year.
Home Depot: HomeDepot.com enjoyed year-over-year fourth-quarter visitor growth of 40.3%. The company has increased its online presence with initiatives such as buy online, pick up in store and buy online, return in store. It is also equipping store associates with web-enabled tablets that allow them to complete an order if an item is not in stock. Home Depot is investing in its supply chain, too, to support online growth, completing its fifth fulfillment center, located in Ohio. The company plans to expand a pilot deliver-from-store program to all stores in 2016. This would allow the retailer to reach 90% of its US e-commerce customers in two business days or less, according to Home Depot President of Online Kevin Hofmann.
FY16 PREVIEW: RETAIL INDUSTRY PROJECTS SOLID, NOT STELLAR, GROWTH
The NRF expects US retail sales (excluding automobiles, gas stations and restaurants) to increase by 3.1% in 2016, which would be higher than the 10-year average of 2.7%. The NRF predicts that nonstore retail sales (online, mobile and catalog) will grow by 6%–9%. Despite headwinds from international developments, an improving labor market, lower gas prices and lower prices for goods will mean that consumers have more discretionary income, which should drive retail sales growth. However, in 2015, we saw that these factors did not necessarily translate into higher sales for retailers. “We recognize that consumers are doing things different than they have in the past,” said NRF CEO Matthew Shay on a call with reporters. Consumers are saving, investing in their homes and spending on experiences (such as travel and dining) and services (such as healthcare).
The NRF expects the first quarter of 2016 to be relatively soft for the industry, with the greatest strength coming in the back half of the year.
According to Forrester, online sales will grow by an average annual rate of 9.3% over the next five years, to $523 billion, and mobile devices are expected to be a key driver of that growth. Forrester projects that 5.2 million more consumers will shop via mobile devices by the end of 2016, for a total of 250 million.