
Nitheesh NH
Introduction
In this US Housing Market Macro Overview report, we analyze and offer insight into the current housing market landscape in the US, based on a range of recent metrics.Overview
The US housing industry fared well through most of 2020 and has continued in the same vein so far in 2021 as the country continues to deal with the challenges posed by the covid-19 pandemic and its impact on the economy. The $1.9 trillion financial stimulus package under the American Rescue Plan, which was announced in January 2021, as well as the continued rollout of vaccination programs, should further boost home sales, which will, in turn, shore up the economy overall. Using the latest available figures, the average US home was worth $266,104 in December 2020, up 8.4% (or $20,587) versus December 2019. All regions of the country continue to see speedy home sales, while the median sales price continues to register double-digit growth. Although mortgage rates have increased slightly from the trough in early January, they continue to remain historically low, which should support mortgage demand. Home values continue to grow at their fastest pace in a generation, with no signs of slowing down in 2021, according to various economists and market analysts. The strength and resilience of the US housing market is impressive, with housing prices still climbing month over month. As of February 2021, even though sellers are listing many more homes on a month over month basis since September 2020, the pace of newly listed homes continued to slow and there continues to be a need for more new home supply to shore up inventory and put a brake on the sharp price increases. We expect more new listings in March and April as is typical for the US market heading into spring. According to Realtor.com's market data for the week ending February 20, 2021, the median house listing price grew 14.5% year over year, registering the 28th successive week of double-digit price growth. As the supply-demand imbalance continues, the upward pull on prices is likely to remain consistent in 2021. In Figure 1, we provide an overview of key metrics that indicate the current state of the US housing market. Figure 1. US Housing Market Metrics [caption id="attachment_124481" align="aligncenter" width="720"]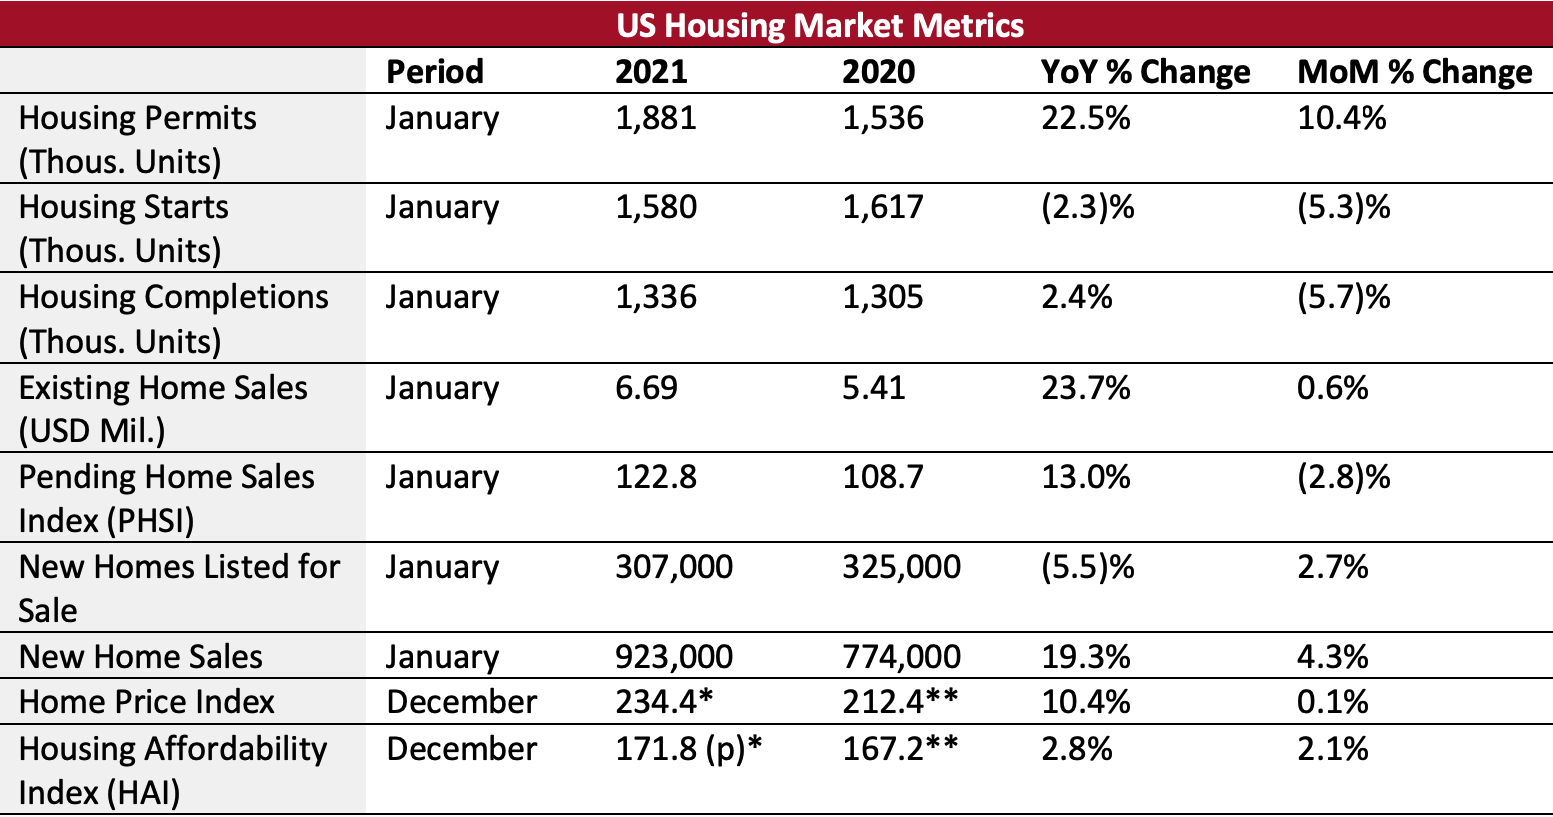 *Figures are for 2020. **Figures are for 2019.
PHSI and Existing Home Sales are based on seasonally adjusted annualized rates (SAAR). (p) refers to preliminary estimate
Source: NAR/US Census Bureau[/caption]
Data on Housing Permits, Starts and Completions
As can be seen in Figure 2 and 3, housing permits grew notably in January 2021, maintaining the upward trend registered through the end of 2020. However, starts and completions lagged slightly. We typically analyze data on permits in conjunction with housing starts. Permits typically lead starts by one to two months and an uptick in the number of permits issued generally indicates improved economic sentiment and an increase in construction investments. In comparison to December 2020 when permits, starts and completions saw spikes, the January 2021 numbers are relatively weak for starts and completions. Starts registered a 2.3% year-over-year decline and a decline of 5.3% month over month. Completions registered 2.4% year-over-year growth (versus 8.0% in January 2021) and a month-over-month decline of 5.7%. The downtrend in starts and completion was primarily due to the challenging logistics of building enough to address a long-standing inventory shortage. The challenges include increasing lumber and other construction costs and delays in obtaining building materials in January 2021. The year-over-year decline in housing starts is the first since August 2020 and could be a sign that rising residential real estate prices may be constraining buyer demand, despite mortgage rates staying low. Housing permits for future construction, however, saw strong growth in January 2021 of 22.5% year over year and 10.4% month over month. This indicates that the housing market continues to be supported by lean inventories and low mortgage rates. Single-family building permits grew 3.8% year over year to 1.269 million units in January 2021 while multi-family housing permits surged by 27.2% year over year to 612,000 units. Figure 2. US Housing Permits, Starts and Completions (Thous. Units) [caption id="attachment_124482" align="aligncenter" width="720"]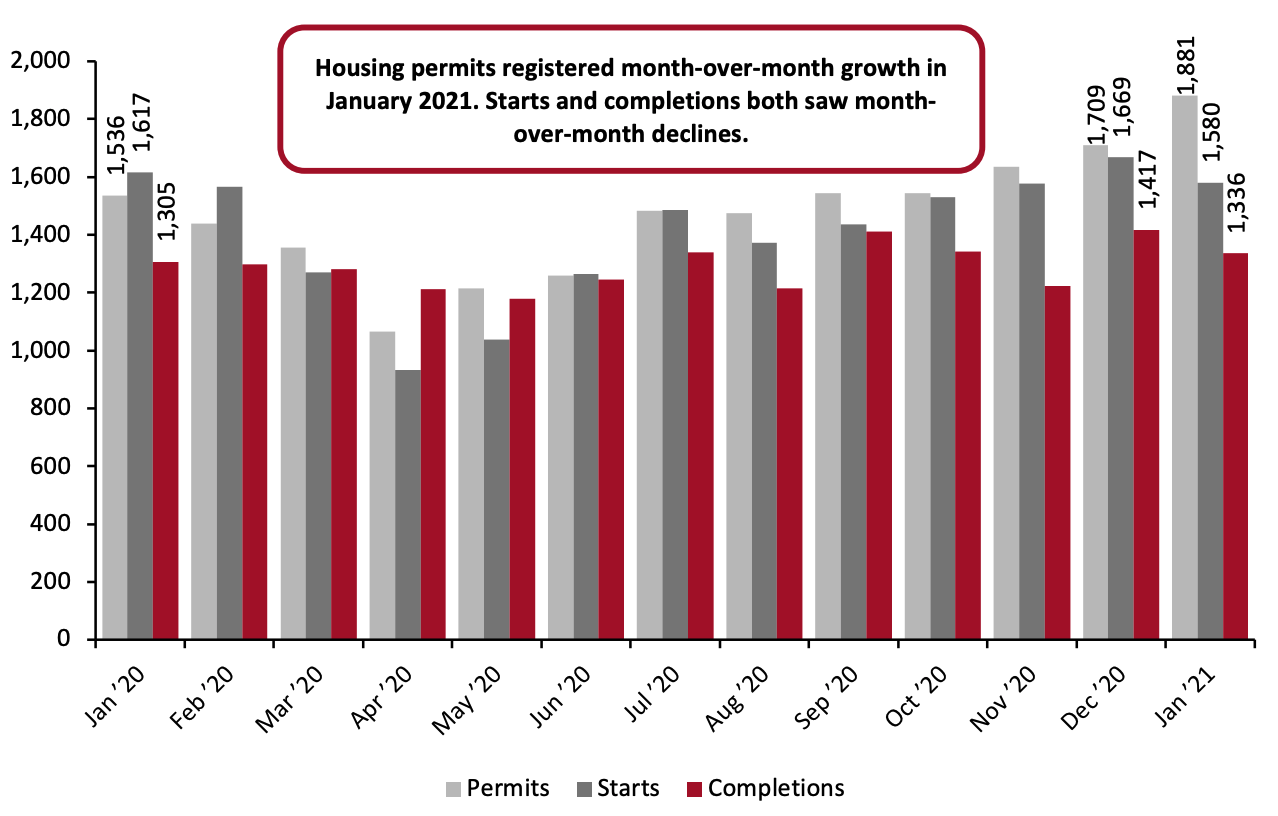 Source: US Census Bureau[/caption]
Figure 3. US Housing Permits, Starts and Completions (YoY % Change)
[caption id="attachment_124483" align="aligncenter" width="720"]
Source: US Census Bureau[/caption]
Figure 3. US Housing Permits, Starts and Completions (YoY % Change)
[caption id="attachment_124483" align="aligncenter" width="720"]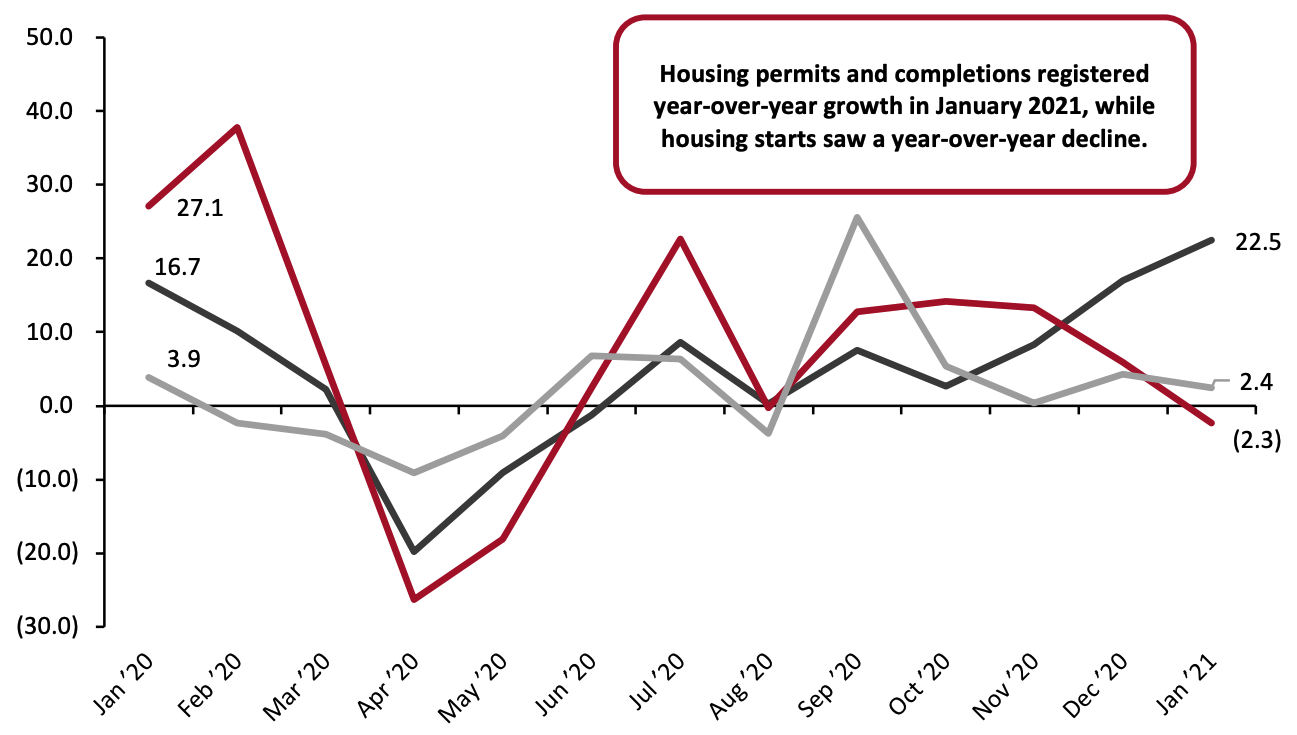 Source: US Census Bureau[/caption]
US Existing Home Sales
Existing home sales (including cooperatives, condominiums, single-family homes and town homes) grew 0.6% month over month to 6.69 million units (SAAR) in January 2021, from a revised figure of 6.65 million in December, and up 23.7% year over year according to NAR. This represented the second-highest sales pace since April 2006. Since existing home sales are based on a closing, January sales represent contract signings in November and December. For the full year 2020, existing home sales grew to 5.64 million units, up 5.6% versus 2019, and the strongest pace since before the Great Recession. According to Lawrence Yun, Chief Economist for NAR, sales could have easily been 20% higher had there been more inventory and more choices. Yun also pointed out that the continued ascent of home sales in the first month of 2021 was aided by buyers quickly snapping up almost every new listing entering the market. Millennials, specifically, are driving US home sales, and we expect this to continue throughout the year, particularly in light of the possible passage of the US President’s $15,000 tax credit for first-time homebuyers. First-time homebuyers accounted for 33% of home sales in January 2021, up 31% month over month and 32% year over year. Born between 1980 and 2000, millennials have aged into their prime homebuying years, and are currently the fastest-growing segment of home buyers in the US. Figure 4. US Existing Home Sales in Units (Mil.) [caption id="attachment_124484" align="aligncenter" width="720"]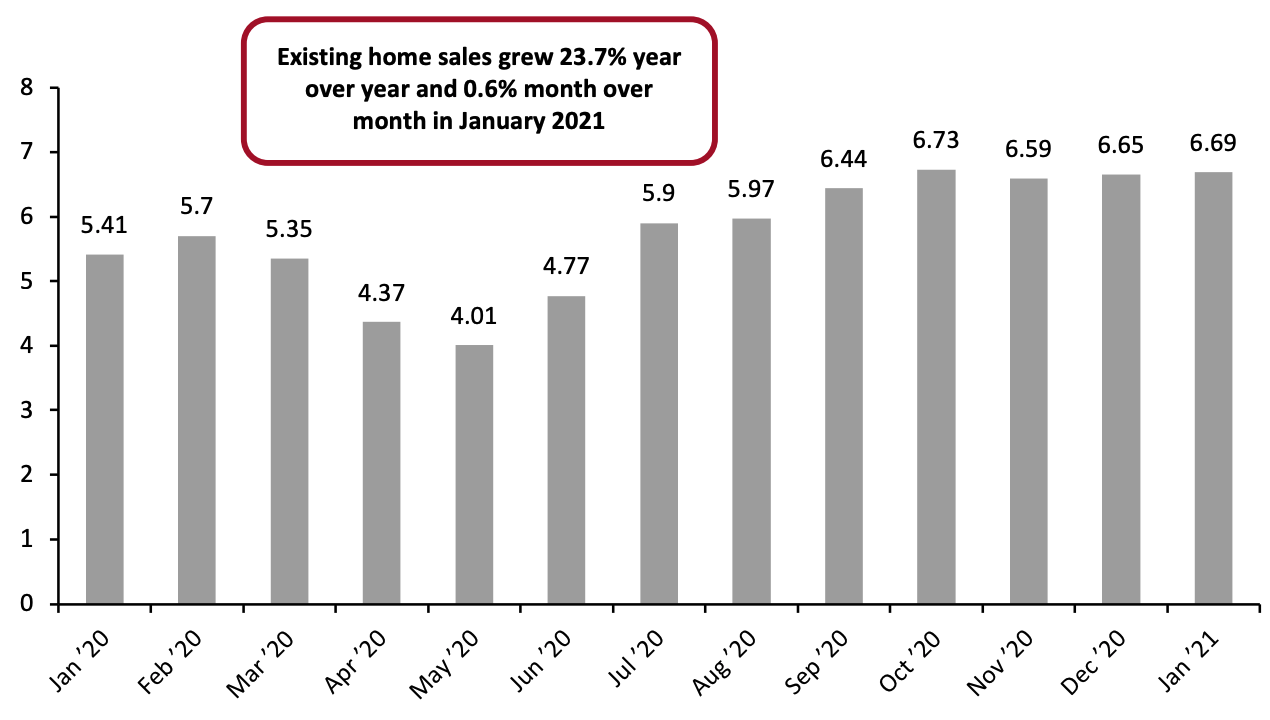 Source: NAR[/caption]
Inventory of New and Existing Homes Listed for Sale
The inventory of new homes listed for sale declined by 5.5% year over year to 307,000 units at the end of January 2021 but increased by 2.7% month over month from December 2020. The inventory will support 4.0 months of sales at the current sales pace, down from 4.1 months in December owing to a relatively large increase in home sales in January. This continues to indicate low inventory levels as supply typically ranges from five to six months in a balanced market. Available existing homes listed for sale declined by 26% year over year, to 1.04 million (a new record low) in January 2021. This compares to 1.40 million units a year earlier, and a decline of 2.8% versus December 2020. The listed inventory in January 2021, representing a supply of 1.9 months, was equal to December’s (2020) supply, which hit a new low.US Pending Home Sales Index
The PHSI, a forward-looking indicator of home sales based on contract signings, grew 13.0% year over year to hit 122.8 in January 2021, according to NAR. All four US regions registered year-over-year increases in the month. An index level of 100 is equal to the level of contract activity in 2001. Despite the year-over-year record, on a month-over-month basis, the Index declined by 2.8% in January, the fifth consecutive month of decline. The dip in pending home sales contracts in recent months is likely due to there being too few homes for sale. Figure 5. US PHSI [caption id="attachment_124485" align="aligncenter" width="720"]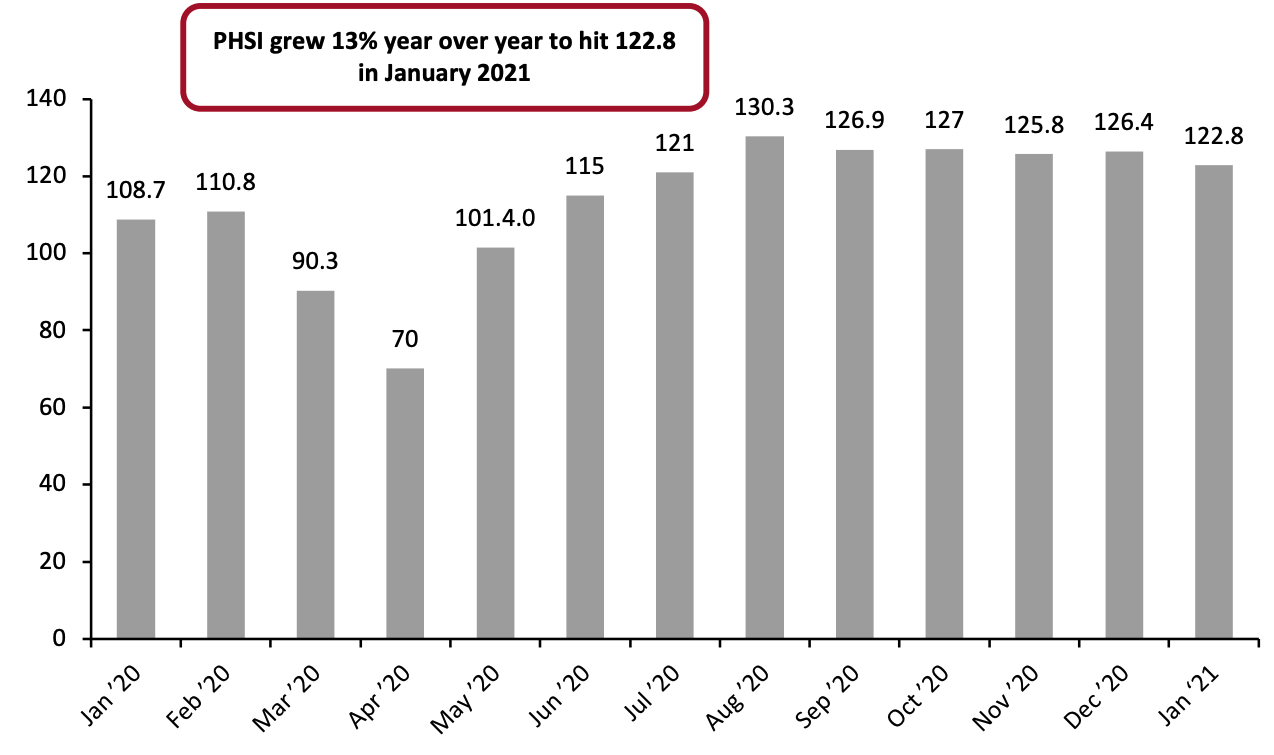 Source: NAR[/caption]
Figure 6. Pending Home Sales Index with Regional Data
[caption id="attachment_124486" align="aligncenter" width="720"]
Source: NAR[/caption]
Figure 6. Pending Home Sales Index with Regional Data
[caption id="attachment_124486" align="aligncenter" width="720"]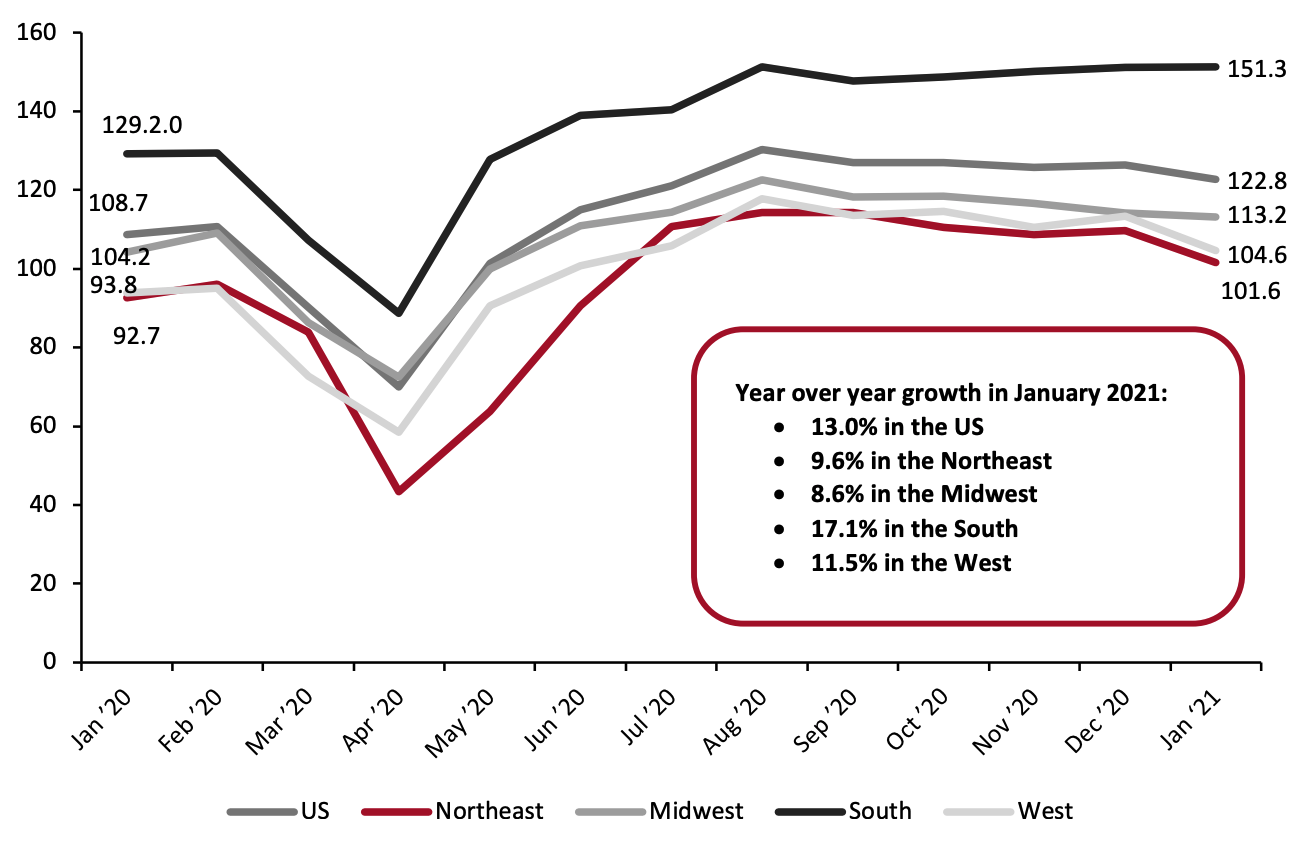 Source: NAR[/caption]
US New Home Sales
New single-family home sales grew 4.3% month over month to 923,000 units (SAAR) in January 2021, versus an upwardly revised figure of 885,000 units in December, and up 19.3% versus January 2020, according to data from the Census Bureau and HUD. In comparison, it registered 1.6% month-over-month growth and 15.2% year-over-year growth in December 2020. We note, however, that monthly data on new home sales can be volatile. Figure 7. US New Home Sales in Units (Thous.) and YoY % Change [caption id="attachment_124487" align="aligncenter" width="720"]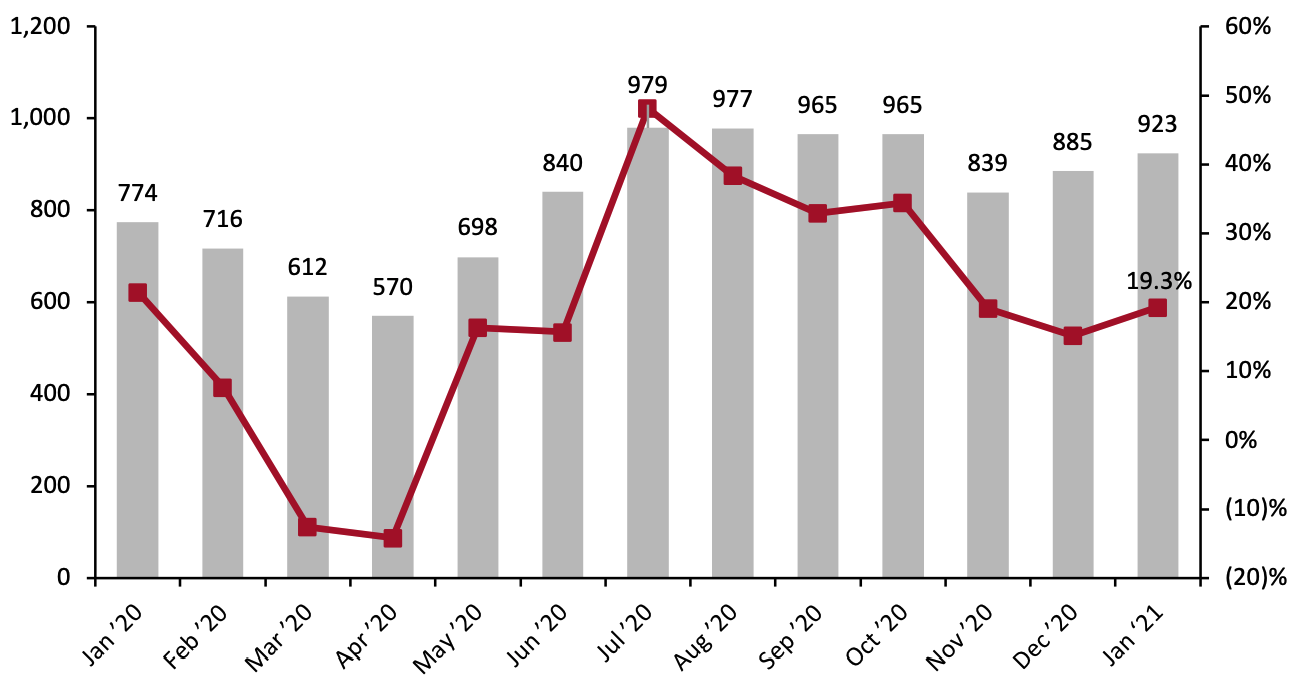 Source: US Census Bureau[/caption]
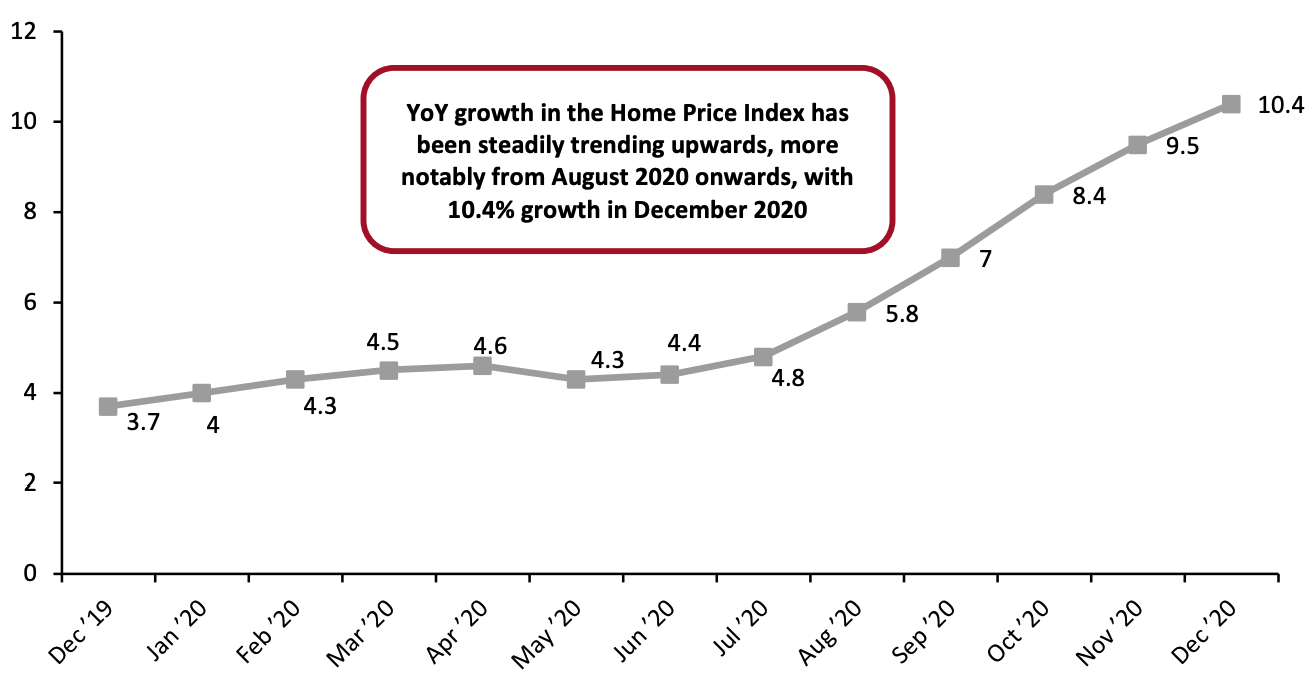
US Home Prices Growth
The latest Case-Shiller Index data release from S&P shows that the growth rate in home prices continues to rise, with December reporting a year-over-year increase of 10.4%, compared to a 9.5% increase reported in November 2020. This represents the strongest annual growth rate in more than six years. The Federal Housing Finance Agency (FHFA) seasonally adjusted purchase-only house price index for December 2020 indicates that home values increased by 1.1% month over month, and by 11.4% versus December 2019, up from 11.0% year-over-year growth in November. Figure 8. S&P/Case-Shiller US National Home Price Index [caption id="attachment_124488" align="aligncenter" width="720"]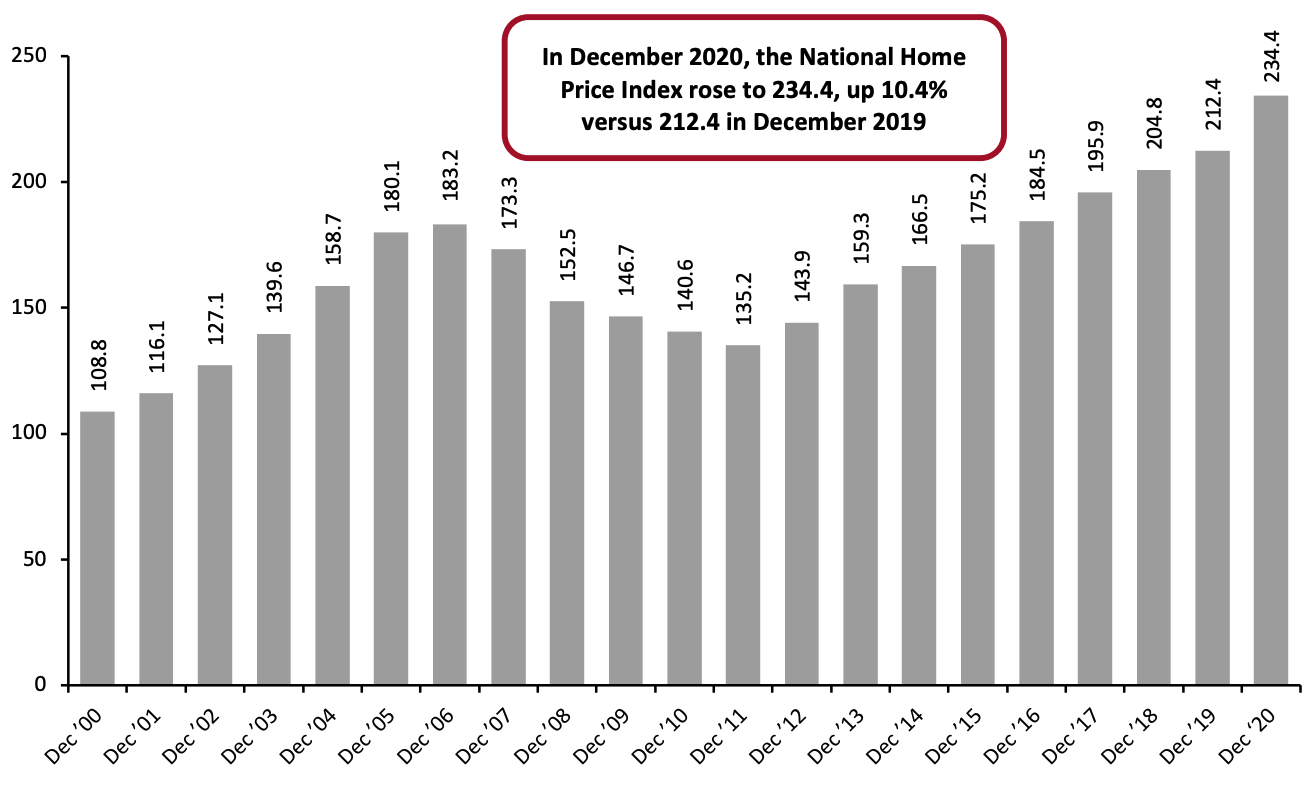 Note: Index Jan 2000=100; not seasonally adjusted
Source: S&P Dow Jones Indices[/caption] Figure 9. S&P/Case-Shiller US National Home Price Index: YoY % Change [caption id="attachment_124489" align="aligncenter" width="720"]
 Note: Index Jan 2000=100; not seasonally adjusted
Source: S&P Dow Jones Indices[/caption]
US Housing Affordability Index
Housing affordability in the US at a national level increased by 2.8% year over year in December 2020, and grew 2.3% month over month compared to November, according to NAR’s Housing Affordability Index. The year-over-year increase indicates that more households could afford to purchase a home in December 2020 compared to December 2019. The monthly Housing Affordability Index represents a way to track whether housing is becoming more or less affordable over time for a typical household, with a higher index number signifying that more households can afford to purchase a home. The HAI takes into account key variables affecting affordability, including housing prices, income and interest rates. [caption id="attachment_124490" align="aligncenter" width="720"]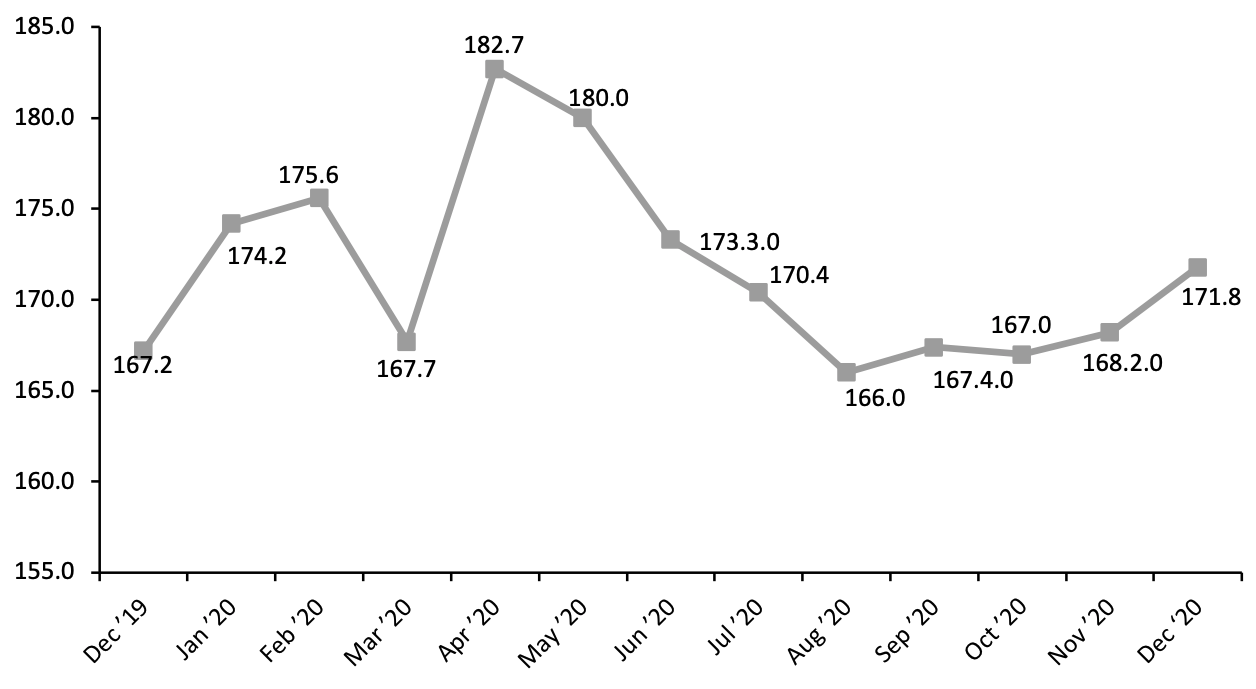 Source: NAR[/caption]