
DIpil Das
Introduction
In this Housing Market Macro Overview report, we analyze and offer insight into the current housing market landscape in the US, based on a range of recent metrics.Overview
Despite the gloomy economic climate in much of 2020, the US residential real estate market fared well overall. Following a brief downturn at the start of the pandemic, home sales in the US saw a strong revival. Housing prices rose sharply, driven by limited homes in the market and low mortgage rates. The average US home was worth $266,104 in December 2020, up 8.4% (or $20,587) versus December 2019 and house prices in all the major regions in the country continue to rise. Home values are growing at their fastest pace in a generation, with no signs of slowing down in 2021, according to various economists and market analysts. The continued month-over-month rise in house prices is an indicator of the strength and resilience of the US housing market amid an economy that is still recovering from a recessionary phase. In spite of continued economic uncertainty and the spread of the pandemic, home buyers are continuing to quickly snap up the comparatively limited homes listed for sale. The rising remote working trend has triggered a suburban boom and the paucity of developed land may mean that builders are not able to meet growing demand, causing home prices to likely continue to trend upwards in 2021. Suburban housing markets are flourishing owing to outbound migration from cities. In Figure 1, we provide an overview of key metrics that indicate the current state of the US housing market.Figure 1. US Housing Market Metrics [caption id="attachment_123356" align="aligncenter" width="725"]
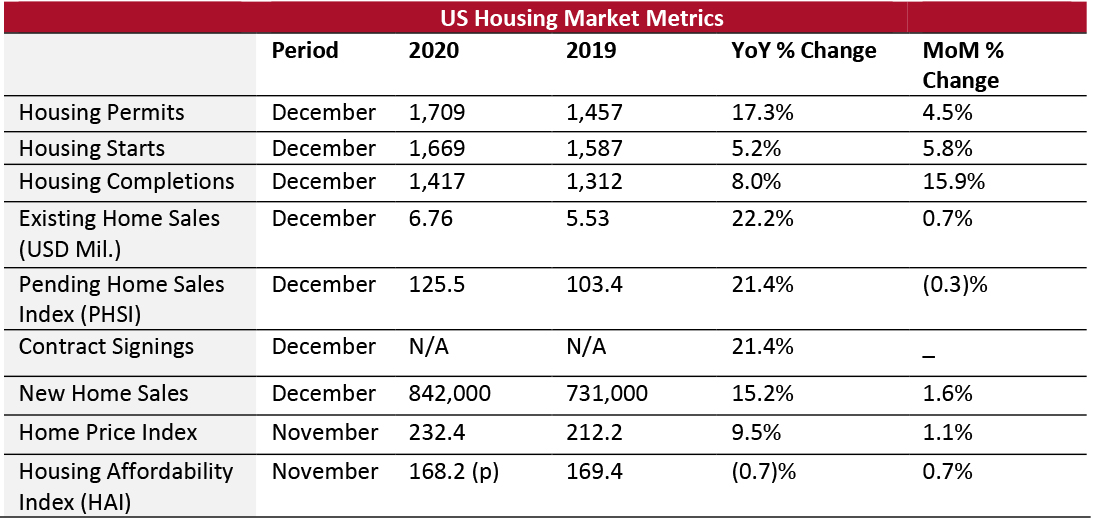 PHSI and Existing Home Sales are based on seasonally adjusted annualized rates (SAAR).
Source: NAR/US Census Bureau[/caption]
Data on Housing Permits, Starts and Completions
As can be seen in Figure 2 and 3, data on housing completions, permits and starts are positive, with all three metrics registering year-over-year and month-over-month growth in December 2020. We typically analyze data on permits in conjunction with housing starts. A growth in the number of issued permits generally signifies improved economic sentiment and an increase in construction investments. Although the number of housing starts was strong at the end of 2020, rising lumber prices are cause for concern, along with increasing regulatory cost concerns that could impact future production.Figure 2. US Housing Permits, Starts and Completions (Thousand Units) [caption id="attachment_123333" align="aligncenter" width="725"]
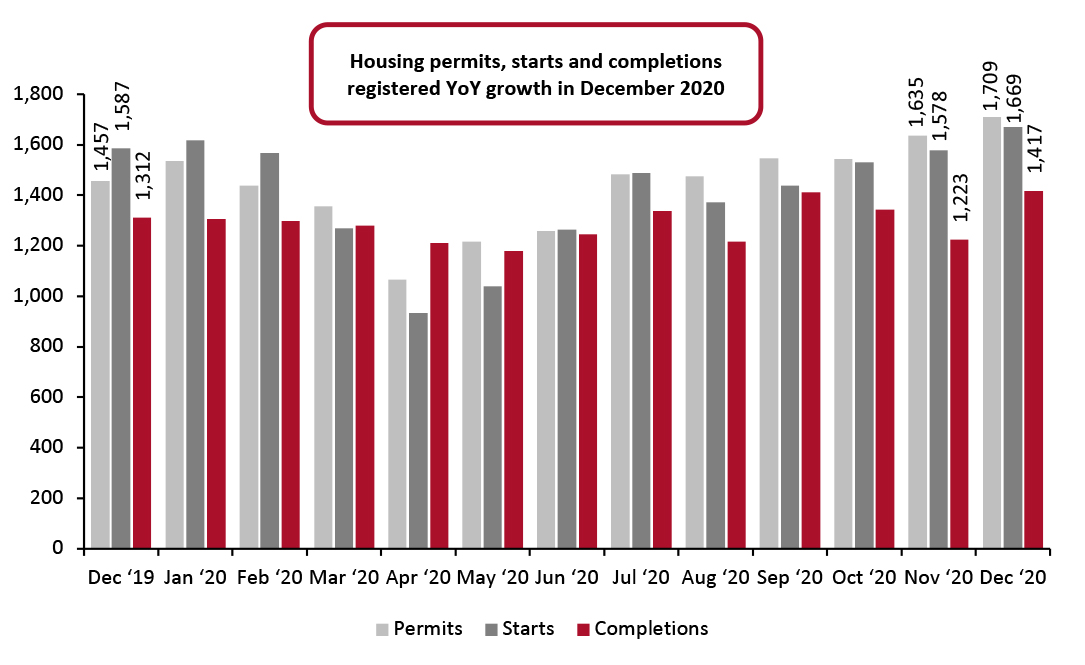 Source: US Census Bureau[/caption]
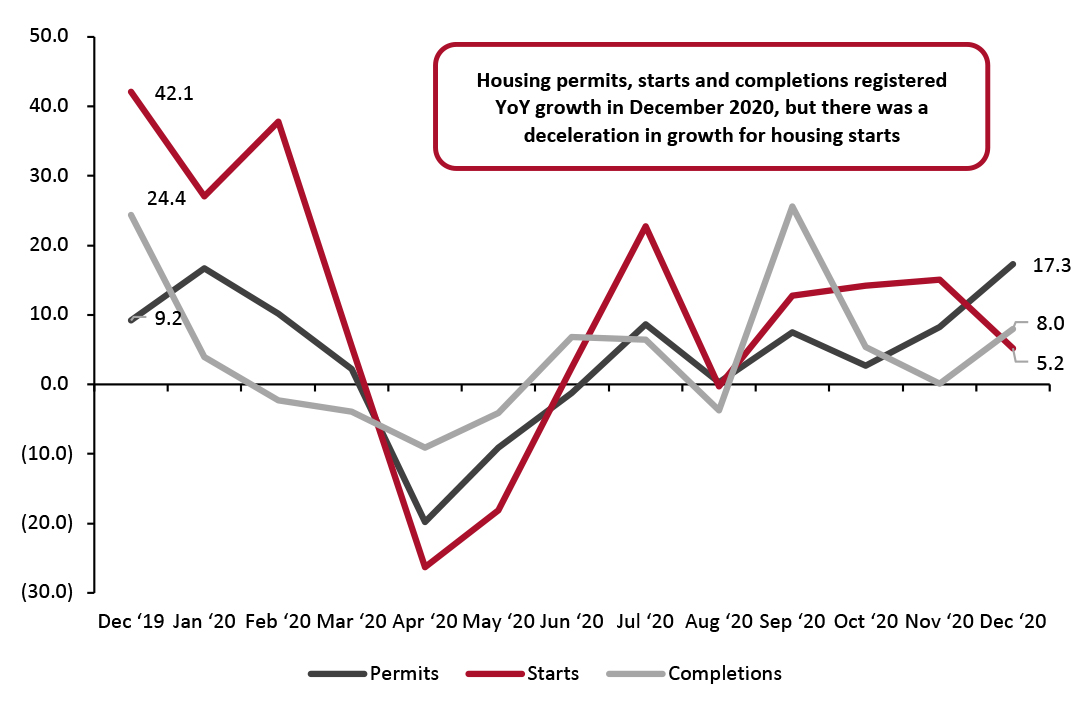
In December 2020, authorized housing permits increased by 4.5% month over month and 17.3% year over year, according to US Census Bureau data. Housing starts increased 5.8% month to month and increased by 5.2% year over year. Housing completions increased by 15.9% month over month and grew 8.0% year over year.
Source: US Census Bureau[/caption]
In December 2020, authorized housing permits increased by 4.5% month over month and 17.3% year over year, according to US Census Bureau data. Housing starts increased 5.8% month to month and increased by 5.2% year over year. Housing completions increased by 15.9% month over month and grew 8.0% year over year.
Figure 3. US Housing Permits, Starts and Completions (YoY % Change) [caption id="attachment_123334" align="aligncenter" width="725"]
 Source: US Census Bureau[/caption]
US Existing Home Sales
According to NAR, existing home (including cooperatives, condominiums, single-family homes and town homes) sales grew 0.7% month over month to 6.76 million units (SAAR) in December 2020, from an upwardly revised figure of 6.71 million in November, and up 22.2% year over year versus December 2019. Since existing home sales are based on a closing, December sales represent contract signings in October and November. For the full year 2020, existing home sales grew to 5.64 million units, up 5.6% versus 2019, and the strongest pace since 2006.Figure 4. US Existing Home Sales in Units (Mil.) [caption id="attachment_123335" align="aligncenter" width="725"]
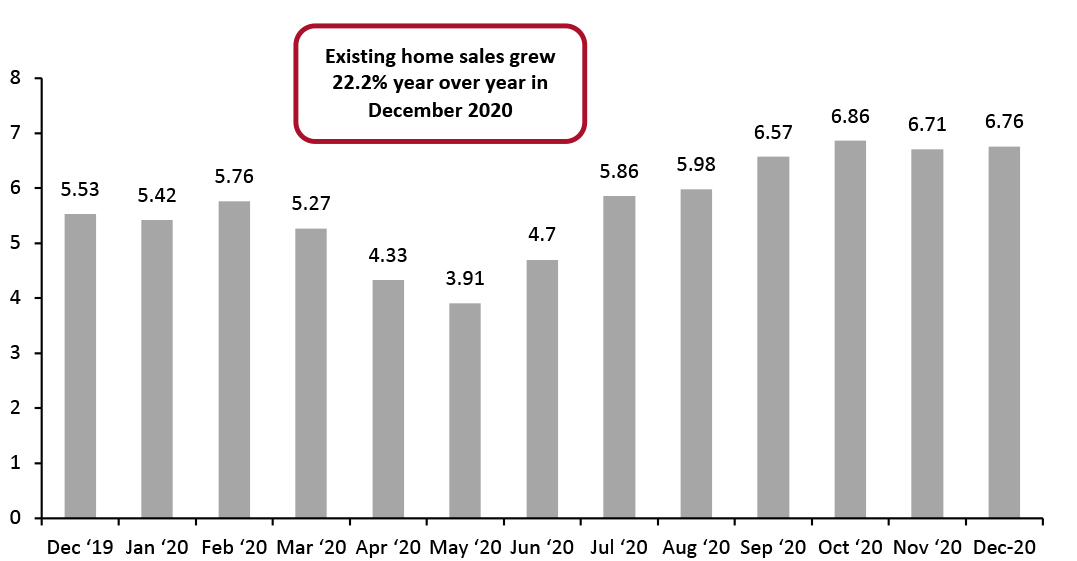 Source: NAR[/caption]
Inventory of New and Existing Homes Listed for Sale
The inventory of new homes listed for sale declined by 6.2% year over year to 302,000 units at the end of December 2020 but increased by 4.1% month over month from November 2020. The inventory will support 4.3 months of sales at the current sales pace, up from 4.2 months in November. Available existing homes listed for sale declined by 23% year over year to 1.07 million in December 2020—a new low. This compares to 1.39 million units a year earlier, and a decline of 16.4% versus November 2020. The listed inventory represents a record-low 1.9-month supply and a dip from 2.3 months in November, which represented the previous record low. A shortage in homes for sale, particularly at the lower end of the market, has been a constraint on sales for several years.US Pending Home Sales Index
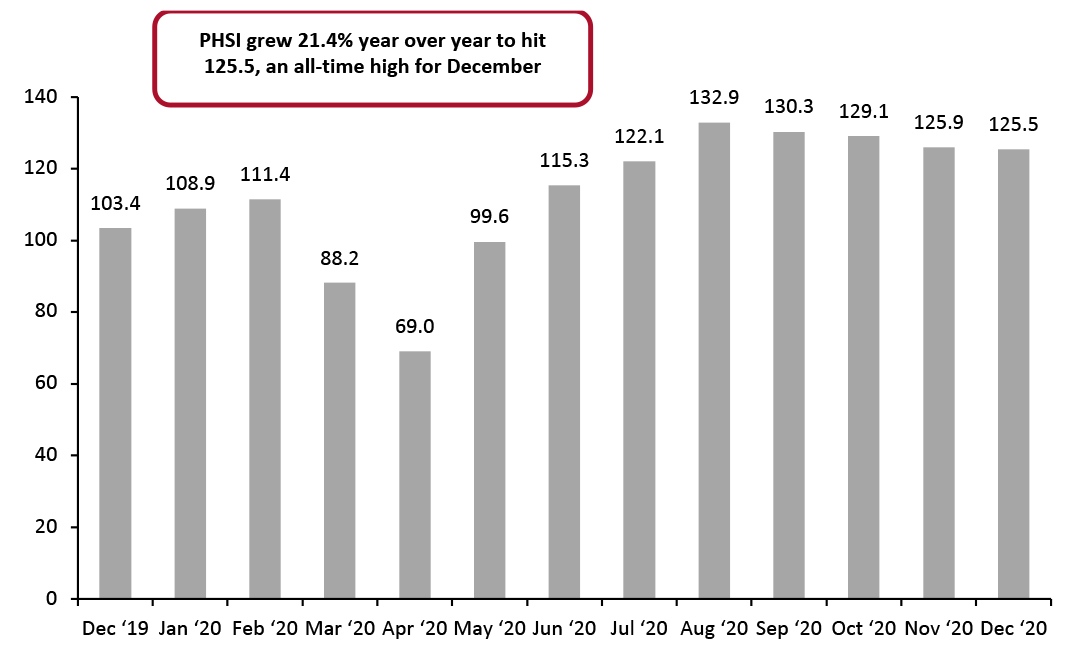
The PHSI, a forward-looking indicator of home sales based on contract signings, grew 21.4% year over year to hit 125.5 in December 2020, according to NAR. This represents an all-time high for December, with all four US regions reaching double-digit year-over-year increases in the month. An index level of 100 is equal to the level of contract activity in 2001. Despite the year-over-year record, on a month-over-month basis, the Index declined by 0.3% in December, the fourth straight month of decline. The dip in pending home sales in recent months can likely be attributed to there being too few homes for sale.Figure 5. US PHSI [caption id="attachment_123336" align="aligncenter" width="725"]
 Source: NAR[/caption]
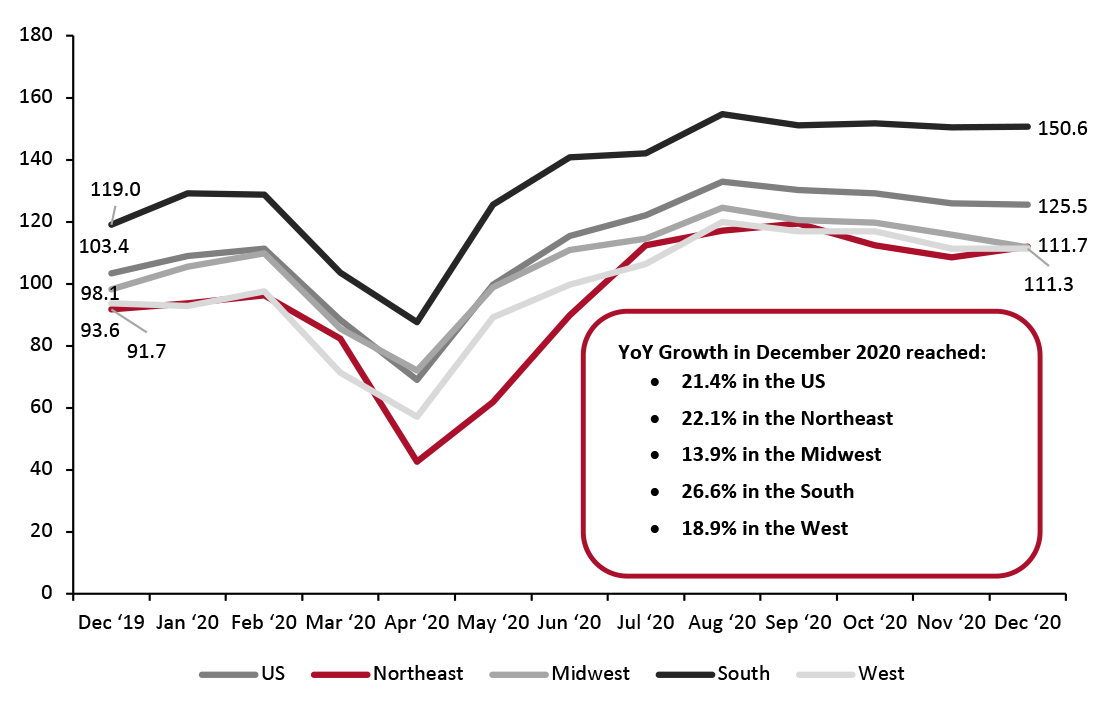
Figure 6. Pending Home Sales Index with Regional Data [caption id="attachment_123337" align="aligncenter" width="725"]
 Source: NAR[/caption]
US New Home Sales
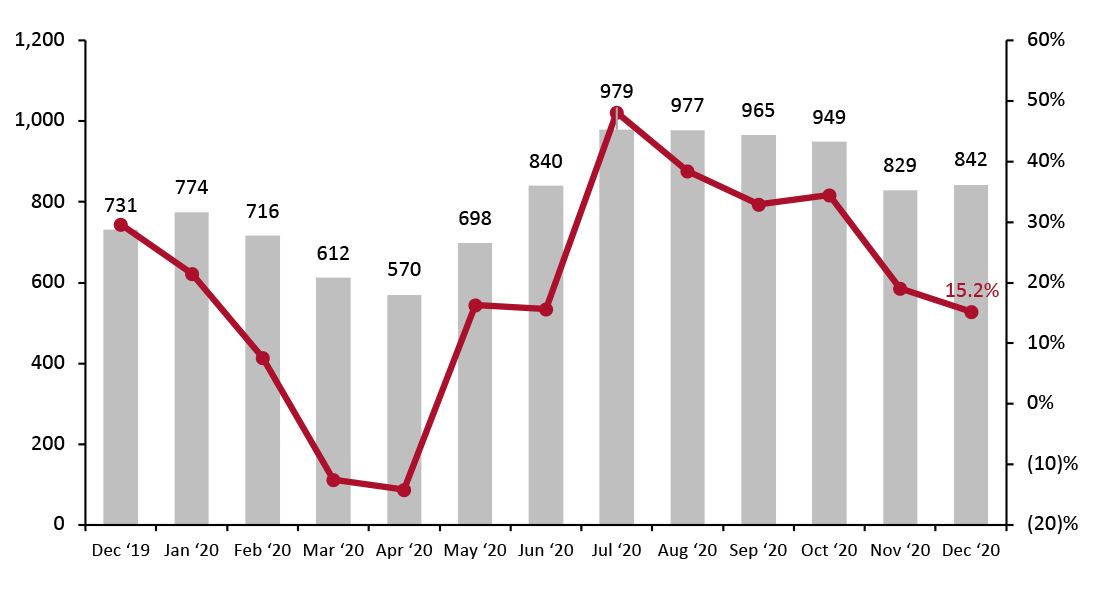
New single-family home sales grew 1.6% month over month to 842,000 units (SAAR) in December 2020, versus a downwardly revised figure of 829,000 units in November, and up 15.2% versus December 2019, according to data from the Census Bureau and HUD. We note, however, that monthly data on new home sales can be volatile. For the full year 2020, aggregate sales reached 811,000 units, up 18.7% versus 2019, and the strongest pace since 2006. New home sales are based on signed purchase agreements, rather than a closed sale, similar to the case with existing homes.Figure 7. US New Home Sales in Units (Thousands) and YoY % Change [caption id="attachment_123338" align="aligncenter" width="725"]
 Source: US Census Bureau[/caption]
US Home Prices Growth
The latest Case-Shiller Index data release from S&P shows that the growth rate in home prices continues to rise, with November reporting a year-over-year increase of 9.5%, compared to a 3.4% increase reported in November 2019. This represents the strongest annual growth rate in more than six years, and a notably stronger gain compared to October, when prices grew 8.4%. The Federal Housing Finance Agency (FHFA) seasonally adjusted purchase-only house price Index for November 2020 indicates that home values increased by 1.0% month over month, and by 11.0% versus November 2019, up from 10.3% year-over-year growth in October.Figure 8. S&P/Case-Shiller US National Home Price Index [caption id="attachment_123381" align="aligncenter" width="720"]
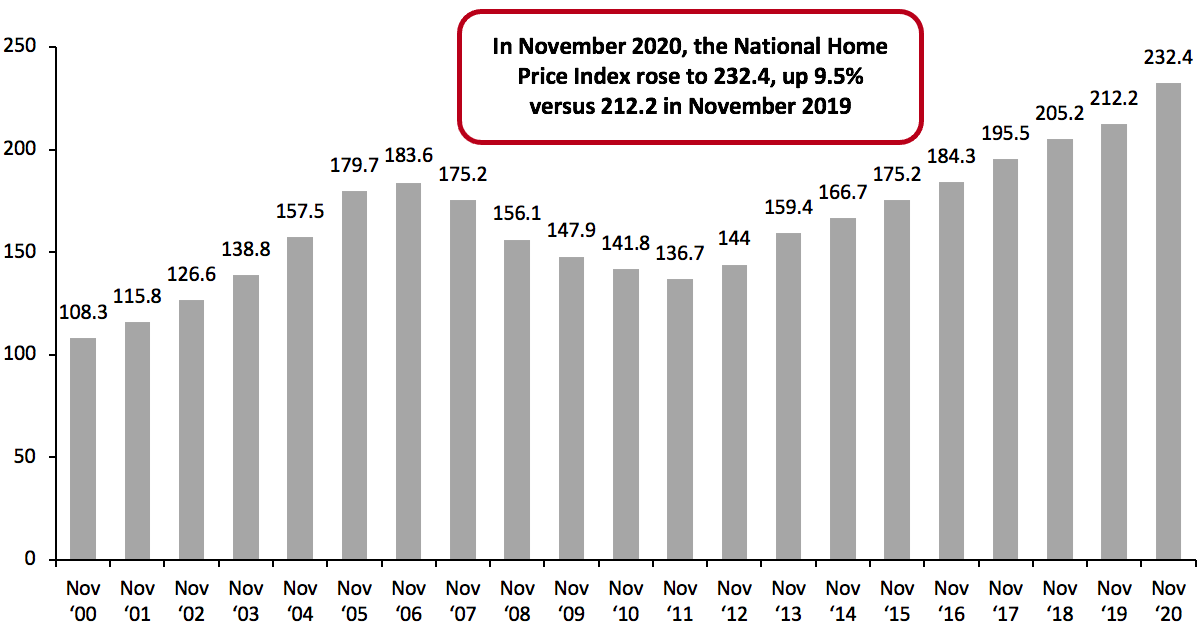 Note: Index Jan 2000=100; not seasonally adjusted
Source: S&P Dow Jones Indices[/caption]
Figure 9. S&P/Case-Shiller US National Home Price Index: YoY % Change [caption id="attachment_123340" align="aligncenter" width="725"]
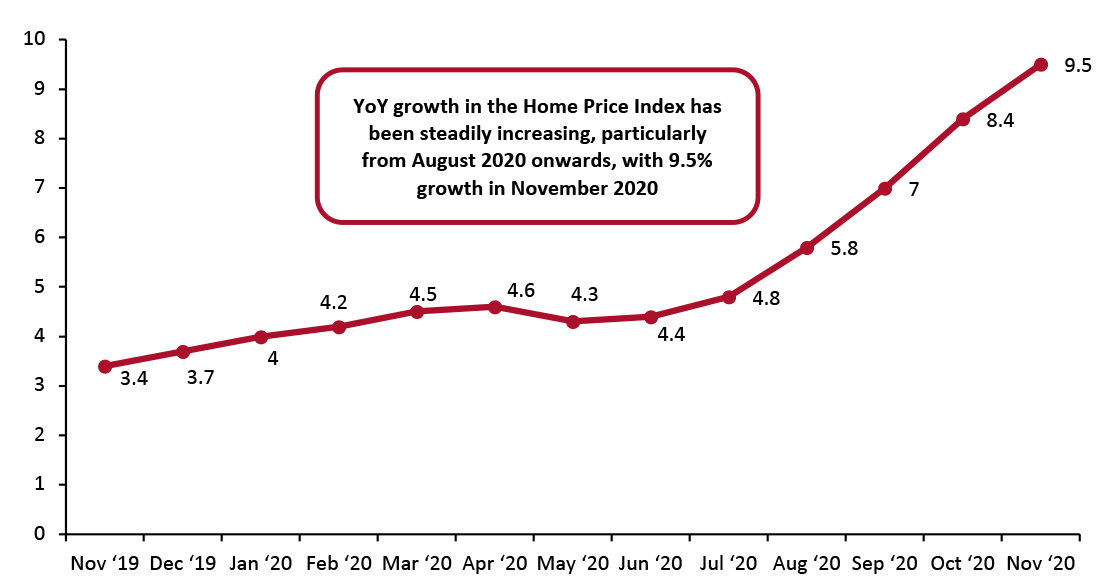 Note: Index Jan 2000=100; not seasonally adjusted
 Source: S&P Dow Jones Indices [/caption]
US Housing Affordability Index
Housing affordability in the US at a national level declined by 0.7% year over year in November 2020, but grew modestly month over month compared to October, according to NAR’s Housing Affordability Index. The year-over-year decline indicates that less households could afford to purchase a home in November 2020 compared to November 2019. The monthly Housing Affordability Index offers a way to track whether housing is becoming more or less affordable over time for a typical household, with a higher index number indicating that more households can afford to purchase a home. The HAI takes into account key variables affecting affordability, including housing prices, income and interest rates.Figure 10. Housing Affordability Index [caption id="attachment_123341" align="aligncenter" width="725"]
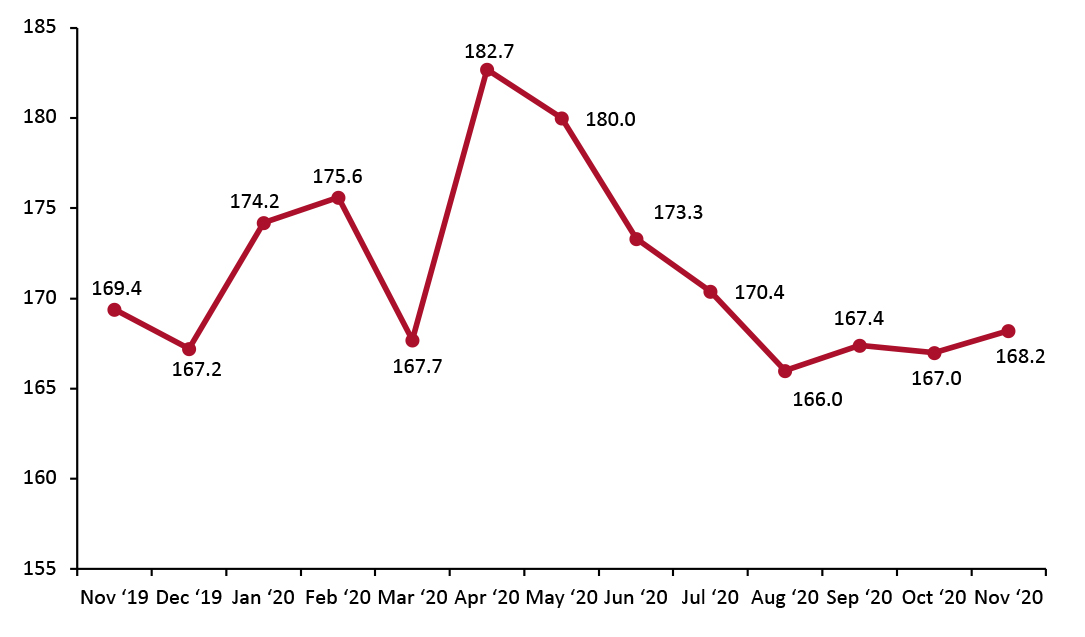 Source: NAR[/caption]