Excluding motor vehicles and part
Source: comScore/US Census Bureau
comScore’s e-‐commerce data include sales for retail (excluding auction sites, event tickets and nonretail travel) desktop transactions only. The data exclude transactions made via smartphones and tablet devices, which account for a growing share of 14.7% of total e-‐commerce sales. Therefore, the comScore data under represent year-‐over-‐year growth rates in e-‐commerce. Since many consumers have shifted to mobile and are increasingly using the online and mobile channels interchangeably, FBIC believes desktop sales growth will slow in the not-‐too-‐distant future.
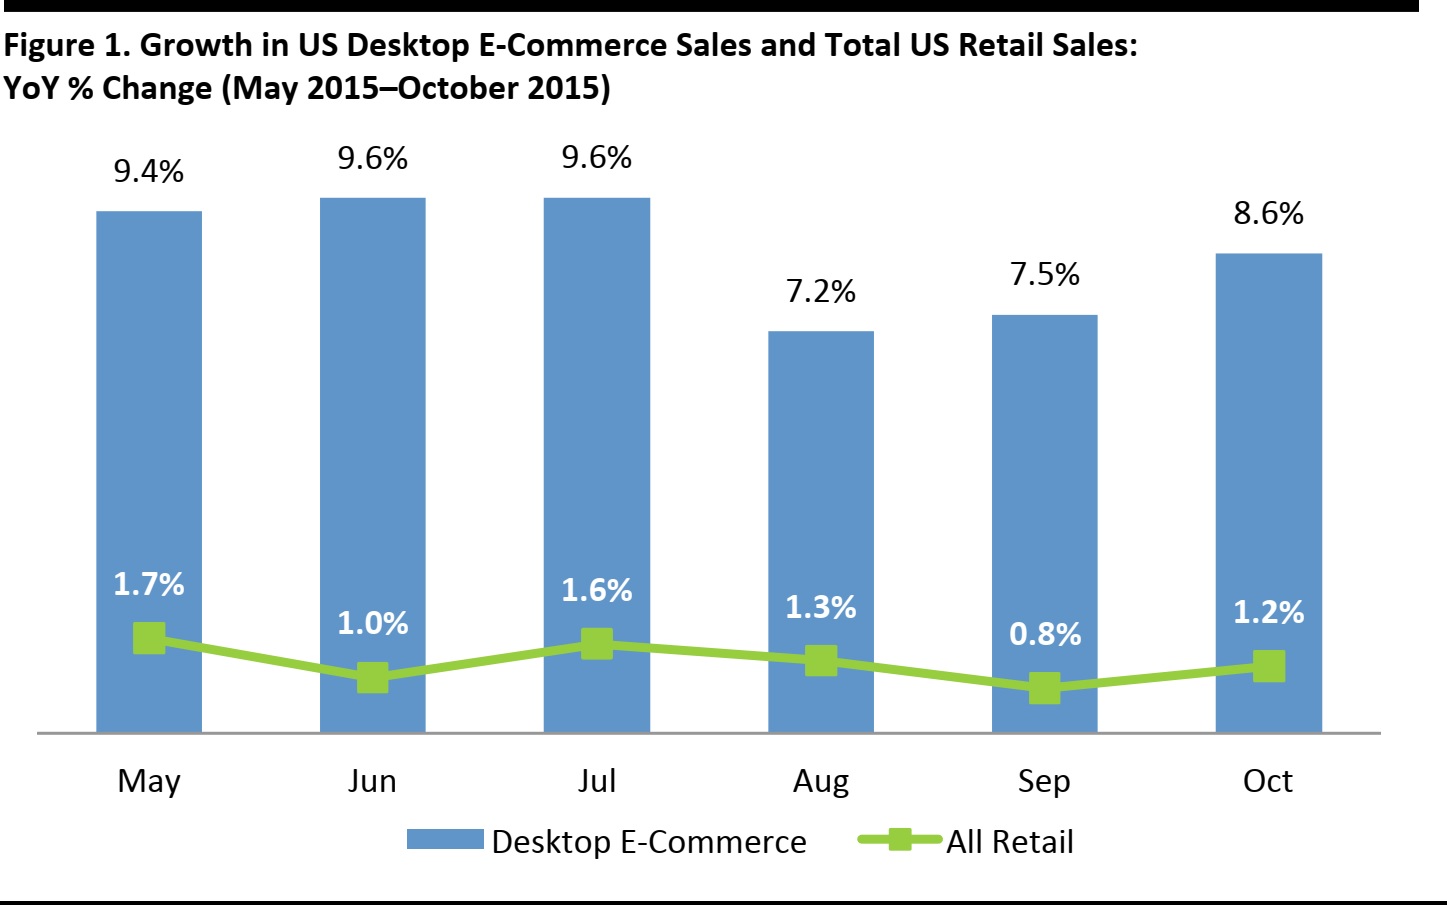
Overall, US retail sales (excluding autos) rose slightly in October after being flat month over month in September. Retail sales excluding autos, gasoline, building materials and food services roseby 0.2% month over month in October. The increase was largely driven by sales at nonstore retailers, including online sales, which increased by 1.4% over September. Consumers also spent more at furniture, building materials and garden supply stores, and at health and personal care stores. Online desktop spending (excluding nonretail categories) increased by 8.6% year over year, to $19.3 billion during the month. October year-‐ over-‐year growth in web traffic varied from company to company, though more companies experienced acceleration in traffic, consistent with the overall improvement in October retail sales.
THE RUNDOWN BY CATEGORY FOR OCTOBER
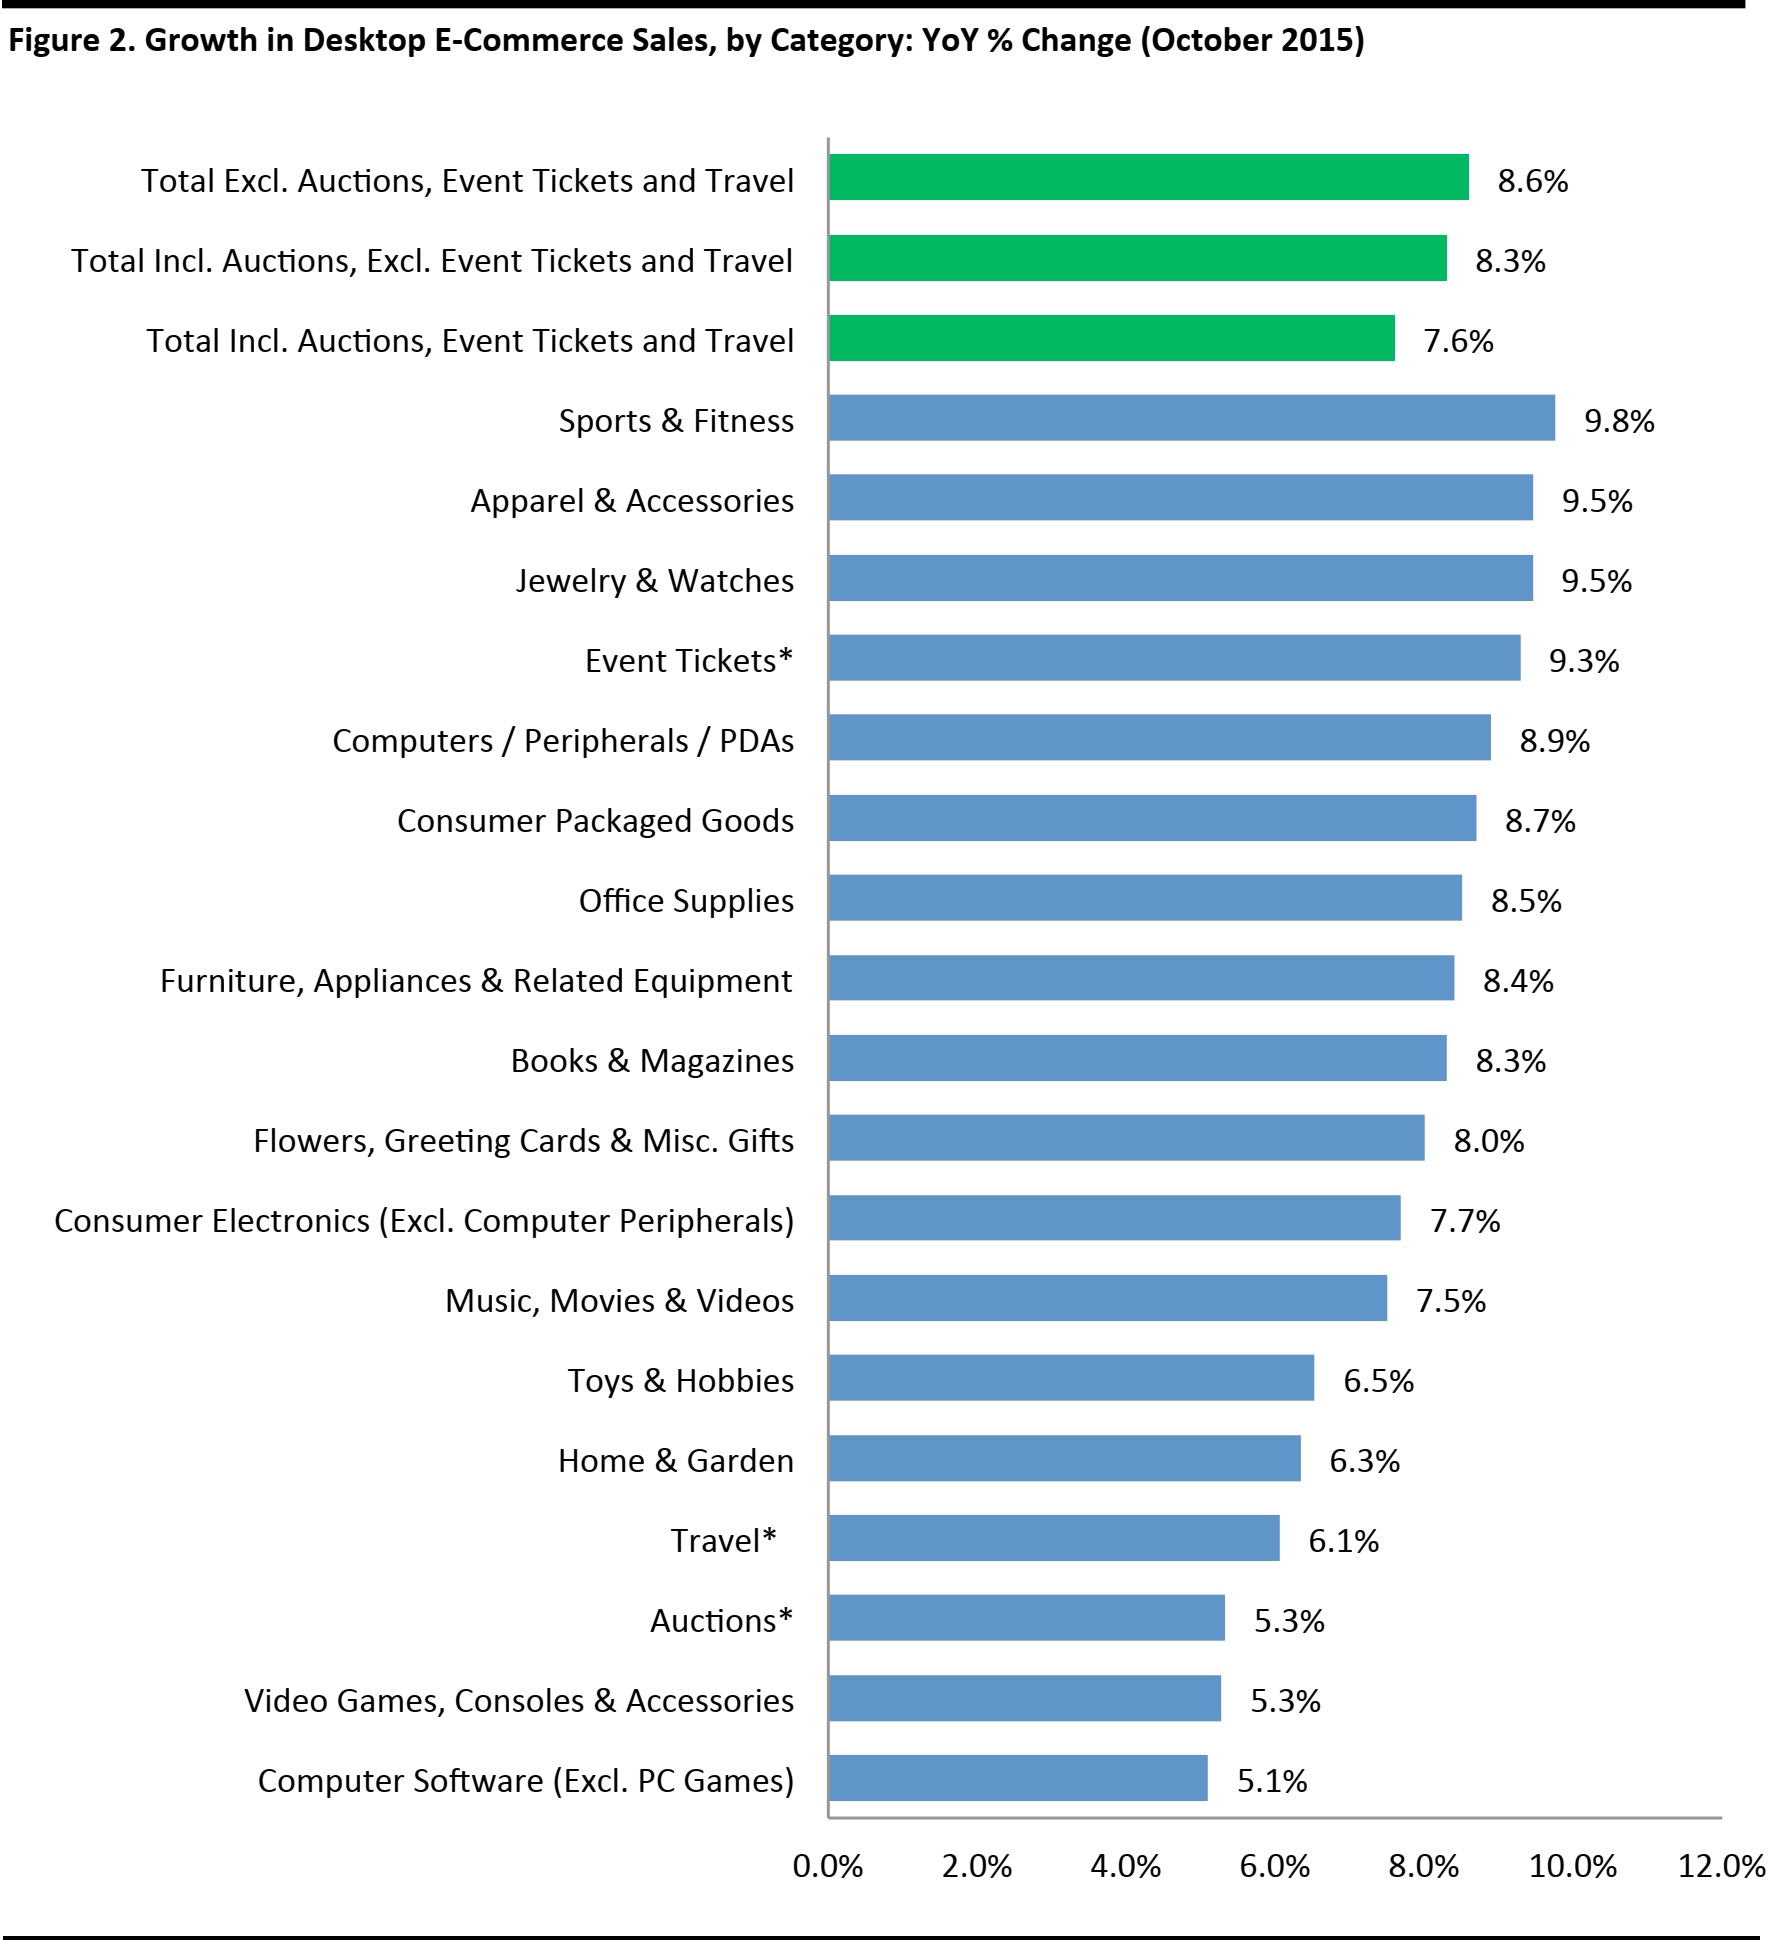
*Nonretail categories
Source: comScore/FBIC Global Retail & Technology
SOLID POSITIVE OCTOBER E-‐COMMERCE RESULTS
- In October, online desktop retail spending increased by 8.6% year over year, to $19.3 billion, excluding auction sites, event tickets and travel. Online desktop retail spending rose by 8.1% year over year in the third quarter.
- Notable segments that contributed to the October figures included:
- Sports & Fitness: up 9.8% year over year, to $267 million
- Apparel & Accessories: up 9.5% year over year, to $3.6 billion
- Jewelry & Watches: up 9.5% year over year, to $368 million
- Computers, Peripherals & PDAs: up 8.9% year over year, to $4.1 billion
- Consumer Packaged Goods: up 8.7% year over year, to $1.6 billion
- Growth was weaker in October. Home & Garden was up by 6.3% year over year in October, versus 3% in September. The Computer Software (Excluding PC Games) category lagged all other categories, growing just 5.1% year over year.
- Online desktop retail spending, excluding event tickets and travel, rose by 8.3% in October, to $21.1 billion. Auctions experienced growth of 5.3% year over year.
- Total US online desktop spending rose by 7.6% in October, to $31.7 billion. Online spending on travel was up by 6.1% year over year: hotel reservations were up by 7.2%, air travel by 6.1%, car rentals by 5.1% and travel packages by 3.9%.
QUARTERLY COMSCORE DATA VS. US CENSUS BUREAU DATA
comScore and the US Census Bureau both provide quarterly data on e-‐commerce sales. Both data sets include mobile commerce, which captures a more meaningful view of total online sales. Third-‐quarter m-‐ commerce sales have yet to be released. However, comScore has reported desktop spending (excluding mobile) for the third quarter: the analytics company reported that online retail sales grew by 8.1% year over year in the third quarter, to $54.2 billion.
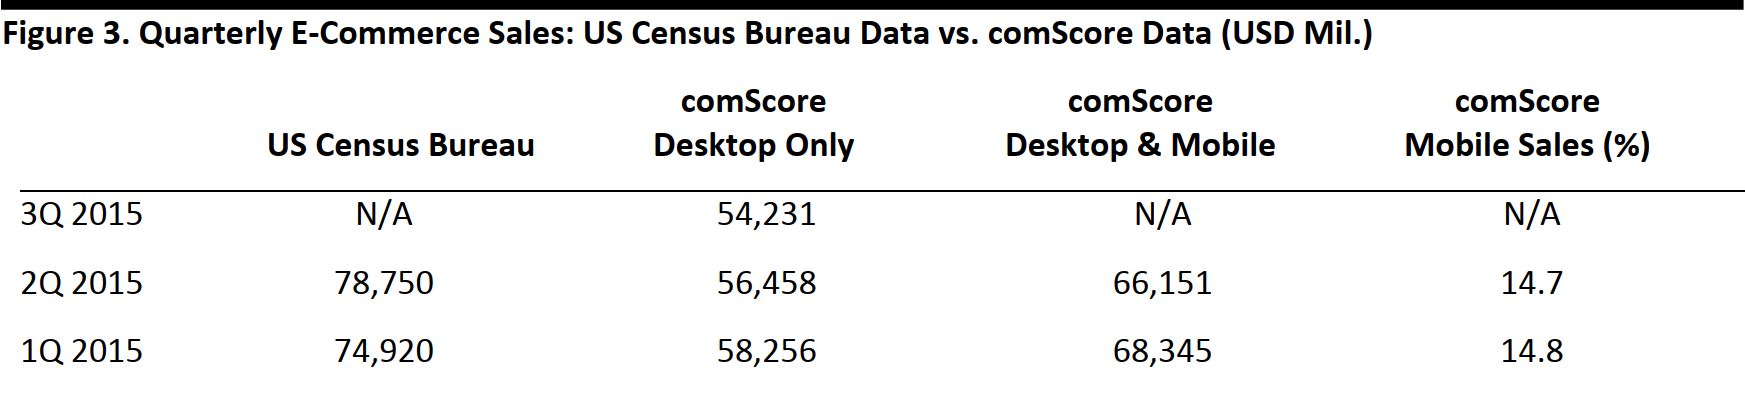
comScore data are for retail only, excluding auctions, event tickets and travel.
Source: comScore/US Census Bureau/FBIC Global Retail & Technology
In the second quarter, comScore reported that total e-‐commerce retail desktop and mobile sales were $66.2 billion, up 13.8% over the same period last year. Total mobile retail sales captured 14.7% of digital dollars in the second quarter, indicating that there is a noteworthy opportunity in terms of the mobile monetization gap for those retailers that are investing in mobile and tablet apps. We expect mobile sales to account for a greater percentage of e-‐commerce sales in the third-‐quarter data.
COMSCORE VISITOR DATA
comScore’s visitor data include mobile and desktop visits, which provide a fuller picture than figures that show only total e-‐commerce numbers. Please note that comScore visitor data tracks only smartphone and tablet data for mobile purchases.
The number of total unique visitors to all retail websites grew by4.9% year over year in October, reflecting the maturity of the Internet channel in the US. Value growth online is principally being driven by existing Internet users spending more online.
Brick-‐and-‐mortar retailers Home Depot and Best Buy saw some of the strongest visitor growth in October. This reflects the catch-‐up process some store-‐based retailers are playing as they seek to meet the new demand of online shoppers and compete with pure plays, which have enjoyed a head start when it comes to the online channel.
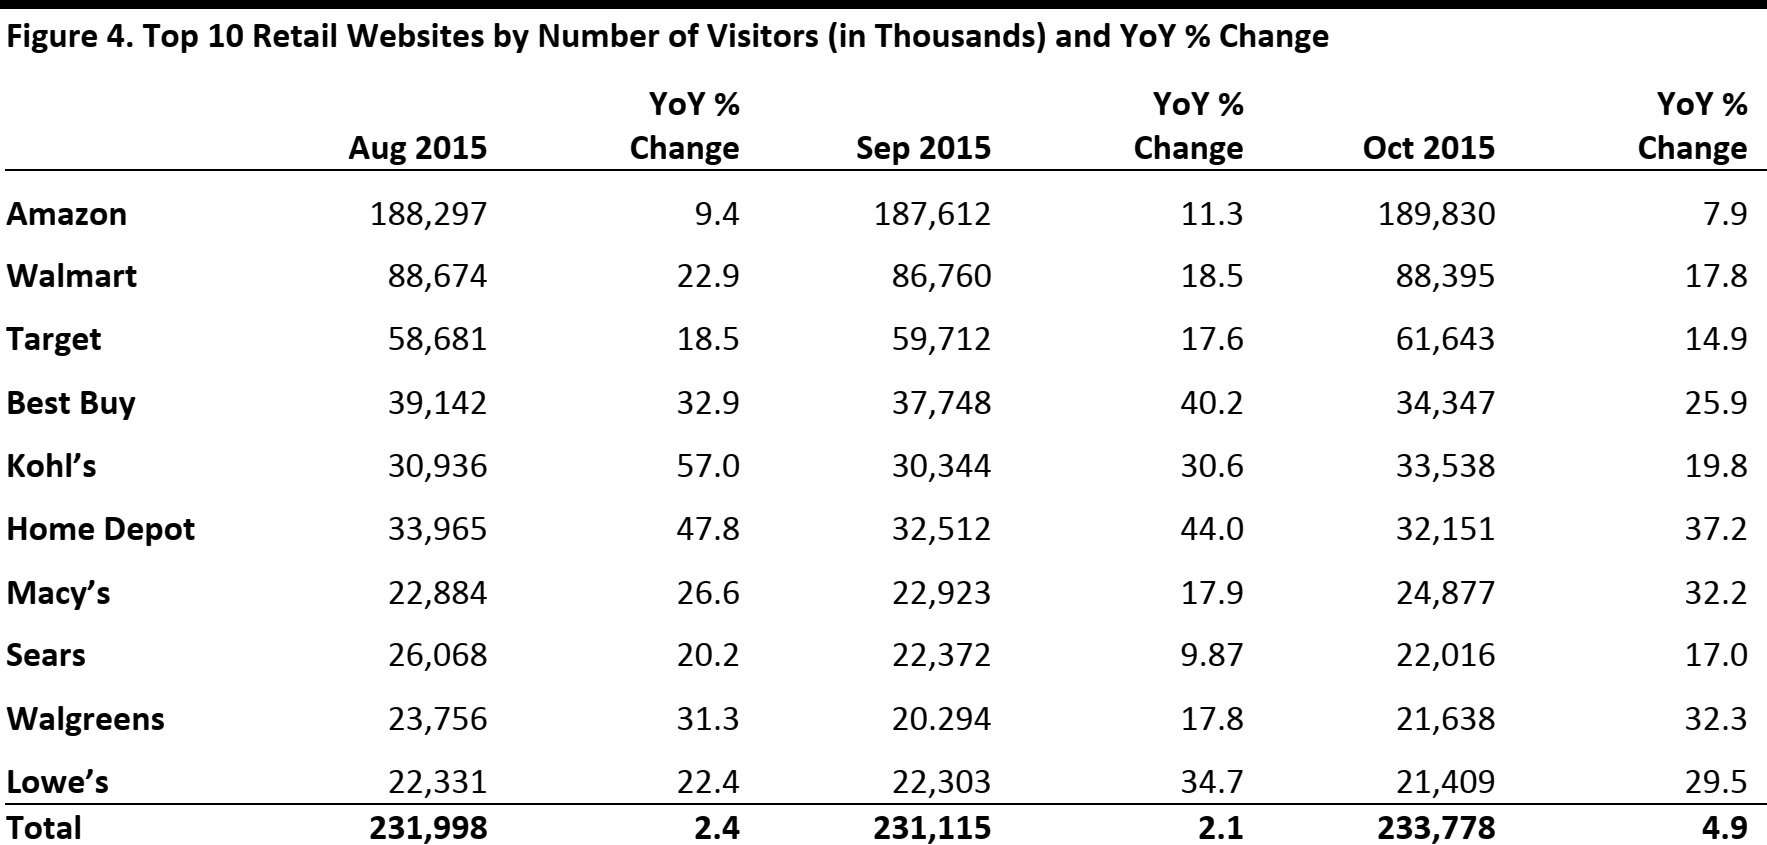
Total includes visitors of multiple websites.
Source: comScore/FBIC Global Retail & Technology
Amazon: Amazon experienced relatively modest, 7.9% year-‐over-‐year growth in the number of visitors to its site in October. With nearly 190 million unique visitors, Amazon.com was the most-‐visited website. Amazon recently launched Amazon Underground, a new app for Android phones that includes the same functionality as the Amazon iOS mobile shopping app plus over $10,000 worth of apps, games and in-‐app items for free. Additionally, the company added Prime Now service to eight metro areas in the past quarter. Prime members can now choose from tens of thousands of daily essentials with free two-‐hour and paid one-‐hour delivery in 17 locations around the world.
Walmart: Walmart enjoyed year-‐over-‐year site traffic growth of 17.8% in October. Walmart.com was the second-‐most-‐visited website behind Amazon.com, with over 88 million unique visitors. The strong growth was driven by the company’s recent efforts to improve its app and simplify the checkout process on Walmart.com. The retailer cut its checkout load time from 7.2 seconds to 2.9 seconds, reportedly increasing conversions by 2%. Walmart also opened two automated fulfillment centers in the third quarter, in order to scale fast delivery to customers all across the US.
Home Depot: HomeDepot.com experienced the strongest October year-‐over-‐year visitor growth among the top 10 retailers. The company has increased its online presence with initiatives such as buy online, ship to store; buy online, pick up in store; and buy online, return in store. Home Depot is also investing in its supply chain to support online growth, completing a fulfillment center in Troy Township, Ohio. The center will allow Home Depot to ship parcels to 90% of US customers within two days or less. Sales and traffic have also benefited from an improving housing market.
Source: comScore/FBIC Global Retail & Technology
NOVEMBER PREVIEW
We expect visitor and e-‐commerce figures to benefit from holiday shopping, which the National Retail Federation (NRF) projects will increase by 3.7% this year, to $630.5 billion—a gain that would be above the 10-‐year average of 2.5% holiday sales growth. According to the NRF’s
Holiday Consumer Spending Survey conducted by Prosper Insights and Analytics, 56.6% of those celebrating the holidays had already started shopping by early November, up from 54.4% last year. According to the survey, 46.1% of holiday shopping, consisting of browsing and buying, will be done online, up from 44.4% last year and the highest percentage recorded since NRF first asked in 2006.
We expect m-‐commerce penetration to increase in November as consumers use new and improved mobile sites to compare prices during the holiday season. Smartphone traffic numbers will benefit from more consumers researching products (37.9% versus 35.8% last year) and researching retailer information such as store hours and directions (28.4% versus 26.9% last year). Tablet owners plan to be just as mobile-‐active; nearly half (47.5%) will use their device to research products and 34.4% will use their tablet to make a holiday purchase.
According to comScore, 51% of e-‐commerce shoppers view free shipping/shipping promotions as the most essential factor when deciding where to shop, while only 28% cite the availability of online-‐only discounts as their top priority. Recent improvements in shipping speeds and in buy online, pick up in store options will be key for this year’s holiday season. We believe retailers that have successfully implemented buy online, pick up in store service—such as Kohl’s, Home Depot, Macy’s and Walmart—will benefit from purchases made by consumers who plan to shop online but still want to visit the store. Additionally, Target announced it will drop shipping fees for all online orders during the shopping season for the second year in a row.It will be interesting to see how these holiday retail strategies affect online retail sales and traffic numbers in November.
