Nitheesh NH
The Coresight Research and IRI monthly US CPG Sales Tracker provides our data-driven insights into online sales trends in the US CPG industry—covering the product categories of food & beverage; health & beauty; and general merchandise & homecare. In this report, we present five key insights into the four weeks ended April 18, 2021.
1. Online CPG Growth Slows Against Strong Comparatives
CPG e-commerce grew 5.3% for the four weeks ended April 18, 2021, versus 23.1% in the prior period. This substantial slowing of growth is partly due to the annualization of pandemic spending patterns. As Covid-19 hit the US in March 2020, the industry saw a boom in online spending boosted by stockpiling and subsequent lockdown announcements by state and local governments, which mandated the temporary closure of nonessential physical stores. E-commerce CPG sales rose by 55.7% for the four weeks ended March 22, 2020, and further climbed to 87.3% year-over-year growth in the four weeks ended April 19, 2020.
Last year, CPG e-commerce sales growth peaked in the four weeks ended May 17, at 93.8%. We therefore expect that year-year-over growth in May 2021 will slide to negative due to the strong comparatives.
Figure 1. CPG E-Commerce and Total Sales Growth (YoY % Change)
[caption id="attachment_127079" align="aligncenter" width="720"]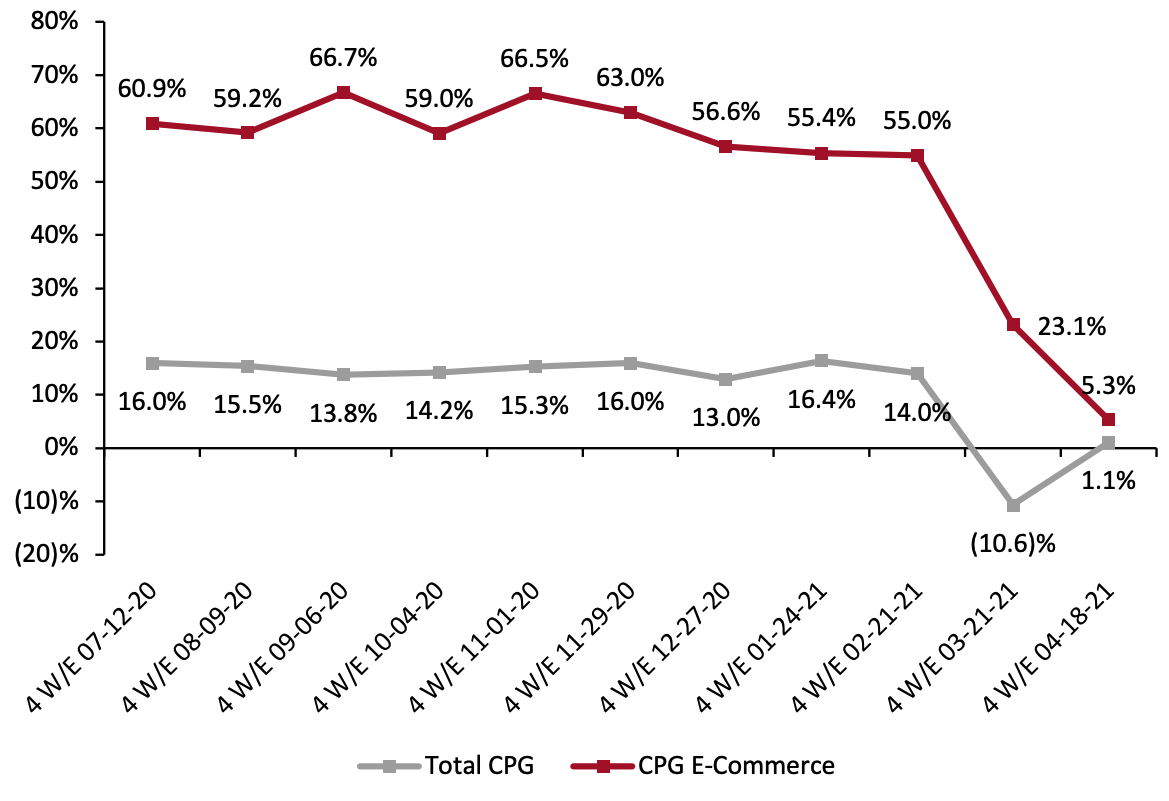 Historical data have been revised for the latest period
Source: IRI E-Market Insights™/Coresight Research[/caption] However, comparing CPG e-commerce sales to the period two years prior shows strong positive growth for the four weeks ended April 18, 2021, with sales almost doubling. Figure 2. CPG E-Commerce and Total Sales Growth (% Change from Two Years Prior) [caption id="attachment_127080" align="aligncenter" width="720"]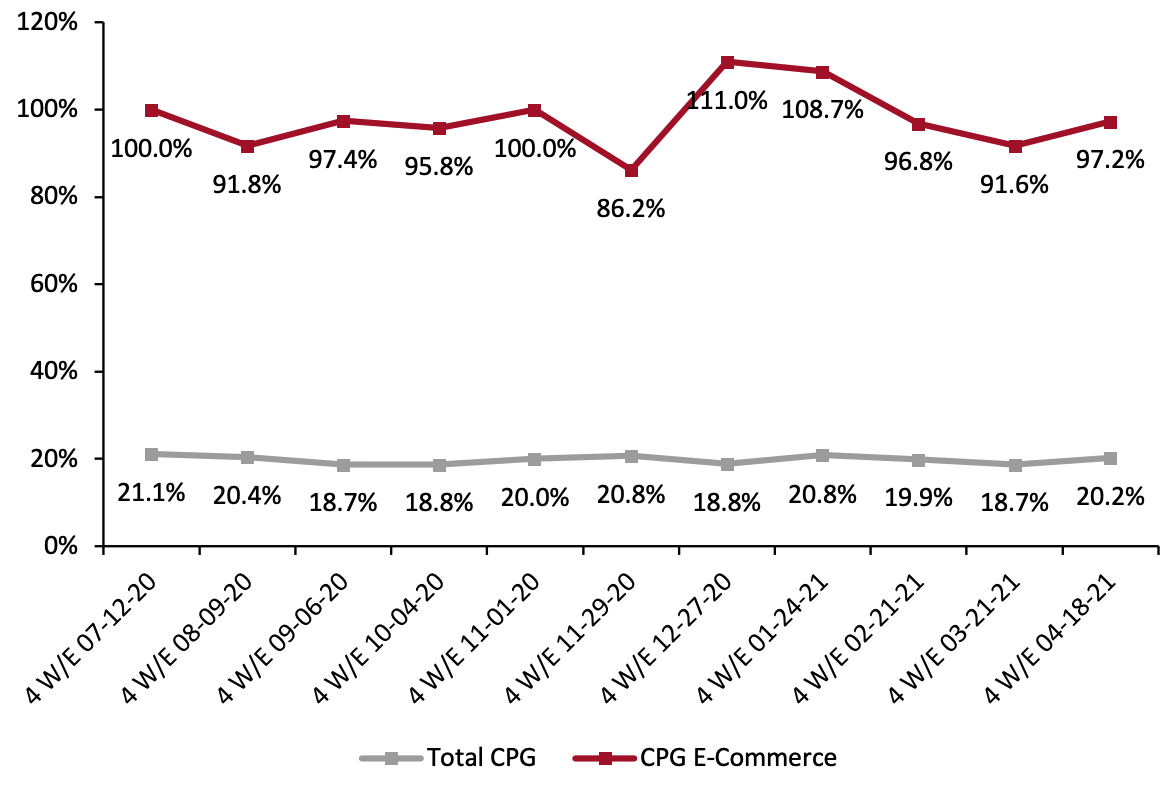 Historical data have been revised for the latest period
Source: IRI E-Market Insights™/Coresight Research[/caption] 2. Food & Beverage Sees Major Deceleration The online food & beverage category saw sales climb by 121.4% on a two-year basis but decelerate to 4.0% from 2020 as strong comparatives hampered year-over-year growth. The record grocery sales growth seen last year will likely lead to declines in food & beverage sales growth over the rest of 2021. In its full-year earnings call held on March 4, 2021, Kroger forecast that same-store sales would decline in the range of 3.0%–5.0% in fiscal 2022. General merchandise & homecare and health & beauty also saw significant growth erosions when compared to 2020. However, online sales in both categories remain highly elevated from 2019 levels. Food & beverage continues to see high online growth relative to other categories when compared on a two-year basis. Figure 3. E-Commerce CPG Sales Growth, by Category Type (YoY % Change) [caption id="attachment_127081" align="aligncenter" width="720"]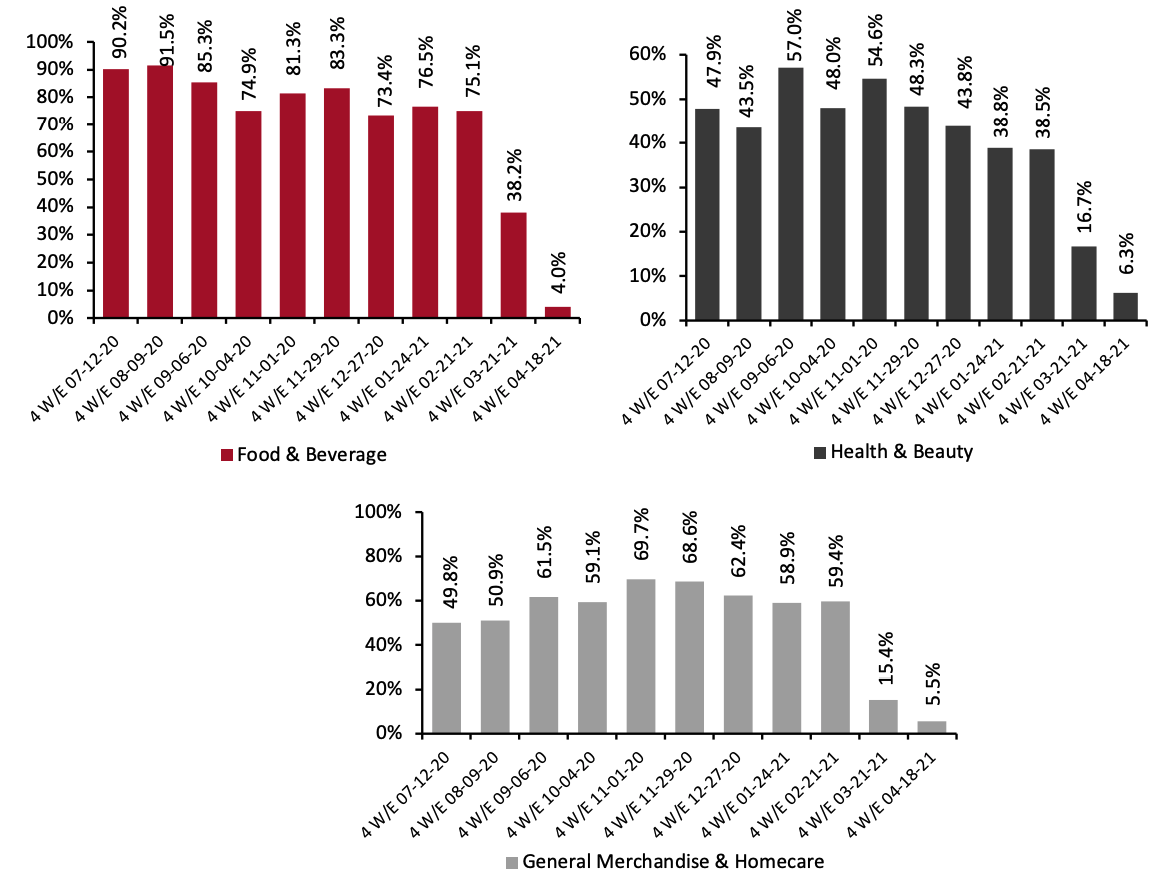 Historical data have been revised in the latest period
Source: IRI E-Market Insights™/Coresight Research[/caption] Figure 4. E-Commerce CPG Sales Growth, by Category Type (% Change from Two Years Prior) [caption id="attachment_127082" align="aligncenter" width="720"]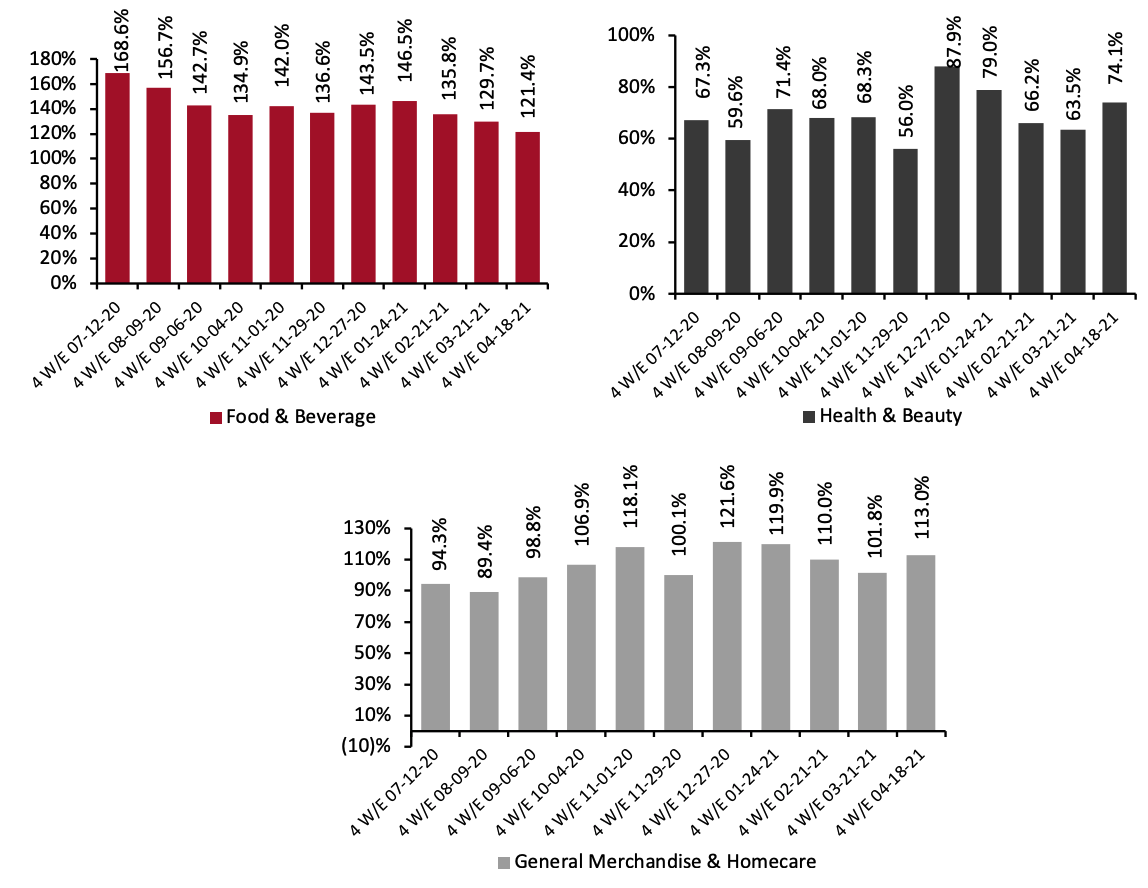 Historical data have been revised in the latest period
Source: IRI E-Market Insights™/Coresight Research[/caption] 3. Breakdown of Online CPG Sales: Food & Beverage Trends Downward The chart below shows the breakdown of online sales by type of CPG category. The food & beverage share is trending downward, dropping below 35.0% for the first time since January 2021 and reaching 34.3% for the latest period. General merchandise & homecare picked up slightly to reach 24.1%, while health & beauty’s online share gained 0.7 percentage points to reach 41.6%. Figure 5. CPG E-Commerce: Breakdown of Sales Share by Category (%) [caption id="attachment_127083" align="aligncenter" width="720"]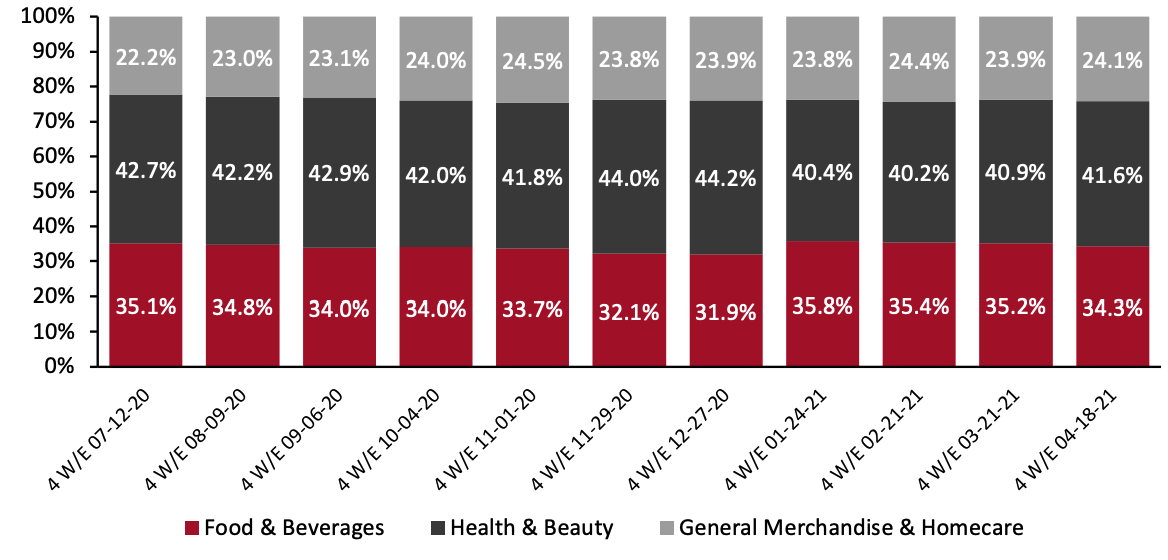 Source: IRI E-Market Insights™/Coresight Research[/caption]
4. The Beverages Department Outpaces Other Food Departments in Total and Online Sales
Among the major groupings charted below, beverages saw substantial year-over-year online gains in the four weeks ended April 18, 2021, whether compared to 2019 or 2020: Online sales were up 18.0% from 2020 and 119.1% from 2019. Growth was driven by energy drinks (up 49.1% from 2020), liquid drink enhancers (up 46.4% from 2020) and sports drinks (up 42.9% from 2020).
Total sales of frozen food, which has been a hot-seller during the crisis, slumped by 10.6% for the latest period, partly due to annualizing of lockdown restrictions in the US. It is worth noting that during the latest period the category grew 113.7% online and 24.6% in total from its comparable 2019 levels.
Figure 6. Food & Beverage Departments: E-Commerce and Total Sales Growth, Four Weeks Ended April 18, 2021 (YoY and Yo2Y % Change)
[caption id="attachment_127084" align="aligncenter" width="720"]
Source: IRI E-Market Insights™/Coresight Research[/caption]
4. The Beverages Department Outpaces Other Food Departments in Total and Online Sales
Among the major groupings charted below, beverages saw substantial year-over-year online gains in the four weeks ended April 18, 2021, whether compared to 2019 or 2020: Online sales were up 18.0% from 2020 and 119.1% from 2019. Growth was driven by energy drinks (up 49.1% from 2020), liquid drink enhancers (up 46.4% from 2020) and sports drinks (up 42.9% from 2020).
Total sales of frozen food, which has been a hot-seller during the crisis, slumped by 10.6% for the latest period, partly due to annualizing of lockdown restrictions in the US. It is worth noting that during the latest period the category grew 113.7% online and 24.6% in total from its comparable 2019 levels.
Figure 6. Food & Beverage Departments: E-Commerce and Total Sales Growth, Four Weeks Ended April 18, 2021 (YoY and Yo2Y % Change)
[caption id="attachment_127084" align="aligncenter" width="720"]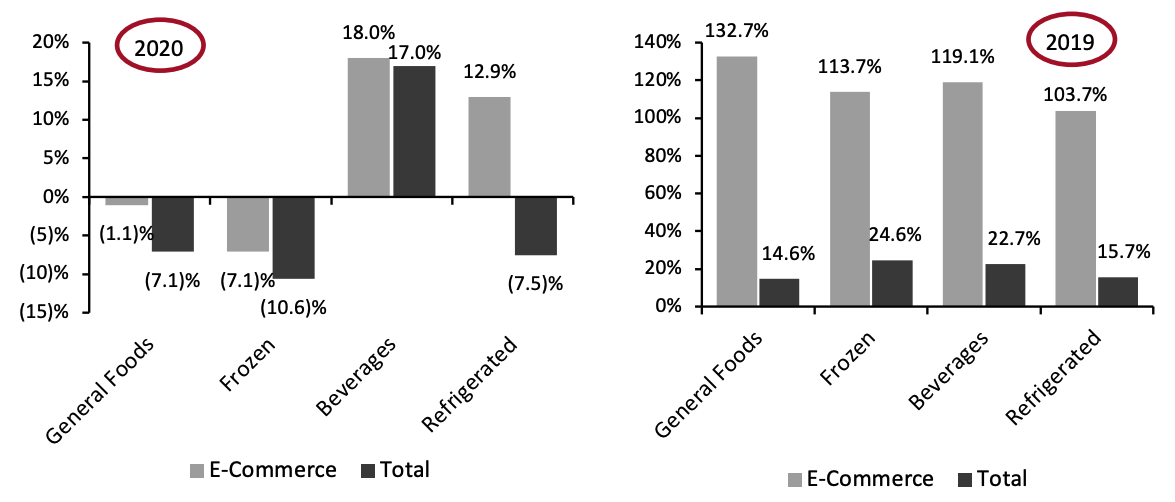 Source: IRI E-Market Insights™/Coresight Research[/caption]
5. Health Posts the Highest Online and Total Growth Among Nonfood Departments
Health products saw the highest year-over-year sales growth in the latest period—relative to other nonfood departments—growing 7.8% online and 15.5% in total. Health e-commerce sales were driven by anti-smoking products (up 72.0% from 2020), toothbrush & dental accessories (up 29.7%) and baby care products (up 28.9%).
The weak year-over-year growth of the homecare department is partly due to strong comparatives, with a growth of 138.5% recorded in the same period last year when the country saw the initial spike from Covid-19. However, homecare saw the highest two-year growth, relative to other nonfood categories—surging 129.4% online and 33.4% in total.
In its earnings call for the quarter ended March 31, 2021, household care and cleaning products manufacturer Clorox said that it expects many consumer behaviors that have changed during the pandemic to stick, including enhanced hygiene practices, which would provide a tailwind for the long-term financial growth of the company.
Figure 6. Nonfood Departments: E-Commerce and Total Sales Growth, Four Weeks Ended April 18, 2021 (YoY and Yo2Y % Change)
[caption id="attachment_127085" align="aligncenter" width="720"]
Source: IRI E-Market Insights™/Coresight Research[/caption]
5. Health Posts the Highest Online and Total Growth Among Nonfood Departments
Health products saw the highest year-over-year sales growth in the latest period—relative to other nonfood departments—growing 7.8% online and 15.5% in total. Health e-commerce sales were driven by anti-smoking products (up 72.0% from 2020), toothbrush & dental accessories (up 29.7%) and baby care products (up 28.9%).
The weak year-over-year growth of the homecare department is partly due to strong comparatives, with a growth of 138.5% recorded in the same period last year when the country saw the initial spike from Covid-19. However, homecare saw the highest two-year growth, relative to other nonfood categories—surging 129.4% online and 33.4% in total.
In its earnings call for the quarter ended March 31, 2021, household care and cleaning products manufacturer Clorox said that it expects many consumer behaviors that have changed during the pandemic to stick, including enhanced hygiene practices, which would provide a tailwind for the long-term financial growth of the company.
Figure 6. Nonfood Departments: E-Commerce and Total Sales Growth, Four Weeks Ended April 18, 2021 (YoY and Yo2Y % Change)
[caption id="attachment_127085" align="aligncenter" width="720"]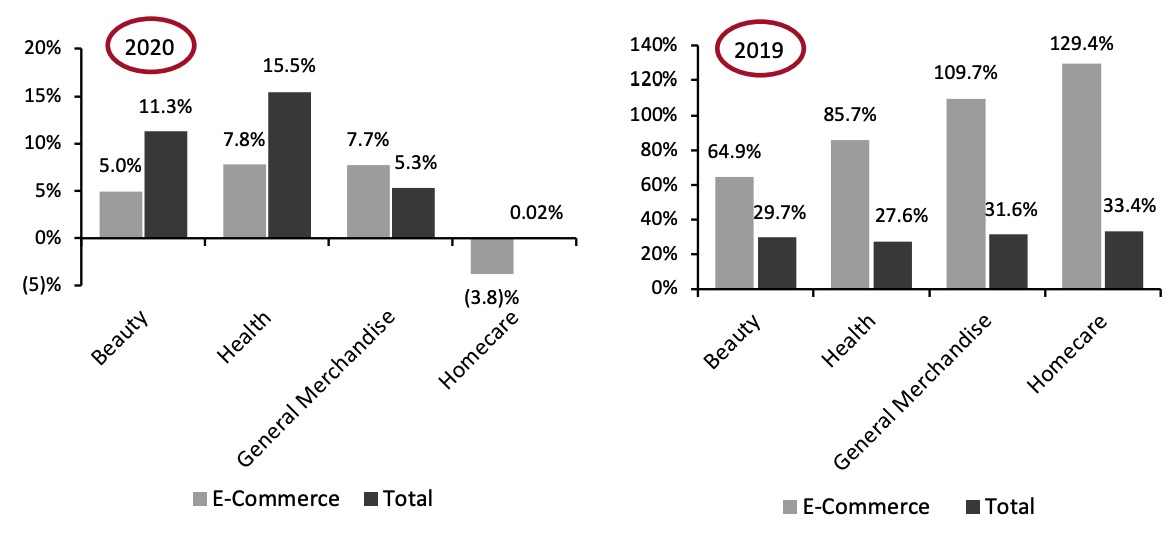 Source: IRI E-Market Insights™/Coresight Research[/caption]
Historical data have been revised for the latest periodSource: IRI E-Market Insights™/Coresight Research[/caption] However, comparing CPG e-commerce sales to the period two years prior shows strong positive growth for the four weeks ended April 18, 2021, with sales almost doubling. Figure 2. CPG E-Commerce and Total Sales Growth (% Change from Two Years Prior) [caption id="attachment_127080" align="aligncenter" width="720"]
Historical data have been revised for the latest periodSource: IRI E-Market Insights™/Coresight Research[/caption] 2. Food & Beverage Sees Major Deceleration The online food & beverage category saw sales climb by 121.4% on a two-year basis but decelerate to 4.0% from 2020 as strong comparatives hampered year-over-year growth. The record grocery sales growth seen last year will likely lead to declines in food & beverage sales growth over the rest of 2021. In its full-year earnings call held on March 4, 2021, Kroger forecast that same-store sales would decline in the range of 3.0%–5.0% in fiscal 2022. General merchandise & homecare and health & beauty also saw significant growth erosions when compared to 2020. However, online sales in both categories remain highly elevated from 2019 levels. Food & beverage continues to see high online growth relative to other categories when compared on a two-year basis. Figure 3. E-Commerce CPG Sales Growth, by Category Type (YoY % Change) [caption id="attachment_127081" align="aligncenter" width="720"]
Historical data have been revised in the latest periodSource: IRI E-Market Insights™/Coresight Research[/caption] Figure 4. E-Commerce CPG Sales Growth, by Category Type (% Change from Two Years Prior) [caption id="attachment_127082" align="aligncenter" width="720"]
Historical data have been revised in the latest periodSource: IRI E-Market Insights™/Coresight Research[/caption] 3. Breakdown of Online CPG Sales: Food & Beverage Trends Downward The chart below shows the breakdown of online sales by type of CPG category. The food & beverage share is trending downward, dropping below 35.0% for the first time since January 2021 and reaching 34.3% for the latest period. General merchandise & homecare picked up slightly to reach 24.1%, while health & beauty’s online share gained 0.7 percentage points to reach 41.6%. Figure 5. CPG E-Commerce: Breakdown of Sales Share by Category (%) [caption id="attachment_127083" align="aligncenter" width="720"]
Source: IRI E-Market Insights™/Coresight Research[/caption]
4. The Beverages Department Outpaces Other Food Departments in Total and Online Sales
Among the major groupings charted below, beverages saw substantial year-over-year online gains in the four weeks ended April 18, 2021, whether compared to 2019 or 2020: Online sales were up 18.0% from 2020 and 119.1% from 2019. Growth was driven by energy drinks (up 49.1% from 2020), liquid drink enhancers (up 46.4% from 2020) and sports drinks (up 42.9% from 2020).
Total sales of frozen food, which has been a hot-seller during the crisis, slumped by 10.6% for the latest period, partly due to annualizing of lockdown restrictions in the US. It is worth noting that during the latest period the category grew 113.7% online and 24.6% in total from its comparable 2019 levels.
Figure 6. Food & Beverage Departments: E-Commerce and Total Sales Growth, Four Weeks Ended April 18, 2021 (YoY and Yo2Y % Change)
[caption id="attachment_127084" align="aligncenter" width="720"] Source: IRI E-Market Insights™/Coresight Research[/caption]
5. Health Posts the Highest Online and Total Growth Among Nonfood Departments
Health products saw the highest year-over-year sales growth in the latest period—relative to other nonfood departments—growing 7.8% online and 15.5% in total. Health e-commerce sales were driven by anti-smoking products (up 72.0% from 2020), toothbrush & dental accessories (up 29.7%) and baby care products (up 28.9%).
The weak year-over-year growth of the homecare department is partly due to strong comparatives, with a growth of 138.5% recorded in the same period last year when the country saw the initial spike from Covid-19. However, homecare saw the highest two-year growth, relative to other nonfood categories—surging 129.4% online and 33.4% in total.
In its earnings call for the quarter ended March 31, 2021, household care and cleaning products manufacturer Clorox said that it expects many consumer behaviors that have changed during the pandemic to stick, including enhanced hygiene practices, which would provide a tailwind for the long-term financial growth of the company.
Figure 6. Nonfood Departments: E-Commerce and Total Sales Growth, Four Weeks Ended April 18, 2021 (YoY and Yo2Y % Change)
[caption id="attachment_127085" align="aligncenter" width="720"] Source: IRI E-Market Insights™/Coresight Research[/caption]
What We Think
As expected, CPG e-commerce are encountering turbulence in 2021 in the form of tough year-over-year comparisons, as retailers cycle booming sales gains caused by consumer stockpiling behaviors during the crisis. We believe online food & beverage sales will show greater growth erosion throughout the year relative to nonfood categories due to demanding comparatives and a potential rebound in restaurant spending. However, on a two-year basis, the online CPG channel has demonstrated continued strength and impressive staying power. We believe that pandemic-driven shopping behaviors will potentially outlast the crisis and e-commerce will become more entrenched in consumer buying habits. Many retailers have announced plans to dramatically expand their e-commerce infrastructure, including in omnichannel fulfillment, supply chain and automation, after reporting huge online growth for the most recent fiscal year. To thrive in a post-crisis future, CPG manufacturers will also have to capitalize on the e-commerce wave, make concerted efforts to build their digital capabilities and increase their online service offerings.IRI Disclaimer: The information contained herein is based in part on data reported by the IRI E-Market Insights™ solution and as interpreted solely by Coresight Research. The information is believed to be reliable at the time supplied by IRI but is neither all-inclusive nor guaranteed by IRI or Coresight Research, Inc. Without limiting the generality of the foregoing, specific data points may vary considerably from other information sources. Any opinion expressed herein reflect the judgement of Coresight Research, Inc. and are subject to change. IRI disclaims liability of any kind arising from the use of this information.