Nitheesh NH
The Coresight Research and IRI monthly US CPG Sales Tracker provides our data-driven insights into online sales trends in the US CPG industry—covering the product categories of food & beverage; health & beauty; and general merchandise & homecare. In this report, we present five key insights into the four weeks ended November 28, 2021.
1. Online CPG Growth Sees Double-Digit Growth
CPG e-commerce saw double-digit year-over-year growth of 16.2% for the four weeks ended November 28, 2021, an uptick from 8.8% and 8.7% growth for the four weeks ended October 31, 2021, and October 3, 2021, respectively. The rise in the growth rate can be attributed to the pandemic’s role in changing shopping habits¬—encouraging more frazzled holiday shoppers to switch from offline to online during the busy holiday season. However, the latest reported period preceded the emergence of the more transmissible omicron strain of Covid-19 in the US; we expect that to have strengthened online grocery demand further in December.
One year earlier, during the four weeks ended November 29, 2020, total e-commerce CPG sales reported year-over-year sales growth of 71.2%. With 16.2% growth reported during the current period, CPG e-commerce continues to cement its pandemic-driven gains—rather than ceding back to in-store shopping.
Figure 1. CPG E-Commerce and Total Sales Growth (YoY % Change) [caption id="attachment_139148" align="aligncenter" width="700"]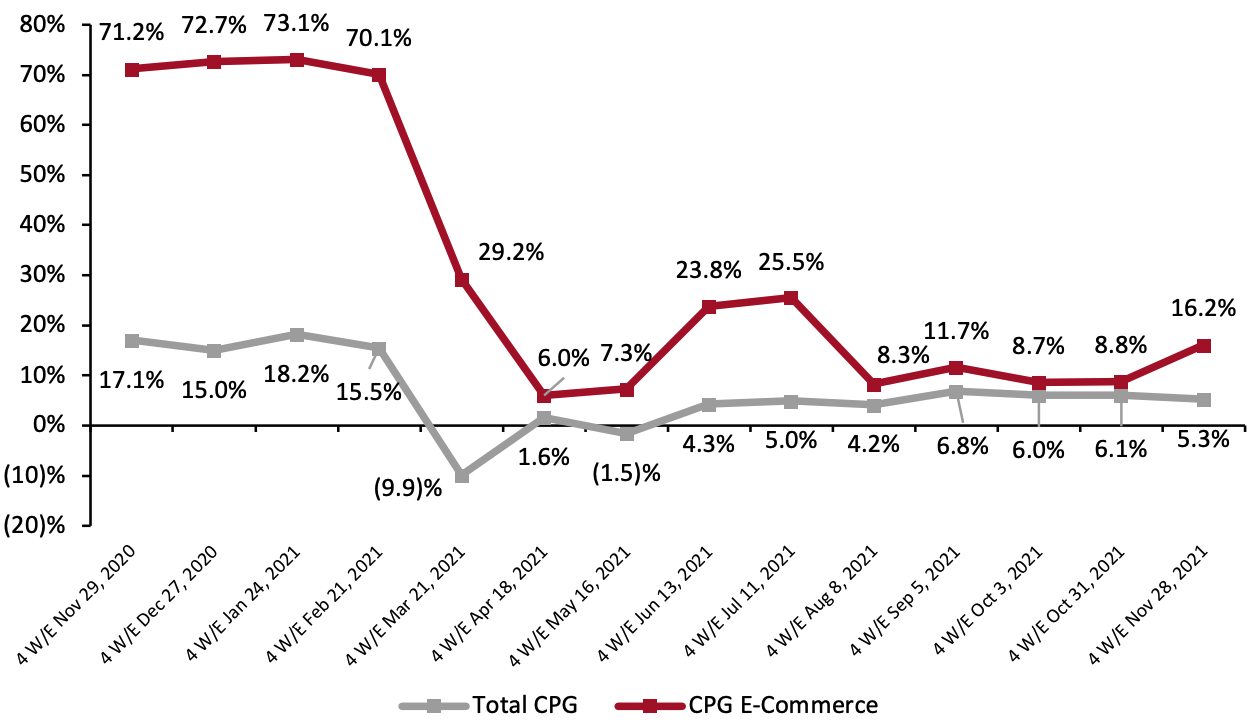 Historical data have been revised for the latest period
Source: IRI E-Market Insights™/Coresight Research[/caption] Compared to the same period in 2019, CPG e-commerce sales have roughly doubled: Sales were up 98.9% for the four weeks ended November 28, 2021.
Figure 2. CPG E-Commerce and Total Sales Growth (% Change from Two Years Prior) [caption id="attachment_139150" align="aligncenter" width="700"]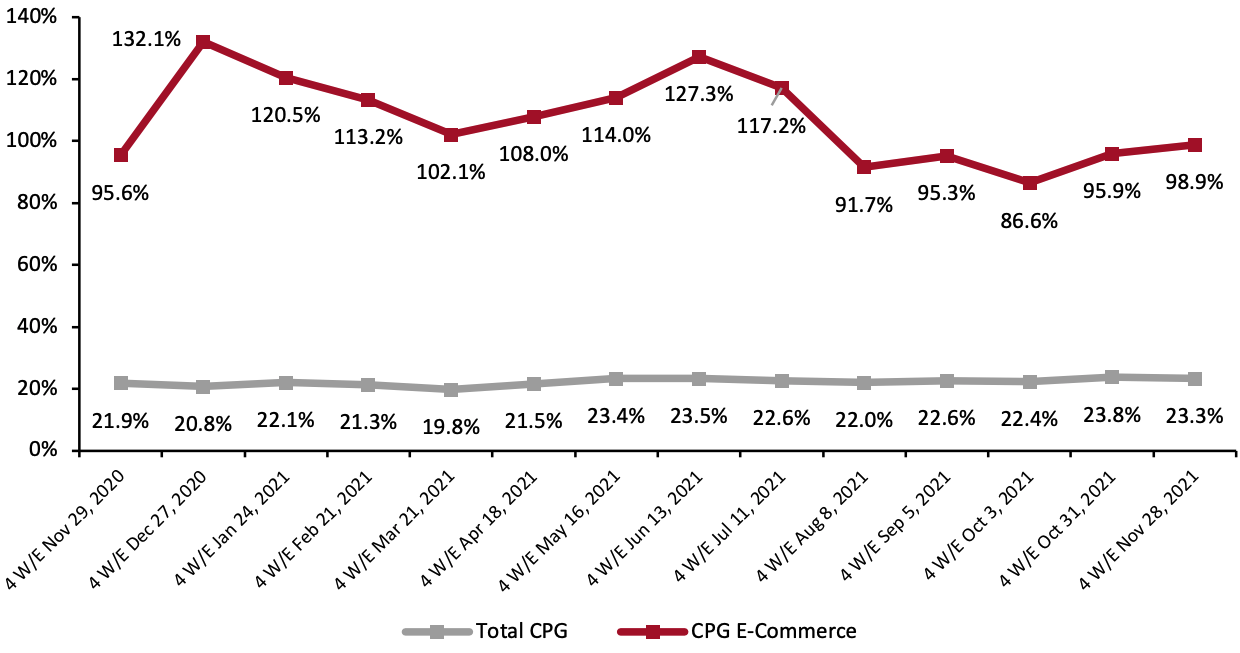 Historical data have been revised for the latest period
Source: IRI E-Market Insights™/Coresight Research[/caption] 2. All Categories Witness Improvement in Online Sales Growth All three major categories in the US CPG market witnessed slight upticks in year-over-year growth during the four weeks ended November 28, 2021. The online health & beauty, general merchandise & homecare and food & beverage segments reported incremental growth of 21.5%, 16.3%, and 10.4%, respectively. Additionally, online sales in all three categories remains significantly elevated from 2019 levels. Online food & beverage (or grocery) sales growth increased by 4.3 percentage points after reporting slower growth during the previous two periods. This took the year-over-year pace of change to a double-digit percentage for the first time since the summer. Additionally, when compared on a two-year basis, the food & beverage category continues to witness high online growth of 109.8% during the latest period, higher than the other categories.
Figure 3. E-Commerce CPG Sales Growth, by Category Type (YoY % Change) [caption id="attachment_139152" align="aligncenter" width="700"]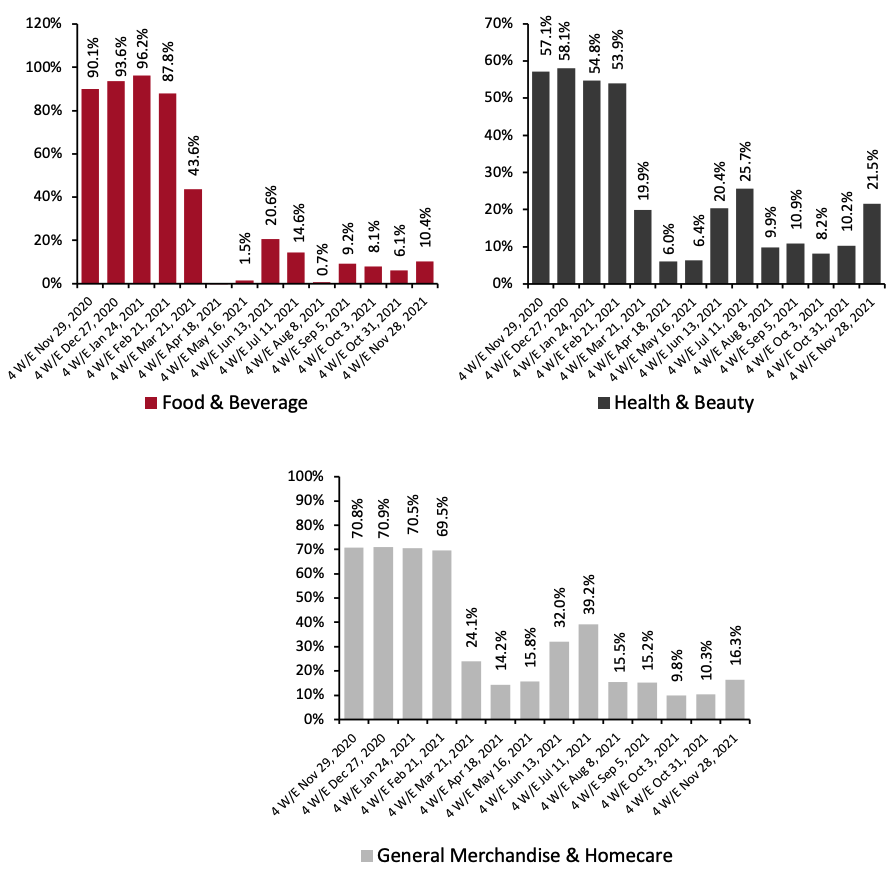 Historical data have been revised in the latest period
Source: IRI E-Market Insights™/Coresight Research[/caption]
Figure 4. E-Commerce CPG Sales Growth, by Category Type (% Change from Two Years Prior) [caption id="attachment_139154" align="aligncenter" width="700"]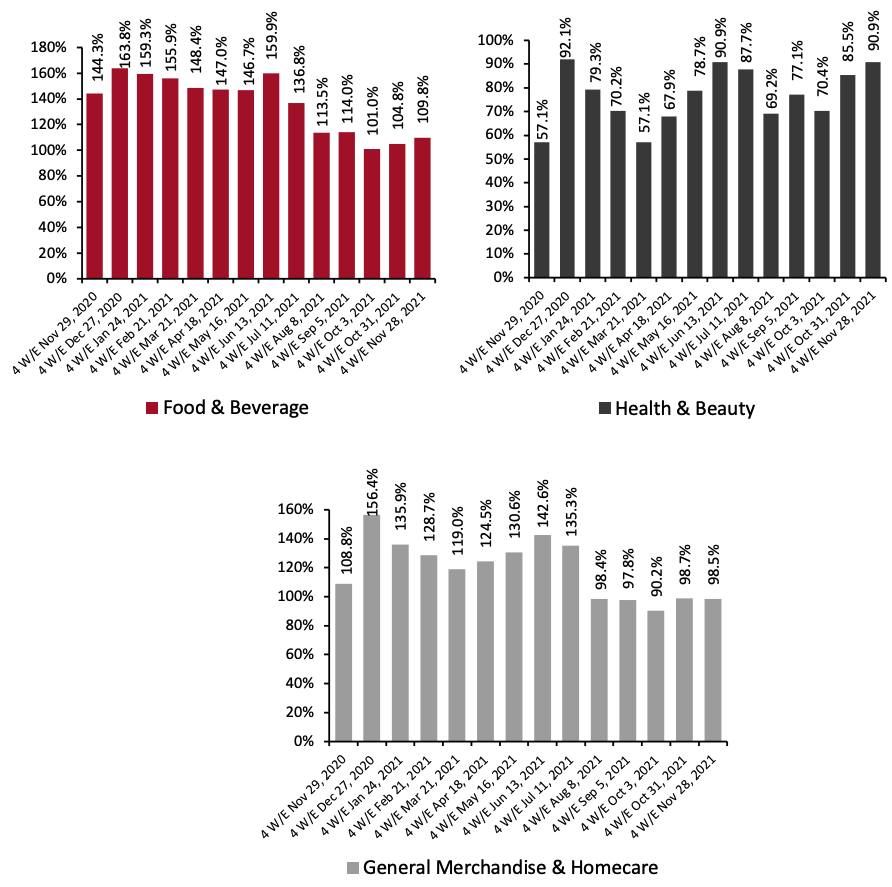 Historical data have been revised in the latest period
Source: IRI E-Market Insights™/Coresight Research[/caption] 3. Breakdown of Online CPG Sales: Food & Beverage’s Share Continues To Dip The chart below shows the breakdown of online sales by type of CPG category. Food & beverage’s share decreased to 30.6% during the four weeks ended November 28, 2021. General merchandise & homecare’s share increased slightly, by 0.7 percentage points, and accounted for 32.5% of the CPG e-commerce market share. Health & beauty increased by 2.6 percentage points to 36.7%.
Figure 5. CPG E-Commerce: Breakdown of Sales Share by Category (%) [caption id="attachment_139155" align="aligncenter" width="700"]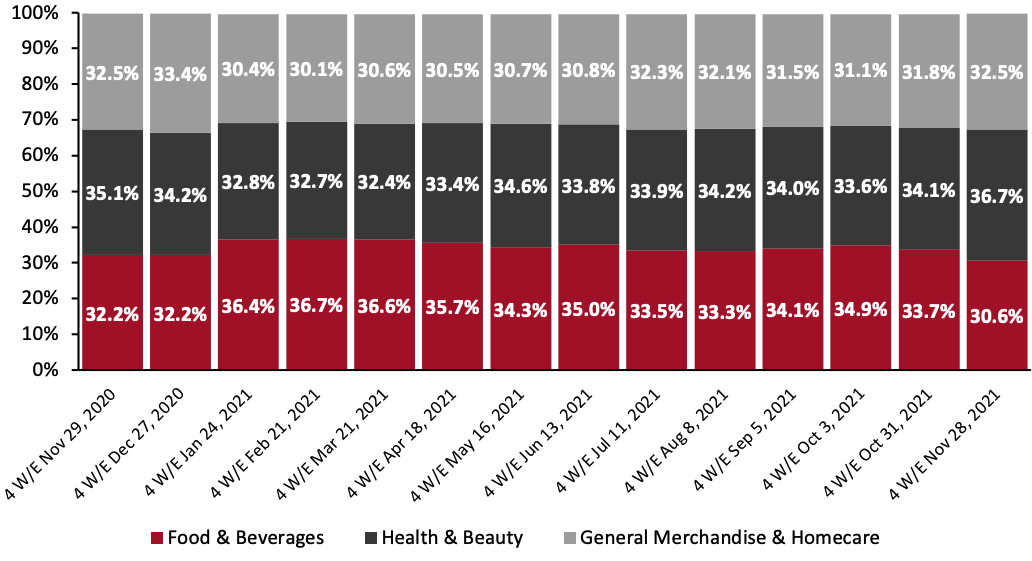 Source: IRI E-Market Insights™/Coresight Research[/caption]
4. Beverage Outperforms Other Food & Beverage Departments in Online Sales
The beverage department reported the highest year-over-year online sales growth of all food departments, totaling 14.4%. It saw 103.9% growth on a two-year basis. Year-over-year growth was driven by canned juices (up 51.2%), energy drinks (up 24.4%) and tea/coffee-ready to drink (up 22.7%) (not charted).
Liquor—which has seen a significant increase in online sales during the pandemic—outpaced other food departments in online sales when compared against 2019 levels, growing 154.4%.
Source: IRI E-Market Insights™/Coresight Research[/caption]
4. Beverage Outperforms Other Food & Beverage Departments in Online Sales
The beverage department reported the highest year-over-year online sales growth of all food departments, totaling 14.4%. It saw 103.9% growth on a two-year basis. Year-over-year growth was driven by canned juices (up 51.2%), energy drinks (up 24.4%) and tea/coffee-ready to drink (up 22.7%) (not charted).
Liquor—which has seen a significant increase in online sales during the pandemic—outpaced other food departments in online sales when compared against 2019 levels, growing 154.4%.
Figure 6. Food & Beverage Departments: E-Commerce and Total Sales Growth, Four Weeks Ended November 28, 2021 (YoY and Yo2Y % Change) [caption id="attachment_139156" align="aligncenter" width="700"]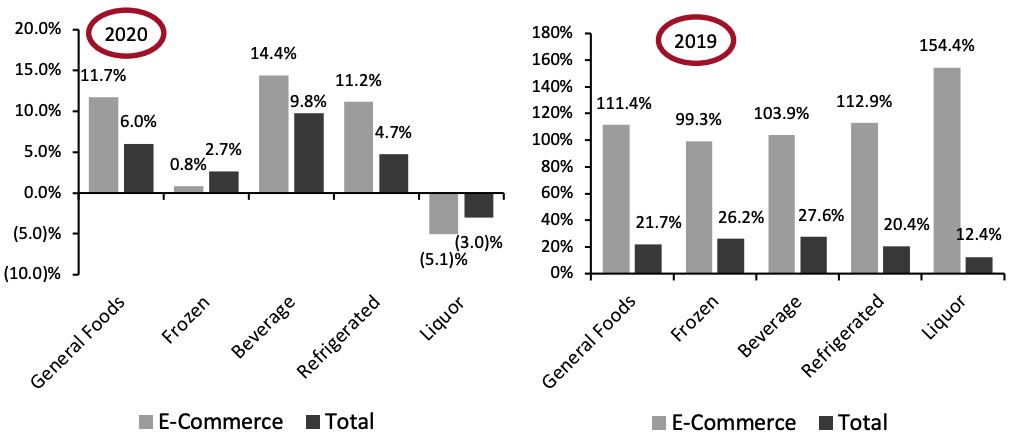 Source: IRI E-Market Insights™/Coresight Research[/caption]
5. Health Department Continues To Account For Highest Online Growth Among Nonfood Departments
The health department continues to witness the highest year-over-year online sales growth relative to other nonfood departments, recording 25.2% for the four weeks ended November 28, 2021. Growth was driven by sleeping remedies (up 73.4%), home health care/kits (up 50.4%) and first-aid accessories (up 40.7%).
As compared to 2019, online sales of homecare products grew significantly by 141.6%—higher than other nonfood categories. Online sales of homecare products grew by only 20.9% year over year.
Source: IRI E-Market Insights™/Coresight Research[/caption]
5. Health Department Continues To Account For Highest Online Growth Among Nonfood Departments
The health department continues to witness the highest year-over-year online sales growth relative to other nonfood departments, recording 25.2% for the four weeks ended November 28, 2021. Growth was driven by sleeping remedies (up 73.4%), home health care/kits (up 50.4%) and first-aid accessories (up 40.7%).
As compared to 2019, online sales of homecare products grew significantly by 141.6%—higher than other nonfood categories. Online sales of homecare products grew by only 20.9% year over year.
Figure 6. Nonfood Departments: E-Commerce and Total Sales Growth, Four Weeks Ended November 28, 2021 (YoY and Yo2Y % Change) [caption id="attachment_139158" align="aligncenter" width="700"]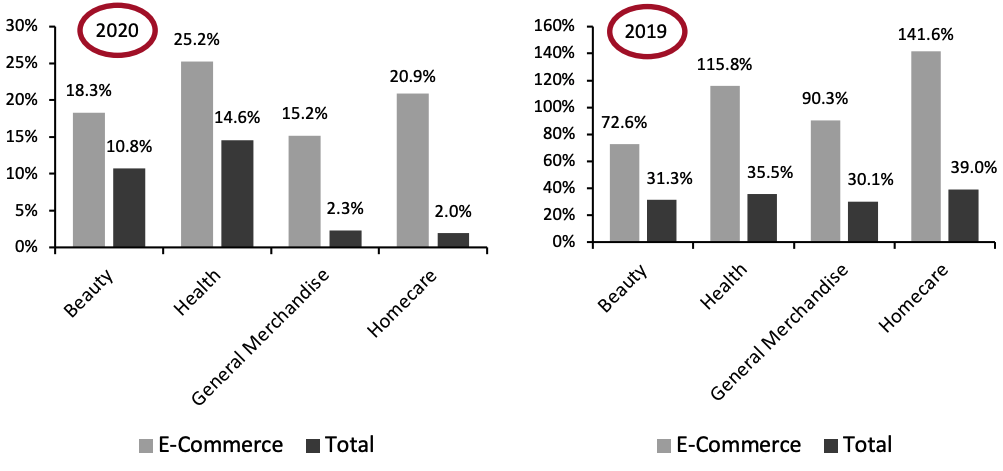 Source: IRI E-Market Insights™/Coresight Research[/caption]
Figure 1. CPG E-Commerce and Total Sales Growth (YoY % Change) [caption id="attachment_139148" align="aligncenter" width="700"]
Historical data have been revised for the latest periodSource: IRI E-Market Insights™/Coresight Research[/caption] Compared to the same period in 2019, CPG e-commerce sales have roughly doubled: Sales were up 98.9% for the four weeks ended November 28, 2021.
Figure 2. CPG E-Commerce and Total Sales Growth (% Change from Two Years Prior) [caption id="attachment_139150" align="aligncenter" width="700"]
Historical data have been revised for the latest periodSource: IRI E-Market Insights™/Coresight Research[/caption] 2. All Categories Witness Improvement in Online Sales Growth All three major categories in the US CPG market witnessed slight upticks in year-over-year growth during the four weeks ended November 28, 2021. The online health & beauty, general merchandise & homecare and food & beverage segments reported incremental growth of 21.5%, 16.3%, and 10.4%, respectively. Additionally, online sales in all three categories remains significantly elevated from 2019 levels. Online food & beverage (or grocery) sales growth increased by 4.3 percentage points after reporting slower growth during the previous two periods. This took the year-over-year pace of change to a double-digit percentage for the first time since the summer. Additionally, when compared on a two-year basis, the food & beverage category continues to witness high online growth of 109.8% during the latest period, higher than the other categories.
Figure 3. E-Commerce CPG Sales Growth, by Category Type (YoY % Change) [caption id="attachment_139152" align="aligncenter" width="700"]
Historical data have been revised in the latest periodSource: IRI E-Market Insights™/Coresight Research[/caption]
Figure 4. E-Commerce CPG Sales Growth, by Category Type (% Change from Two Years Prior) [caption id="attachment_139154" align="aligncenter" width="700"]
Historical data have been revised in the latest periodSource: IRI E-Market Insights™/Coresight Research[/caption] 3. Breakdown of Online CPG Sales: Food & Beverage’s Share Continues To Dip The chart below shows the breakdown of online sales by type of CPG category. Food & beverage’s share decreased to 30.6% during the four weeks ended November 28, 2021. General merchandise & homecare’s share increased slightly, by 0.7 percentage points, and accounted for 32.5% of the CPG e-commerce market share. Health & beauty increased by 2.6 percentage points to 36.7%.
Figure 5. CPG E-Commerce: Breakdown of Sales Share by Category (%) [caption id="attachment_139155" align="aligncenter" width="700"]
Source: IRI E-Market Insights™/Coresight Research[/caption]
4. Beverage Outperforms Other Food & Beverage Departments in Online Sales
The beverage department reported the highest year-over-year online sales growth of all food departments, totaling 14.4%. It saw 103.9% growth on a two-year basis. Year-over-year growth was driven by canned juices (up 51.2%), energy drinks (up 24.4%) and tea/coffee-ready to drink (up 22.7%) (not charted).
Liquor—which has seen a significant increase in online sales during the pandemic—outpaced other food departments in online sales when compared against 2019 levels, growing 154.4%.
Figure 6. Food & Beverage Departments: E-Commerce and Total Sales Growth, Four Weeks Ended November 28, 2021 (YoY and Yo2Y % Change) [caption id="attachment_139156" align="aligncenter" width="700"]
Source: IRI E-Market Insights™/Coresight Research[/caption]
5. Health Department Continues To Account For Highest Online Growth Among Nonfood Departments
The health department continues to witness the highest year-over-year online sales growth relative to other nonfood departments, recording 25.2% for the four weeks ended November 28, 2021. Growth was driven by sleeping remedies (up 73.4%), home health care/kits (up 50.4%) and first-aid accessories (up 40.7%).
As compared to 2019, online sales of homecare products grew significantly by 141.6%—higher than other nonfood categories. Online sales of homecare products grew by only 20.9% year over year.
Figure 6. Nonfood Departments: E-Commerce and Total Sales Growth, Four Weeks Ended November 28, 2021 (YoY and Yo2Y % Change) [caption id="attachment_139158" align="aligncenter" width="700"]
Source: IRI E-Market Insights™/Coresight Research[/caption]
What We Think
Online CPG sales continue to expand, on top of the very high rates seen one year prior. Consumer concern regarding the potential winter wave of Covid-19 infections after the outbreak of the Covid-19 Omicron variant is increasing. Coresight Research’s Consumer Tracker survey undertaken on December 27, 2021, found an overall increase in the avoidance rate due to the rise in spread of the new variant. Avoidance of shopping centers and malls witnessed an uptick of 6.4 percentage points between December 13 and December 27. The rapid spread of the new variant will further discourage shoppers from visiting brick-and-mortar stores, as more consumers avoid public places. We expect that to have bolstered online demand in December 2021, and retailers and brands should stand ready to serve elevated e-commerce demand through January 2022. Further ahead, the evidence from other countries suggests that Omicron cases tend to fall rapidly after a sudden peak—suggesting elevated online demand could taper off swiftly. However, one lesson retailers have learnt from the pandemic is that online shopping for groceries and other goods tends to be “sticky” and consumers have so far retained elevated levels of online purchasing.IRI Disclaimer: The information contained herein is based in part on data reported by the IRI E-Market Insights™ solution and as interpreted solely by Coresight Research. The information is believed to be reliable at the time supplied by IRI but is neither all-inclusive nor guaranteed by IRI or Coresight Research, Inc. Without limiting the generality of the foregoing, specific data points may vary considerably from other information sources. Any opinion expressed herein reflect the judgement of Coresight Research, Inc. and are subject to change. IRI disclaims liability of any kind arising from the use of this information.