DIpil Das
The Coresight Research and IRI monthly US CPG Sales Tracker provides our data-driven insights into online sales trends in the US CPG industry—covering the product categories of food & beverage; health & beauty; and general merchandise & homecare. In this report, we present five key insights into the four weeks ending October 31, 2021.
1. CPG E-Commerce Continues to Cement Its Gains
CPG e-commerce year-over-year growth saw a slight uptick compared to the previous period, growing 8.7% for the four weeks ended October 31, 2021, up from 8.5% during the previous period.
This solid growth was on top of a circa-80% expansion one year earlier: Far from ceding share back to stores in 2021, CPG e-commerce has been cementing its pandemic-driven gains.
Figure 1. CPG E-Commerce and Total Sales Growth (YoY % Change) [caption id="attachment_138475" align="aligncenter" width="699"]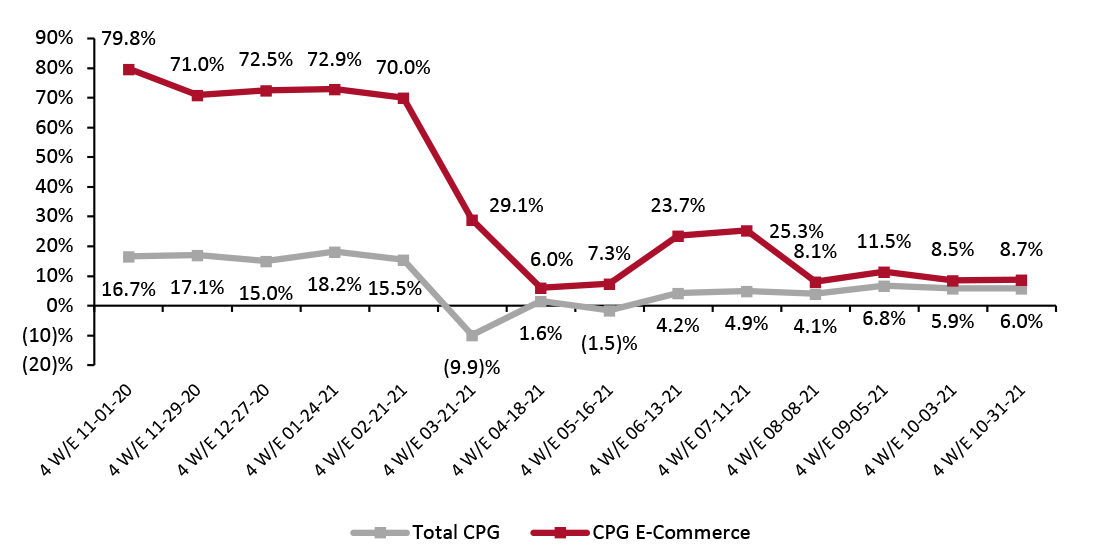 Historical data have been revised for the latest period
Source: IRI E-Market Insights™/Coresight Research [/caption] In recent months, online CPG sales have been roughly double what they were in prepandemic 2019. Compared to the same period in 2019, CPG e-commerce sales showed very strong growth of 95.4% for the four weeks ended October 31, 2021.
Figure 2. CPG E-Commerce and Total Sales Growth (% Change From Two Years Prior) [caption id="attachment_138457" align="aligncenter" width="700"]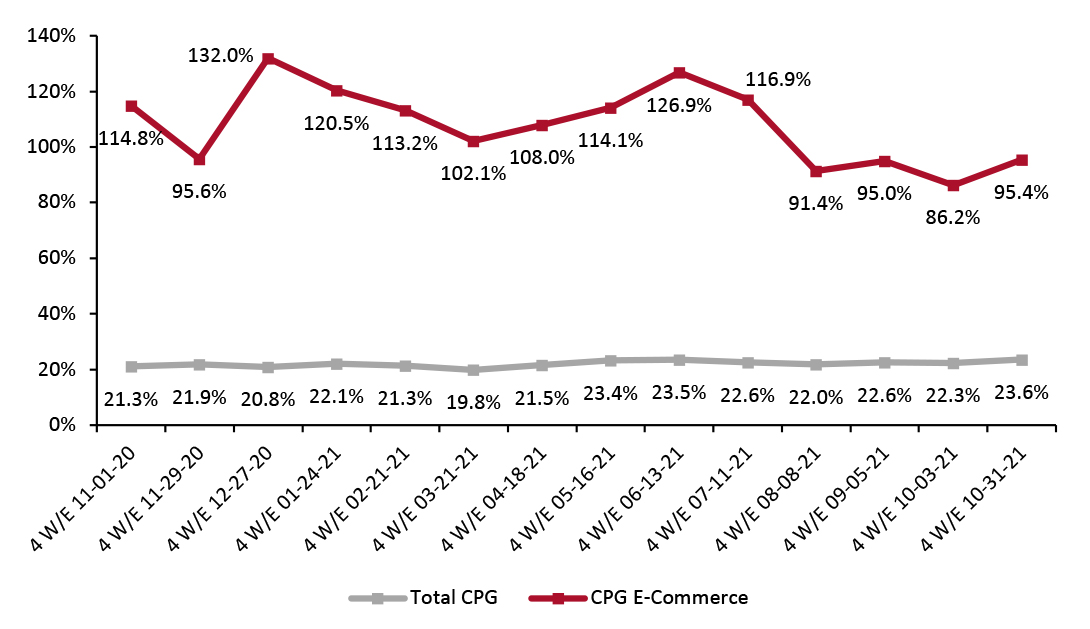 Historical data have been revised for the latest period
Source: IRI E-Market Insights™/Coresight Research [/caption] 2. Food & Beverage Online Sales Double in Two Years General merchandise & homecare and health & beauty saw slight upticks in year-over-year growth compared to the prior period, increasing 10.1% and 10.2%, respectively. However, online sales in both categories remain significantly elevated from 2019 levels. Online food & beverage sales eased for the second consecutive period, slowing to 5.9%. It is worth noting that the food & beverage category continues to see high online growth relative to other categories when compared on a two-year basis—rising by 104.1% for the latest period.
Figure 3. E-Commerce CPG Sales Growth, by Category Type (YoY % Change) [caption id="attachment_138458" align="aligncenter" width="701"]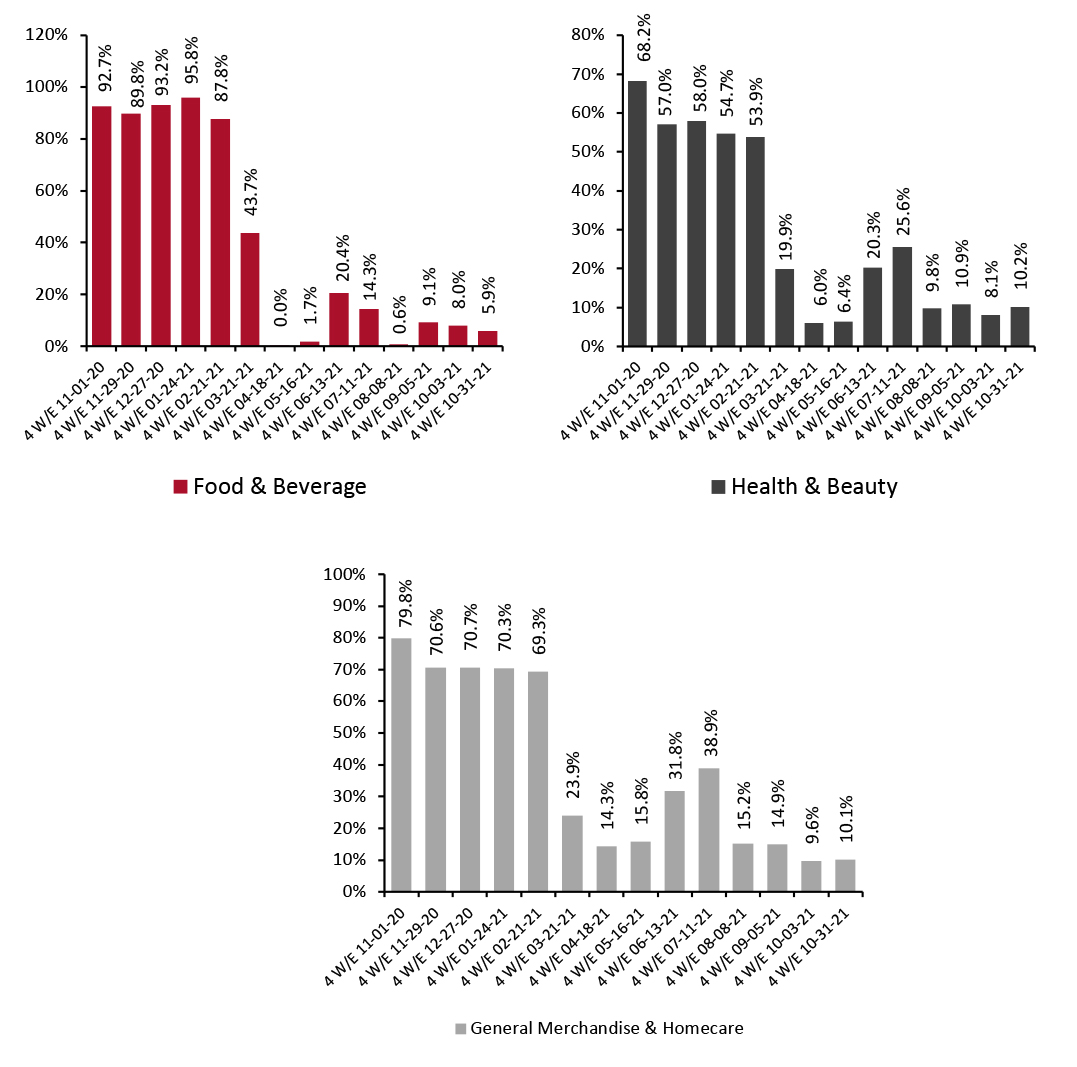 Historical data have been revised in the latest period
Source: IRI E-Market Insights™/Coresight Research [/caption]
Figure 4. E-Commerce CPG Sales Growth, by Category Type (% Change from Two Years Prior) [caption id="attachment_138459" align="aligncenter" width="700"]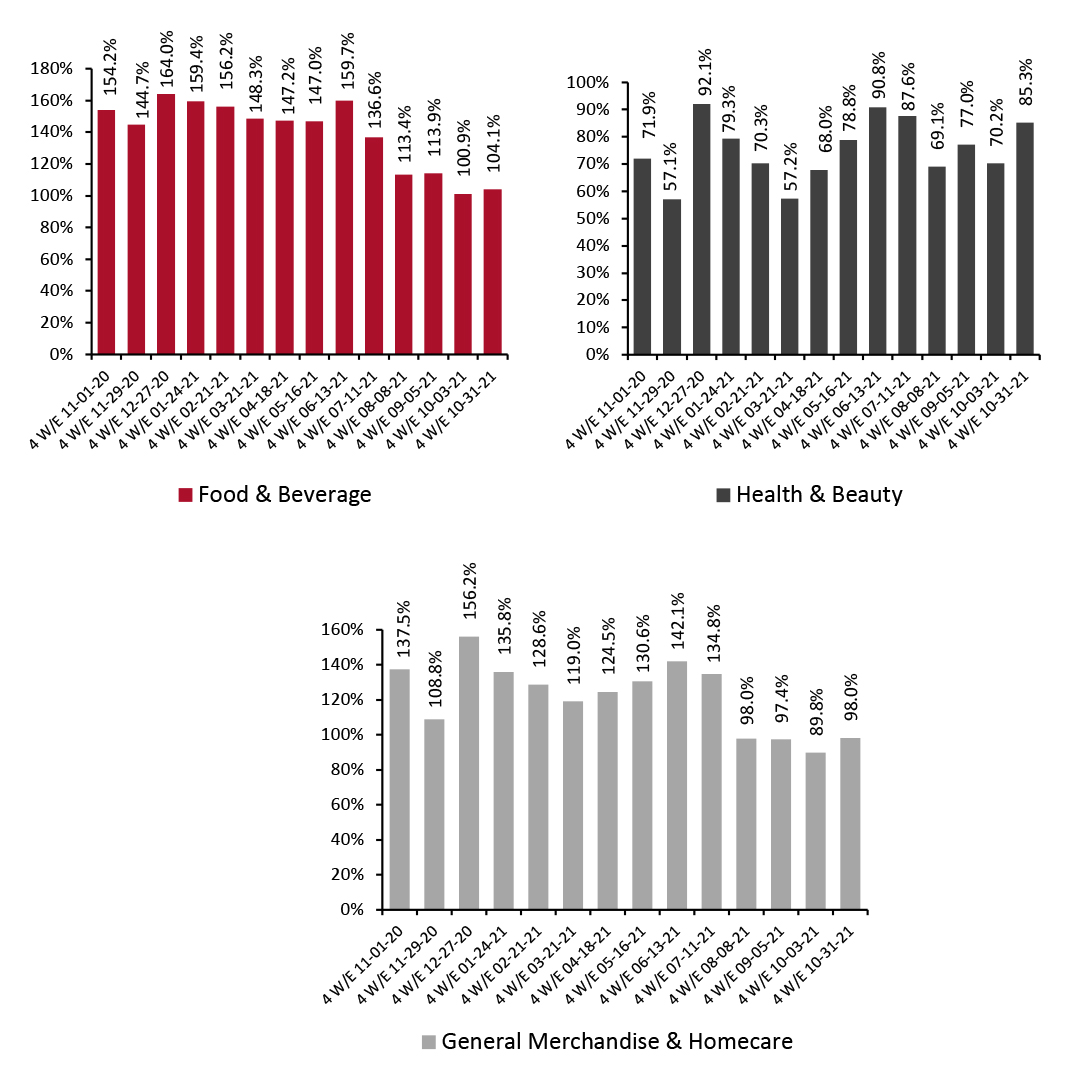 Historical data have been revised in the latest period
Source: IRI E-Market Insights™/Coresight Research [/caption] 3. Breakdown of Online CPG Sales: Food & Beverage Share Declines The chart below shows the breakdown of online sales by type of CPG category. Food & beverage’s share decreased to 34.0% during the four weeks ended October 31, 2021. General merchandise & homecare’s share increased slightly, by 0.5 percentage points, and accounted for 34.1% of the CPG e-commerce market share, while health & beauty also increased to 31.8%.
Figure 5. CPG E-Commerce: Breakdown of Sales Share by Category (%) [caption id="attachment_138460" align="aligncenter" width="700"]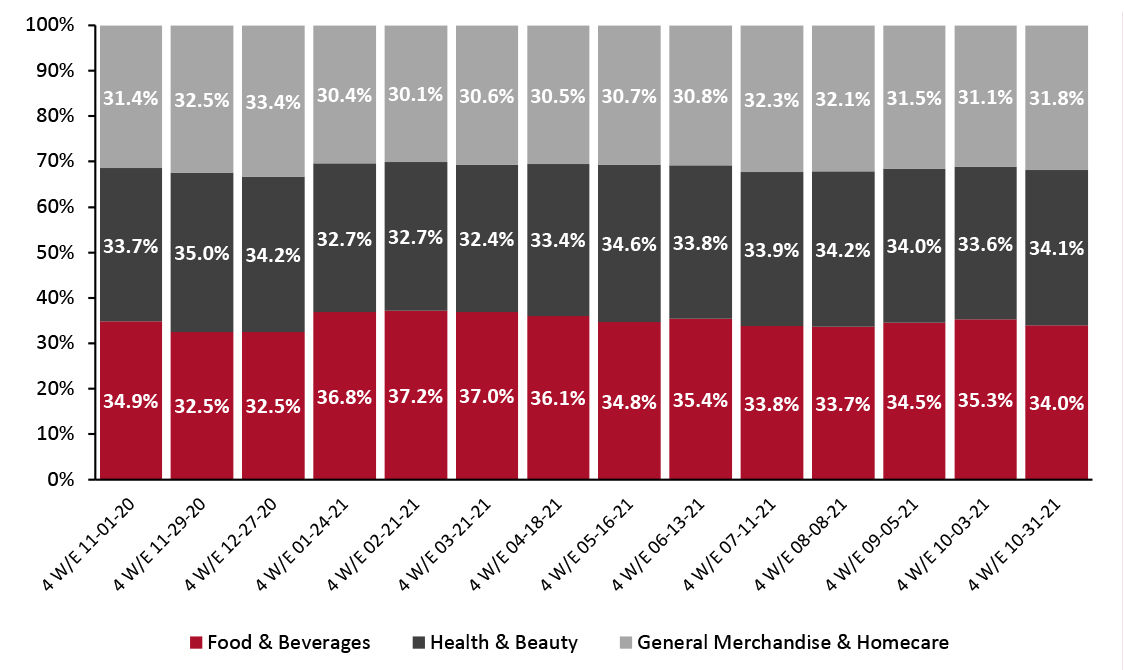 Source: IRI E-Market Insights™/Coresight Research [/caption]
4. Refrigerated Outpaces Other Food Departments in Online Sales
The refrigerated department reported the highest year-over-year online sales growth of all food departments, totaling 12.9%. It saw 111.5% growth on a two-year basis. Year-over-year growth was driven by desserts (up 22.9%), tea/coffee (up 21.6%) and juices/drinks (up 18.1%).
Source: IRI E-Market Insights™/Coresight Research [/caption]
4. Refrigerated Outpaces Other Food Departments in Online Sales
The refrigerated department reported the highest year-over-year online sales growth of all food departments, totaling 12.9%. It saw 111.5% growth on a two-year basis. Year-over-year growth was driven by desserts (up 22.9%), tea/coffee (up 21.6%) and juices/drinks (up 18.1%).
Figure 6. Food & Beverage Departments: E-Commerce and Total Sales Growth, Four Weeks Ended October 31, 2021 (YoY and Yo2Y % Change) [caption id="attachment_138461" align="aligncenter" width="699"]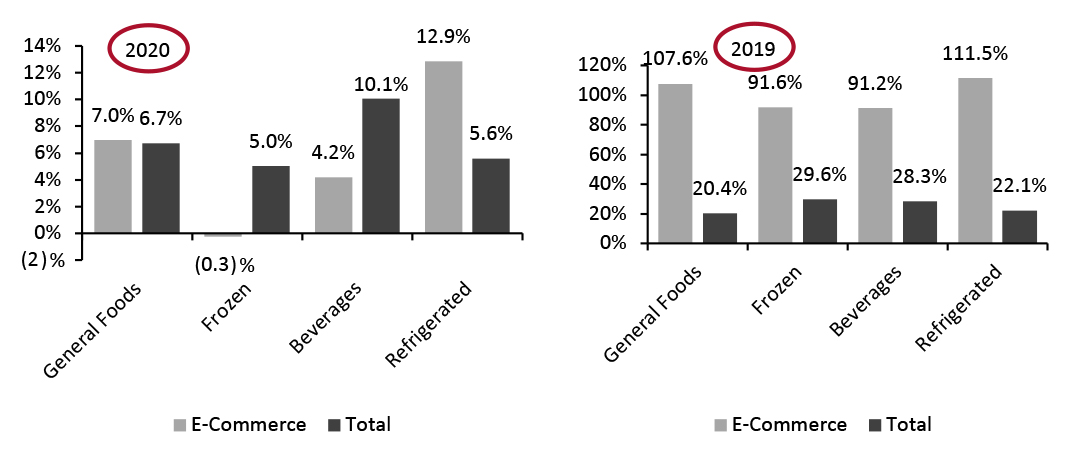 Source: IRI E-Market Insights™/Coresight Research [/caption]
5. Health Reported the Highest Online Growth Among Nonfood Departments
The health department observed the highest year-over-year online sales growth relative to other nonfood departments, recording 15.1% for the four weeks ended October 31, 2021. Growth was driven by sleeping remedies (up 42.8%), home health kits (up 41.0%) and anti-smoking products (up 31.7%).
Online sales of homecare products grew by only 4.9% year over year. However, compared to 2019, online sales grew significantly by 131.7% and total sales were up by 37.5%—both higher than other nonfood categories.
Source: IRI E-Market Insights™/Coresight Research [/caption]
5. Health Reported the Highest Online Growth Among Nonfood Departments
The health department observed the highest year-over-year online sales growth relative to other nonfood departments, recording 15.1% for the four weeks ended October 31, 2021. Growth was driven by sleeping remedies (up 42.8%), home health kits (up 41.0%) and anti-smoking products (up 31.7%).
Online sales of homecare products grew by only 4.9% year over year. However, compared to 2019, online sales grew significantly by 131.7% and total sales were up by 37.5%—both higher than other nonfood categories.
Figure 6. Nonfood Departments: E-Commerce and Total Sales Growth, Four Weeks Ended October 31, 2021 (YoY and Yo2Y % Change) [caption id="attachment_138462" align="aligncenter" width="699"]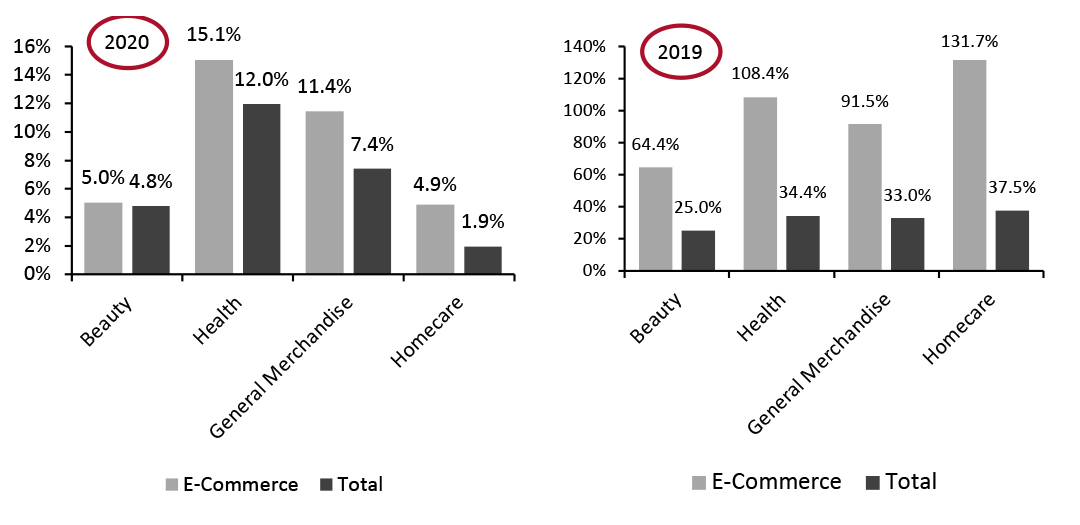 Source: IRI E-Market Insights™/Coresight Research [/caption]
IRI Disclaimer: The information contained herein is based in part on data reported by the IRI E-Market Insights™ solution and as interpreted solely by Coresight Research. The information is believed to be reliable at the time supplied by IRI but is neither all-inclusive nor guaranteed by IRI or Coresight Research, Inc. Without limiting the generality of the foregoing, specific data points may vary considerably from other information sources. Any opinion expressed herein reflect the judgement of Coresight Research, Inc. and are subject to change. IRI disclaims liability of any kind arising from the use of this information.
Figure 1. CPG E-Commerce and Total Sales Growth (YoY % Change) [caption id="attachment_138475" align="aligncenter" width="699"]
Source: IRI E-Market Insights™/Coresight Research [/caption] In recent months, online CPG sales have been roughly double what they were in prepandemic 2019. Compared to the same period in 2019, CPG e-commerce sales showed very strong growth of 95.4% for the four weeks ended October 31, 2021.
Figure 2. CPG E-Commerce and Total Sales Growth (% Change From Two Years Prior) [caption id="attachment_138457" align="aligncenter" width="700"]
Source: IRI E-Market Insights™/Coresight Research [/caption] 2. Food & Beverage Online Sales Double in Two Years General merchandise & homecare and health & beauty saw slight upticks in year-over-year growth compared to the prior period, increasing 10.1% and 10.2%, respectively. However, online sales in both categories remain significantly elevated from 2019 levels. Online food & beverage sales eased for the second consecutive period, slowing to 5.9%. It is worth noting that the food & beverage category continues to see high online growth relative to other categories when compared on a two-year basis—rising by 104.1% for the latest period.
Figure 3. E-Commerce CPG Sales Growth, by Category Type (YoY % Change) [caption id="attachment_138458" align="aligncenter" width="701"]
Source: IRI E-Market Insights™/Coresight Research [/caption]
Figure 4. E-Commerce CPG Sales Growth, by Category Type (% Change from Two Years Prior) [caption id="attachment_138459" align="aligncenter" width="700"]
Source: IRI E-Market Insights™/Coresight Research [/caption] 3. Breakdown of Online CPG Sales: Food & Beverage Share Declines The chart below shows the breakdown of online sales by type of CPG category. Food & beverage’s share decreased to 34.0% during the four weeks ended October 31, 2021. General merchandise & homecare’s share increased slightly, by 0.5 percentage points, and accounted for 34.1% of the CPG e-commerce market share, while health & beauty also increased to 31.8%.
Figure 5. CPG E-Commerce: Breakdown of Sales Share by Category (%) [caption id="attachment_138460" align="aligncenter" width="700"]
Figure 6. Food & Beverage Departments: E-Commerce and Total Sales Growth, Four Weeks Ended October 31, 2021 (YoY and Yo2Y % Change) [caption id="attachment_138461" align="aligncenter" width="699"]
Figure 6. Nonfood Departments: E-Commerce and Total Sales Growth, Four Weeks Ended October 31, 2021 (YoY and Yo2Y % Change) [caption id="attachment_138462" align="aligncenter" width="699"]
What We Think
CPG e-commerce sales continue to expand, on top of the very high rates seen one year earlier. Channel sales could be bolstered further by consumer concerns over a potential winter wave of Covid-19 infections have risen following the emergence of the Omicron variant. Coresight Research’s Consumer Tracker survey undertaken on November 29, 2021, found a significant increase in expected avoidance of stores, in general, of 5.8 percentage points between November 8 and November 29. This will likely pose a headwind to brick-and-mortar retail while strengthening the online channel. As uncertainty remains over the prospects for seasonal Covid-19 infections this winter, and the remainder of the holiday season, we expect more consumers to avoid public places and stores for shopping—particularly if we see a strong winter peak of cases. We anticipate that any such behavior will contribute to a renewed surge in CPG e-commerce, and retailers and brands must stand ready for a possible further acceleration in online growth.IRI Disclaimer: The information contained herein is based in part on data reported by the IRI E-Market Insights™ solution and as interpreted solely by Coresight Research. The information is believed to be reliable at the time supplied by IRI but is neither all-inclusive nor guaranteed by IRI or Coresight Research, Inc. Without limiting the generality of the foregoing, specific data points may vary considerably from other information sources. Any opinion expressed herein reflect the judgement of Coresight Research, Inc. and are subject to change. IRI disclaims liability of any kind arising from the use of this information.