Nitheesh NH
US CPG Sales Tracker: Coresight Research x IRI Analysis
The Coresight Research and IRI monthly US CPG Sales Tracker presents data-driven insights into online sales trends in the US CPG industry—covering the product categories of food & beverage; health & beauty; and general merchandise & homecare. In this report, we present five key insights from the four weeks ended February 20, 2022. 1. Online CPG Continues to Report Steady Mid-Teens Growth CPG e-commerce saw 14.9% year-over-year growth for the four weeks ended February 20, 2022, continuing its steady mid-teens growth rate for the fourth consecutive period—although it decelerated slightly from 15.5% in the prior period. Total growth remained in the single digits at 7.5% year over year. We expect year-over-year growth rates for e-commerce to rise in the coming months as the one-year comparatives are easier, assuming that consumer demand remains stable—Figure 1 illustrates that online growth rates dropped considerably in March and April 2021. The two-year stack for e-commerce stands at 85.0% in February 2022, which points toward strong growth overall.Figure 1. CPG E-Commerce and Total Sales Growth (YoY % Change) [caption id="attachment_143684" align="aligncenter" width="700"]
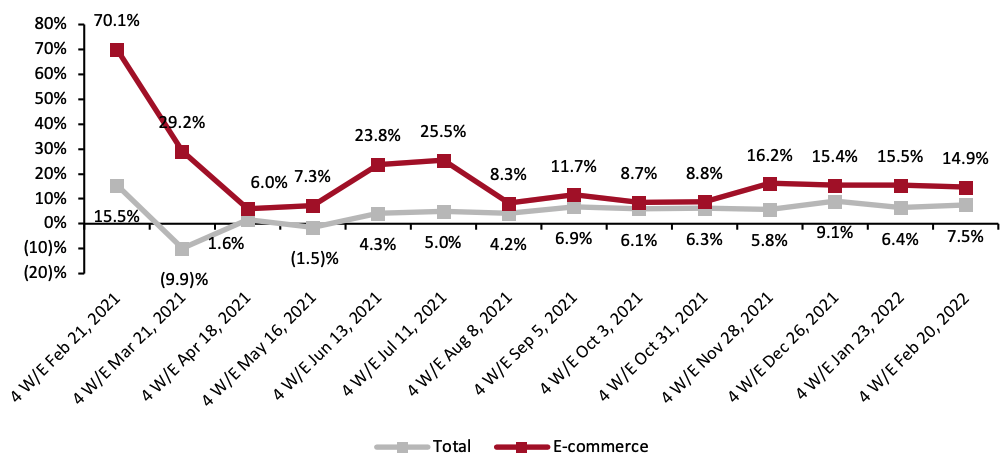 Historical data have been revised for the latest period
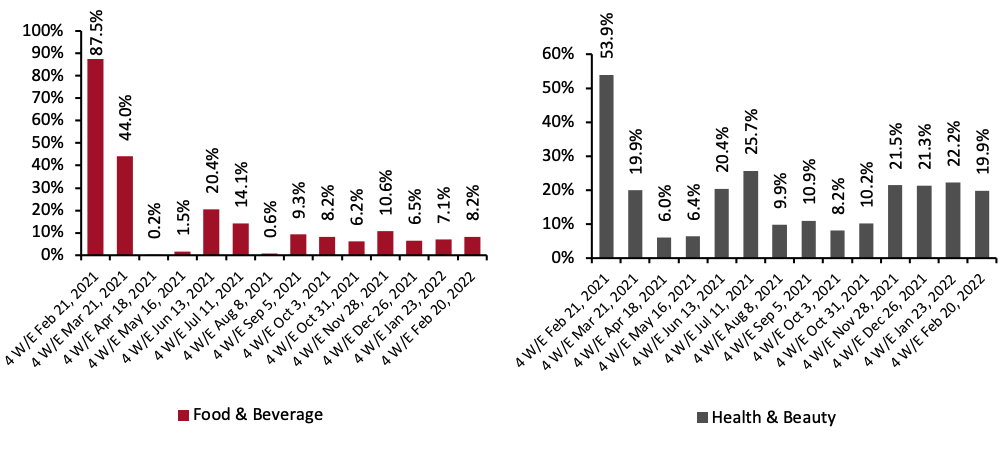
Source: IRI E-Market Insights™/Coresight Research[/caption] 2. All Three Categories Maintain Solid Online Growth We break down the online CPG market into three major categories: food & beverage, health & beauty and general merchandise & homecare. Growth in all three remained strong, as they cycle high-double-digit comparatives in the same period in 2021—although food & beverage was the only category that accelerated sequentially this period, rising 1.1 percentage points from the previous period to 8.2% year-over-year growth. Health & beauty decelerated by 2.3 percentage points compared to the prior period, to 19.9%, while general merchandise & homecare decelerated by 1.0 percentage point to 17.6%.
Figure 2. E-Commerce CPG Sales Growth, by Category Type (YoY % Change)
 [caption id="attachment_143686" align="aligncenter" width="700"]
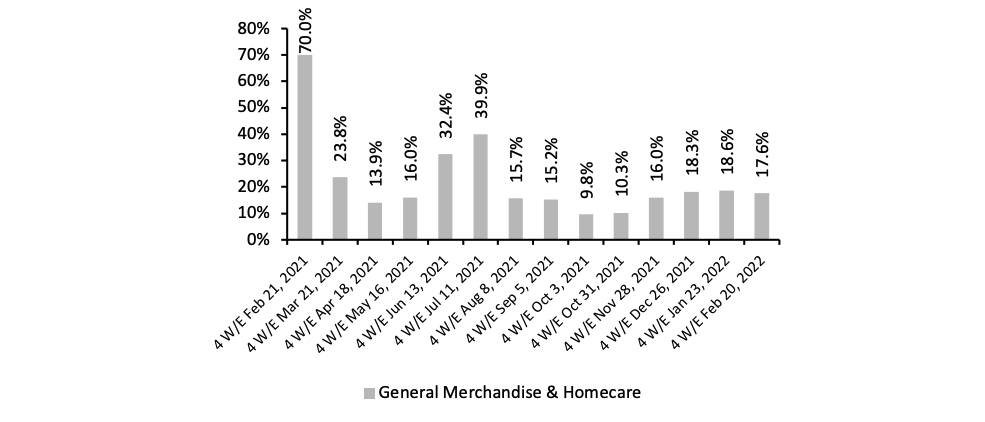 Historical data have been revised in the latest period
Source: IRI E-Market Insights™/Coresight Research[/caption] 3. Breakdown of Online CPG Sales: Food & Beverage’s Share Increases for the Second Consecutive Month Figure 3 below shows the breakdown of online sales by CPG category. Food & beverage’s share of total e-commerce sales increased to 35.1% in the four weeks ended February 20, 2022. This 0.8 percentage point growth comes on top of the previous period’s 4.0 percentage growth in market share. General merchandise & homecare’s share decreased by 0.4 percentage points to 30.7%. Health & beauty’s share decreased by 0.4 percentage points to 34.2%.
Figure 3. CPG E-Commerce: Breakdown of Sales Share by Category (%) [caption id="attachment_143687" align="aligncenter" width="700"]
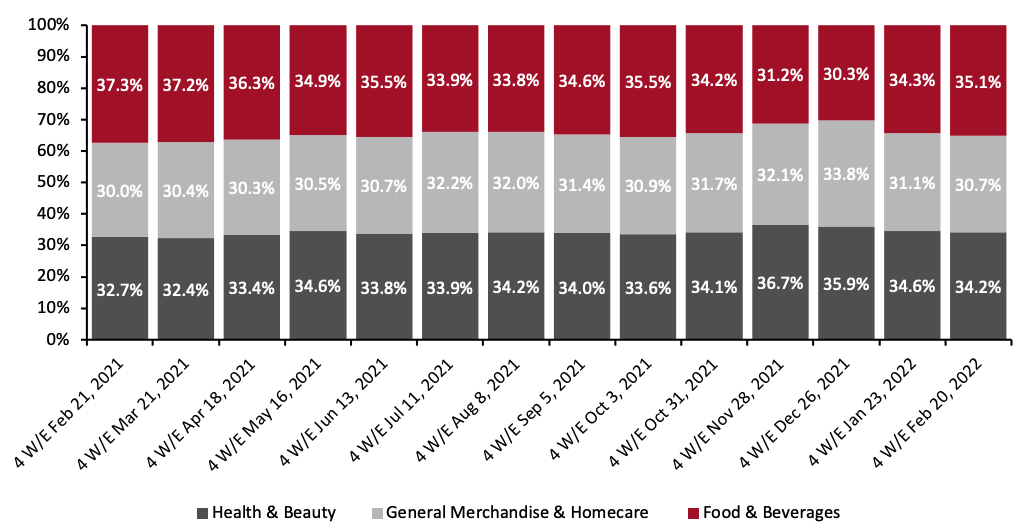 Source: IRI E-Market Insights™/Coresight Research[/caption]
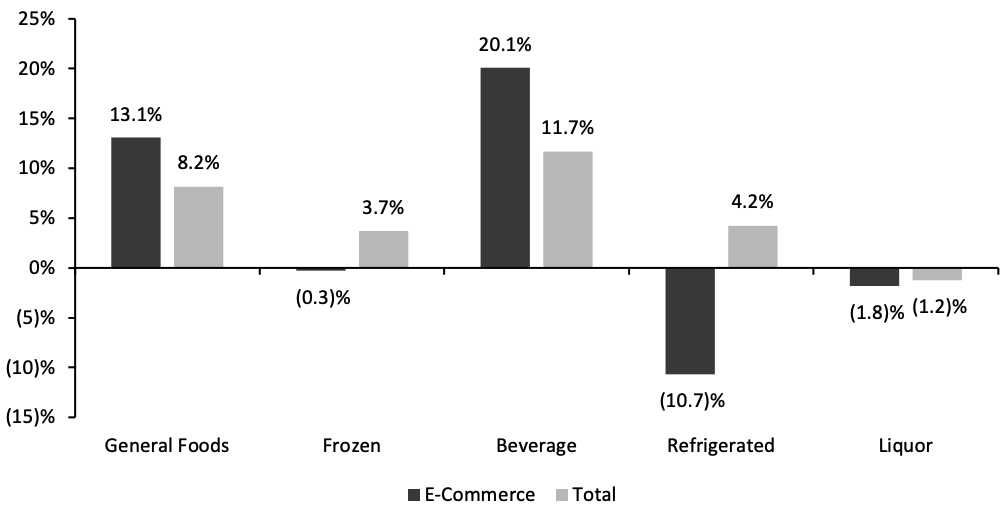
4. Beverage Outpaces Other Food Departments in Online and Total Sales
The beverage department reported the highest year-over-year online and total sales growth rates, of 20.1% and 11.7%, respectively. Online growth was driven by sales increases in coffee and tea (up 68.2%), instant tea mixes (up 41.7%) and nonfruit drinks (up 35.5%).
Source: IRI E-Market Insights™/Coresight Research[/caption]
4. Beverage Outpaces Other Food Departments in Online and Total Sales
The beverage department reported the highest year-over-year online and total sales growth rates, of 20.1% and 11.7%, respectively. Online growth was driven by sales increases in coffee and tea (up 68.2%), instant tea mixes (up 41.7%) and nonfruit drinks (up 35.5%).
Figure 4. Food & Beverage Departments: E-Commerce and Total Sales Growth, Four Weeks Ended Feb 20, 2022 (YoY % Change) [caption id="attachment_143688" align="aligncenter" width="700"]
 Source: IRI E-Market Insights™/Coresight Research[/caption]
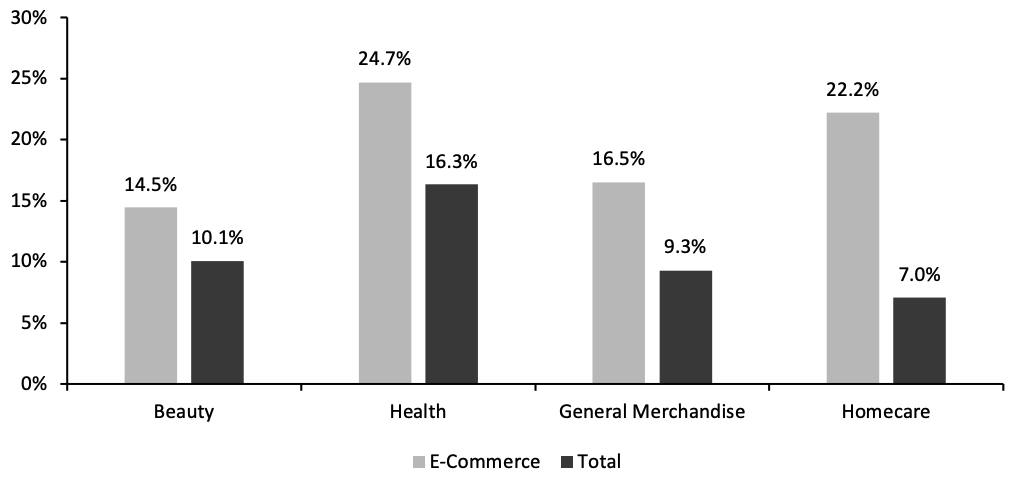
5. Health Leads Online Growth Among Nonfood Departments
The health department saw the highest year-over-year online and total sales growth among nonfood departments in the four weeks ended February 20, 2022—reaching 24.7% and 16.3%, respectively. Growth in health e-commerce was driven by home healthcare/kits (up 46.0%), upper respiratory (up 41.0%) and first aid accessories (37.5%).
Source: IRI E-Market Insights™/Coresight Research[/caption]
5. Health Leads Online Growth Among Nonfood Departments
The health department saw the highest year-over-year online and total sales growth among nonfood departments in the four weeks ended February 20, 2022—reaching 24.7% and 16.3%, respectively. Growth in health e-commerce was driven by home healthcare/kits (up 46.0%), upper respiratory (up 41.0%) and first aid accessories (37.5%).
Figure 5. Nonfood Departments: E-Commerce and Total Sales Growth, Four Weeks Ended Feb 20, 2022 (YoY % Change) [caption id="attachment_143689" align="aligncenter" width="700"]
 Source: IRI E-Market Insights™/Coresight Research[/caption]
What We Think
CPG e-commerce continues to report stable mid-teens growth, and we expect that it will accelerate in the coming months due to weaker comparatives, beginning in March and April. Online food & beverage has grown its market share of edible CPG e-commerce—the only category that accelerated in the period ending February 20, 2022. We attribute health & beauty and general merchandise & homecare’s slight e-commerce deceleration to consumers slowly returning to in-store shopping—store avoidance rates continued their downward slide in February. Online grocery shopping, on the other hand, appears to be stickier as it is facilitated by newer services such as quick commerce (rapid delivery) and retail-alternative options such as meal kits.IRI Disclaimer: The information contained herein is based in part on data reported by the IRI E-Market Insights™ solution and as interpreted solely by Coresight Research. The information is believed to be reliable at the time supplied by IRI but is neither all-inclusive nor guaranteed by IRI or Coresight Research, Inc. Without limiting the generality of the foregoing, specific data points may vary considerably from other information sources. Any opinions expressed herein reflect the judgement of Coresight Research, Inc. and are subject to change. IRI disclaims liability of any kind arising from the use of this information.