DIpil Das
The Coresight Research and IRI monthly US CPG Sales Tracker provides our data-driven insights into online sales trends in the US CPG industry—covering the product categories of food & beverage; health & beauty; and general merchandise & homecare. In this report, we present five key insights into the four weeks ended July 12, 2020.
1. Online CPG Growth Continues To Moderate
The online CPG channel saw a boom with the onset of the pandemic, boosted by pantry stocking and subsequent lockdown announcements by state and local governments. Consumers continued shopping more online even after US states eased lockdown restrictions in late April. Online shopping actually peaked in May, with 92.6% growth for the four weeks ended May 17, 2020.
E-commerce sales growth is beginning to ease, with the channel expanding 60.5% for the four weeks ended July 12 compared to 78.7% for the four weeks ended June 14. However, we expect that growth will remain at elevated levels in the second half of the year due to the persistent threat of Covid-19.
[caption id="attachment_115703" align="aligncenter" width="700"]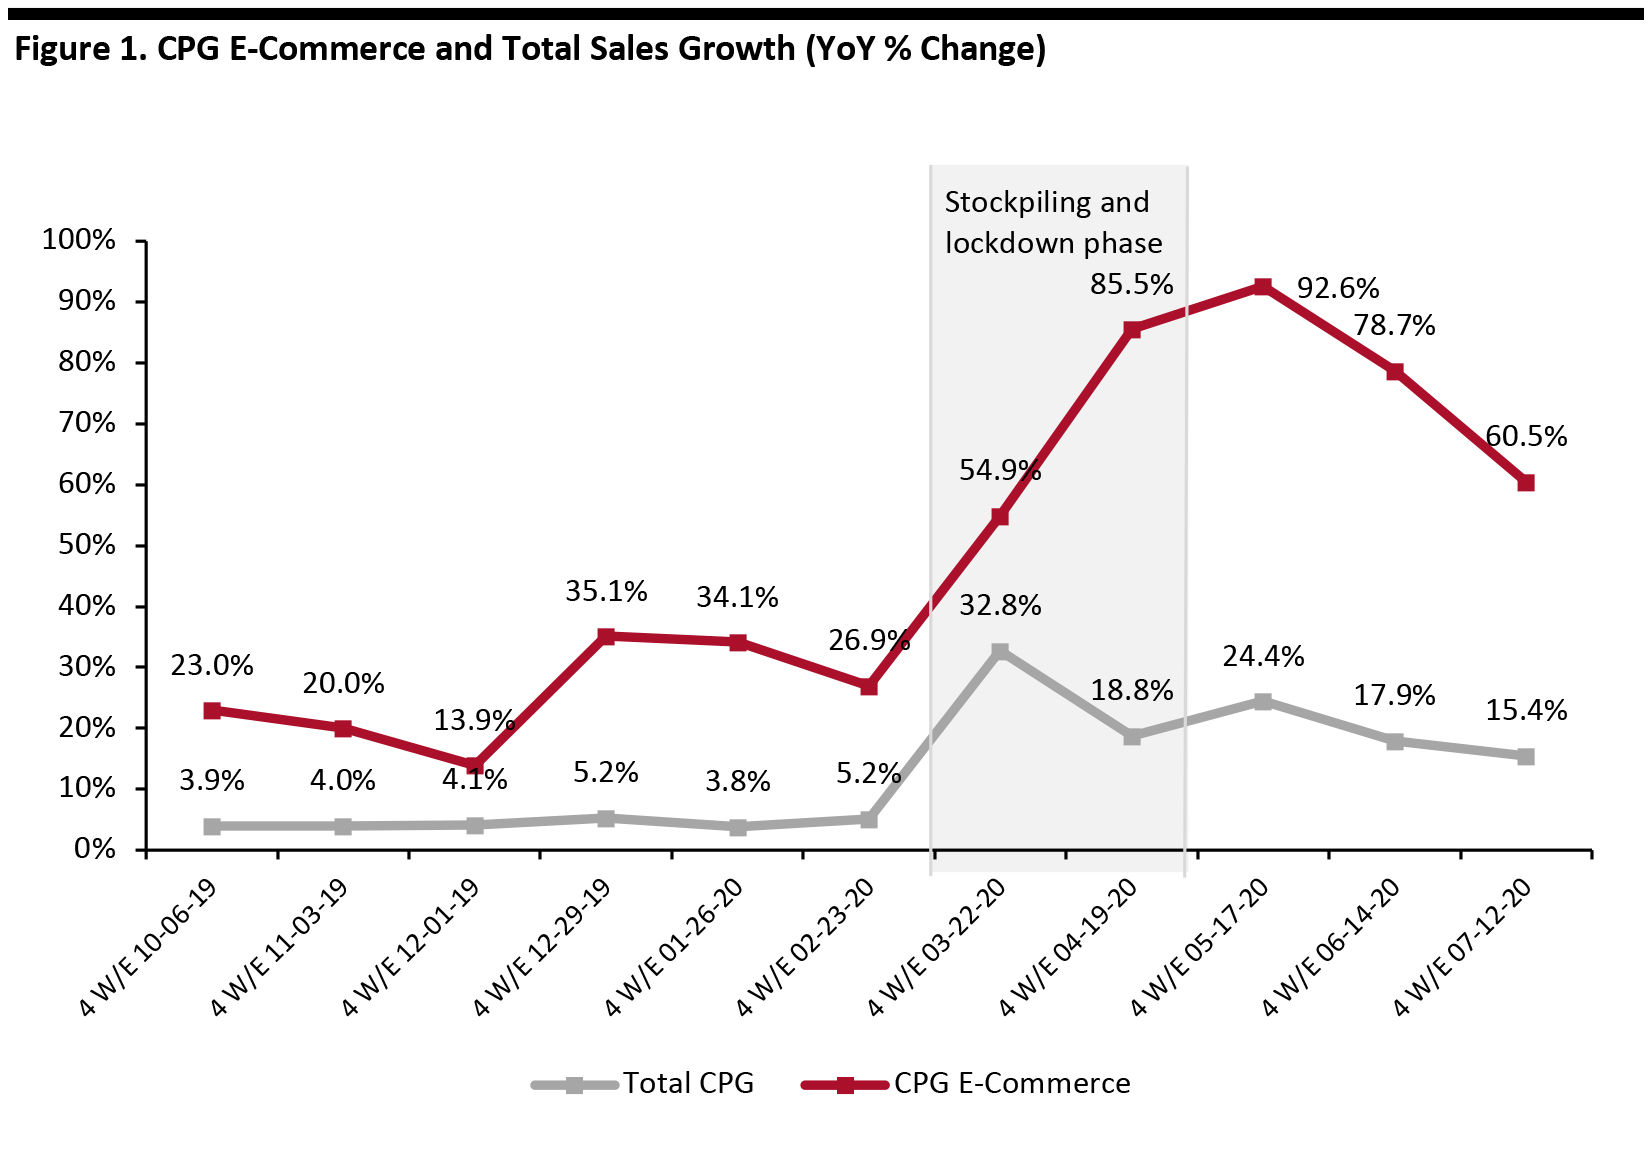 Historical data were revised in July 2020
Source: IRI E-Market Insights™/Coresight Research [/caption] 2. The General Merchandise & Homecare Category Sees E-Commerce Sales Growth Soften Consumers have drastically ramped up their online purchases of food products. Many major food retailers reported exceptional growth in online grocery sales. Albertsons, for example, saw online sales surge by 276% in its first quarter, ended June 20, 2020. Food & beverage continues to see higher growth than other CPG categories, soaring 90% for the latest four weeks. E-commerce sales growth of general merchandise & homecare saw significant erosion, slowing from 75.7% for the four weeks ended June 14 to 47.3% for the four weeks ended July 12 (down by 28.4 percentage points) [caption id="attachment_115704" align="aligncenter" width="700"]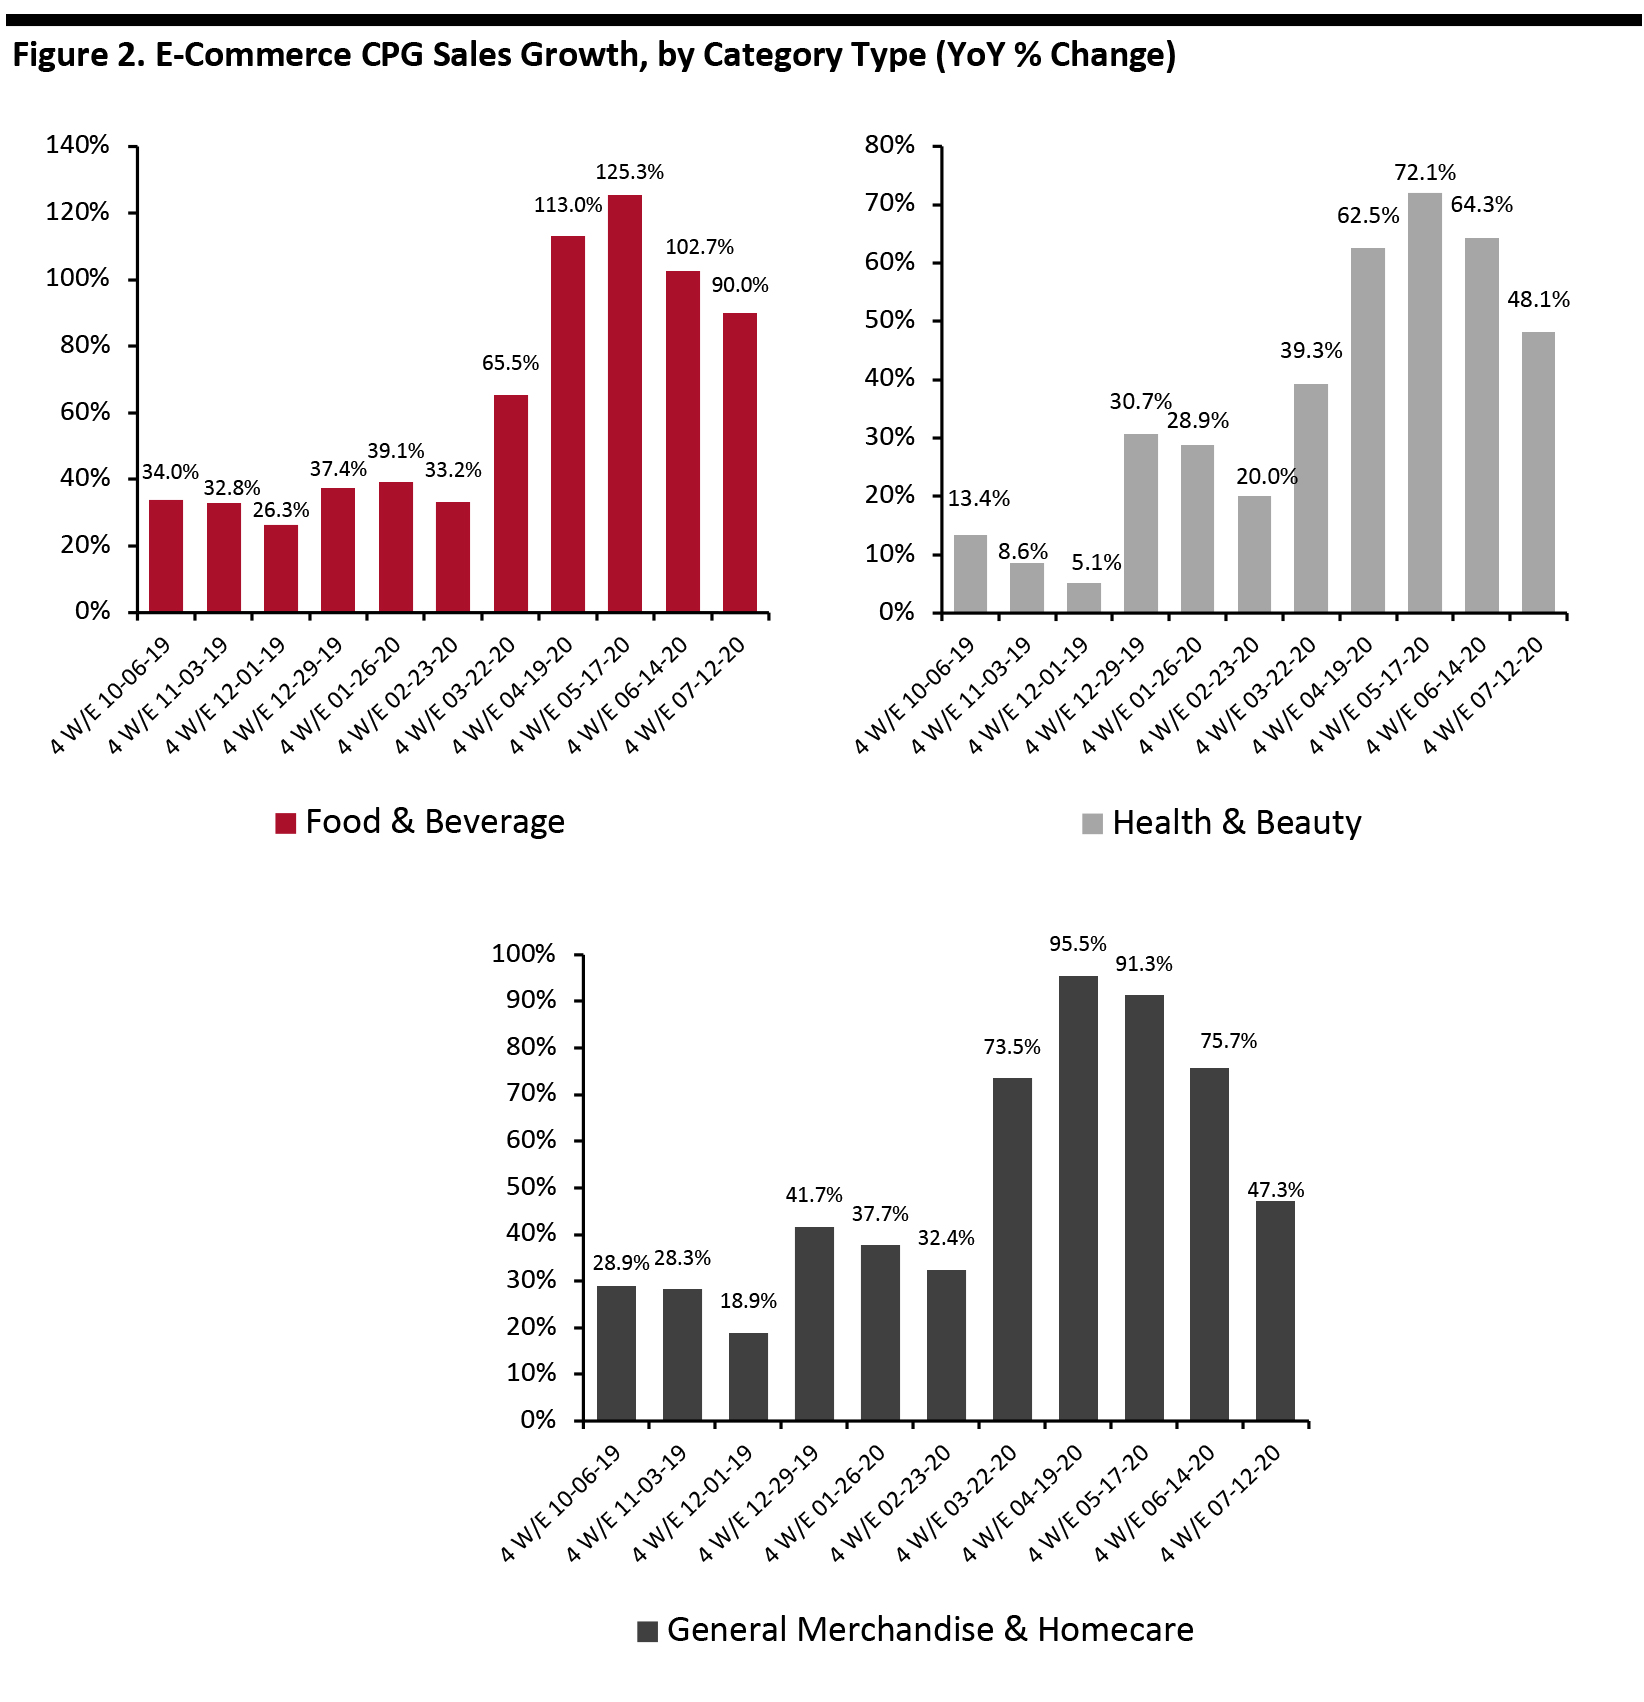 Source: IRI E-Market Insights™/Coresight Research [/caption]
3. Breakdown of Online CPG Sales: Food & Beverage Picks Up Slightly; General Merchandise & Homecare Is Trending Down
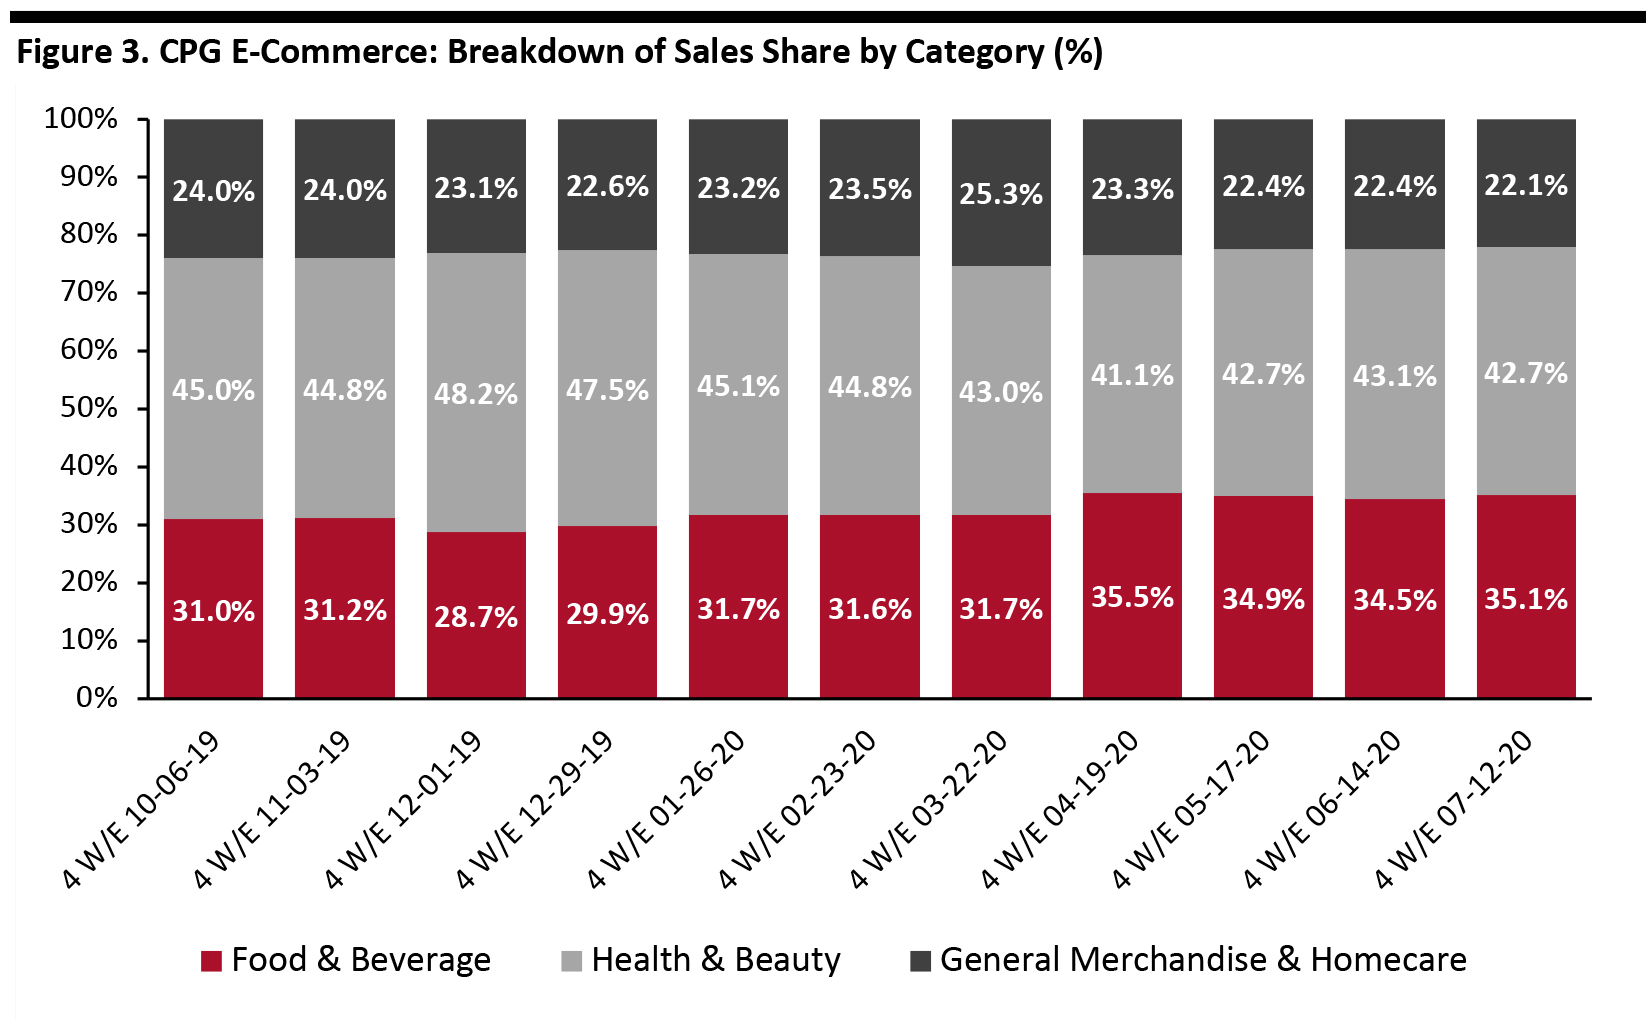
The chart below shows the breakdown of online sales by type of CPG category. Health & beauty accounts for nearly half of online CPG dollar sales. Food & beverage continues to account for a minority of total online CPG sales. However, the 90% growth for food & beverage in the latest period took this category’s share to just over 35% of CPG e-commerce—very slightly below the crisis peak of 35.5% in April.
[caption id="attachment_115705" align="aligncenter" width="700"]
 Source: IRI E-Market Insights™/Coresight Research [/caption]
4. Frozen Foods Continue To Outpace Other Food Departments in Total Sales
The gradual reopening of restaurants across the US is attracting some spending back to the food-away-from-home channel, but thus far, food dollars spent at retail continue to be strong—far above pre-coronavirus levels.
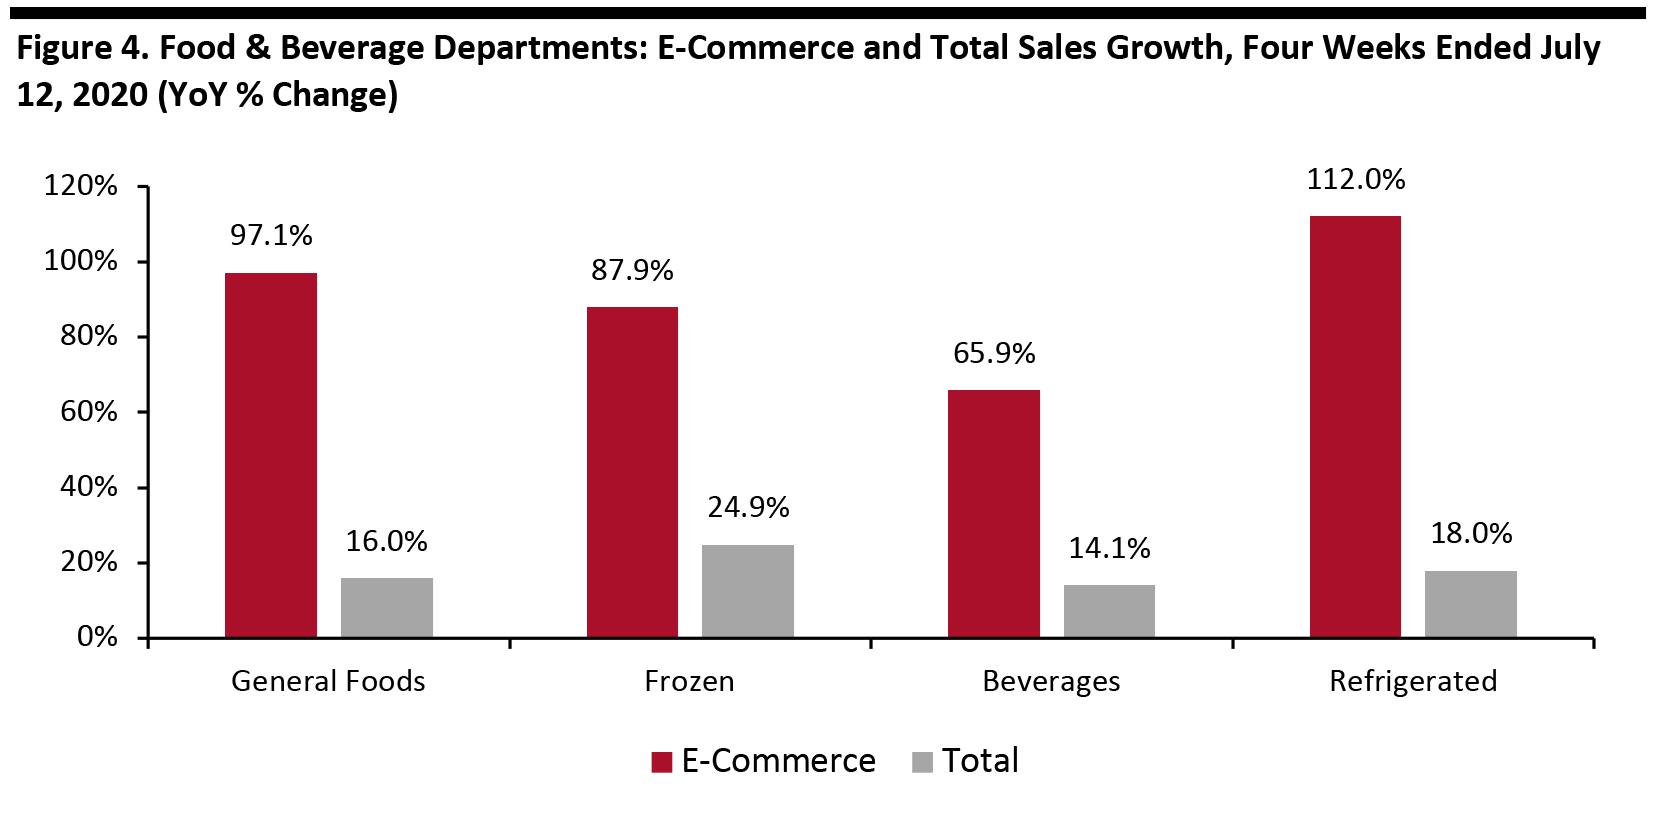
Four months into the pandemic, consumers’ reliance on frozen food is not showing any signs of abatement. For the latest four weeks, frozen foods posted total sales growth of 24.9%, driven by seafood (54.7%), meat (37.8%) and fruit (36.2%).
In addition, the high demand for frozen food is likely to continue in the near future. According to a survey conducted by the American Frozen Food Institute in April, almost 50% of respondents who had bought frozen foods since early March said that they expect to purchase “a lot” or “somewhat” more frozen food in the next few months.
In the online channel, refrigerated foods outperformed other food departments, with sales growth of 112% versus last year, driven by tea/coffee (243%), pasta (230%) and butter (183%).
[caption id="attachment_115707" align="aligncenter" width="700"]
 Source: IRI E-Market Insights™/Coresight Research [/caption]
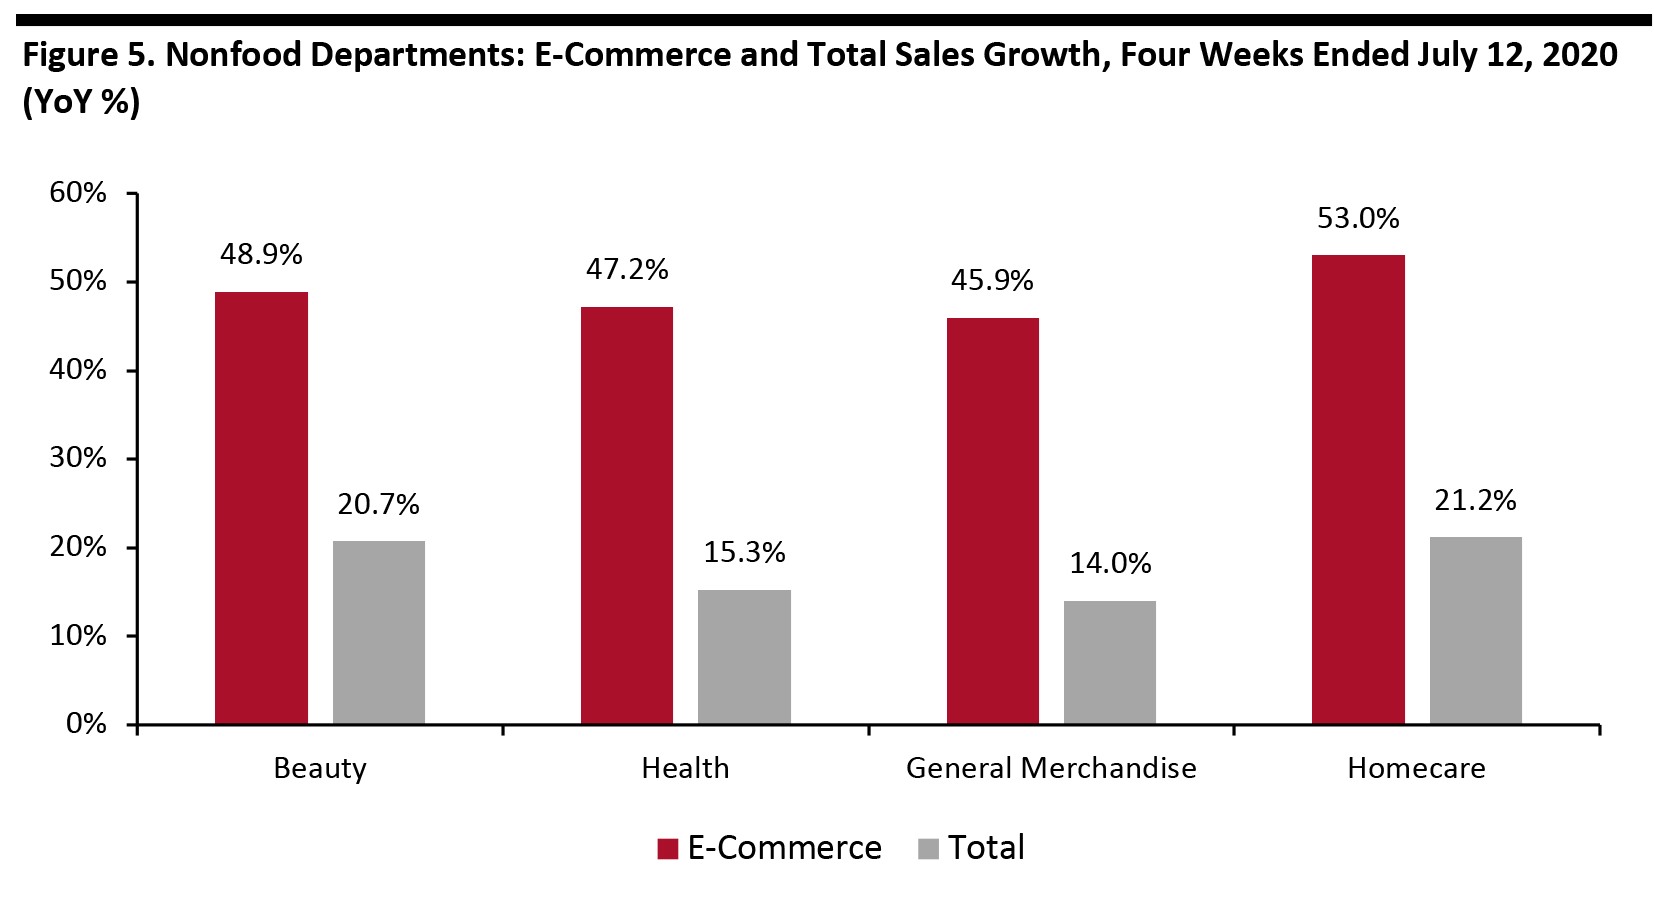
5. Homecare Shows the Strongest Growth Among Nonfood Departments
Homecare products continued to see high demand in July, driven by household cleaning supplies, as consumers’ heightened focus on hygiene continues four months into the pandemic. The online channel saw the highest year-over-year growth among the nonfood departments, at 53.0%, while total sales increased by 21.2% over last year. Overall homecare sales were driven by household cleaners (36.8%), cleaning tools (34.4%) and bleach (31.0%).
Due to the pandemic, household cleaning products remain at the top of consumers’ shopping lists. Reckitt Benckiser, for example, reported that the demand for Lysol products had “exploded” in the US in the first fiscal half ended June 30, 2020. During the period, the company sold two and a half times as much Lysol disinfectant spray as it did last year. This trend is also supported by the recent Coresight Research survey conducted on August 5, which found that almost 44% of US consumers are currently buying more household items, such as cleaning or laundry products.
[caption id="attachment_115708" align="aligncenter" width="700"]
 Source: IRI E-Market Insights™/Coresight Research [/caption]
What We Think
Covid-19 has amplified the ongoing digital disruption in the CPG industry. The online channel was significantly up during the lockdown period as the widespread virus kept many shoppers at home and away from physical stores.
With cases in the US surging into mid-July, the e-commerce channel continues to grow apace as consumers adopt many digital and contactless services for shopping essentials. In a shift that is expected to stick to post crisis, we believe that the online channel will expand at a more robust rate than before Covid-19. To thrive in a post-crisis environment, CPG manufacturers will have to step up their digital game, including by partnering with online retailers as well as selling directly to consumers by beefing up their e-commerce offering.
IRI Disclaimer: The information contained herein is based in part on data reported by the IRI E-Market Insights™solution and as interpreted solely by Coresight Research. The information is believed to be reliable at the time supplied by IRI but is neither all-inclusive nor guaranteed by IRI or Coresight Research, Inc. Without limiting the generality of the foregoing, specific data points may vary considerably from other information sources. Any opinion expressed herein reflect the judgement of Coresight Research, Inc. and are subject to change. IRI disclaims liability of any kind arising from the use of this information.
Source: IRI E-Market Insights™/Coresight Research [/caption] 2. The General Merchandise & Homecare Category Sees E-Commerce Sales Growth Soften Consumers have drastically ramped up their online purchases of food products. Many major food retailers reported exceptional growth in online grocery sales. Albertsons, for example, saw online sales surge by 276% in its first quarter, ended June 20, 2020. Food & beverage continues to see higher growth than other CPG categories, soaring 90% for the latest four weeks. E-commerce sales growth of general merchandise & homecare saw significant erosion, slowing from 75.7% for the four weeks ended June 14 to 47.3% for the four weeks ended July 12 (down by 28.4 percentage points) [caption id="attachment_115704" align="aligncenter" width="700"]
IRI Disclaimer: The information contained herein is based in part on data reported by the IRI E-Market Insights™solution and as interpreted solely by Coresight Research. The information is believed to be reliable at the time supplied by IRI but is neither all-inclusive nor guaranteed by IRI or Coresight Research, Inc. Without limiting the generality of the foregoing, specific data points may vary considerably from other information sources. Any opinion expressed herein reflect the judgement of Coresight Research, Inc. and are subject to change. IRI disclaims liability of any kind arising from the use of this information.