Nitheesh NH
US CPG Sales Tracker: Coresight Research x IRI Analysis
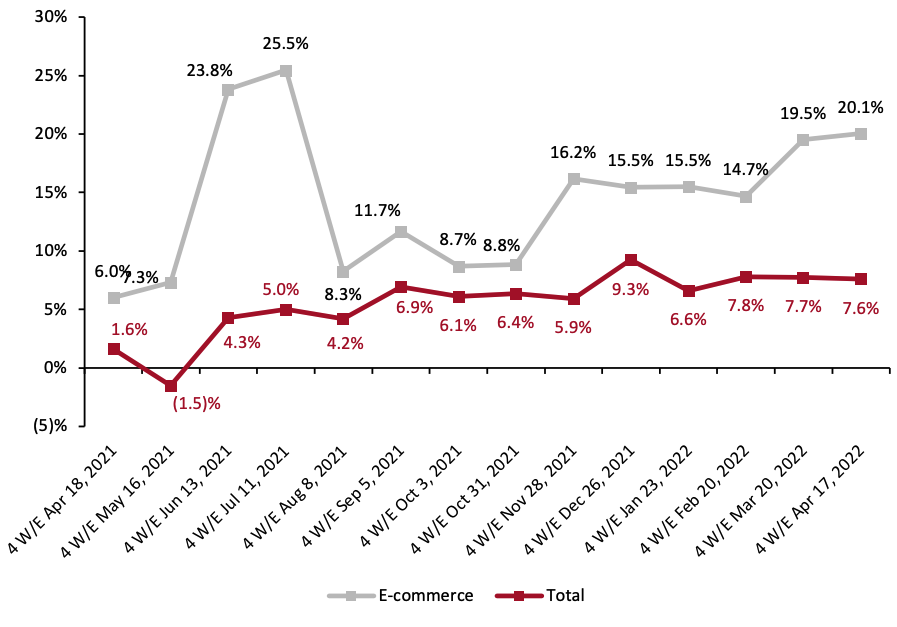
The Coresight Research and IRI monthly US CPG Sales Tracker presents data-driven insights into online sales trends in the US CPG industry—covering the food & beverage, health & beauty, and general merchandise & homecare product categories. In this report, we present five key insights for the four weeks ended April 17, 2022. 1. Online CPG Sales Growth Hits 20% CPG e-commerce saw 20.1% year-over-year growth for the four weeks ended April 17, 2022, up from 19.5% in March, rising above the mid-to-high-teens growth seen throughout 2022. We expect e-commerce year-over-year growth rates to accelerate in May 2022 as comparatives weaken further. The two-year stack for e-commerce stands at 26.1% in April 2022—down from a 48.7% two-year stack in March—but still indicating strong growth overall. In contrast, total CPG sales growth slowed marginally this period—to 7.6% year-over-year from 7.7% in March—but remains relatively stable at a high-single-digit pace.Figure 1. CPG E-Commerce and Total Sales Growth (YoY % Change) [caption id="attachment_148155" align="aligncenter" width="700"]
 Historical data have been revised for the latest period
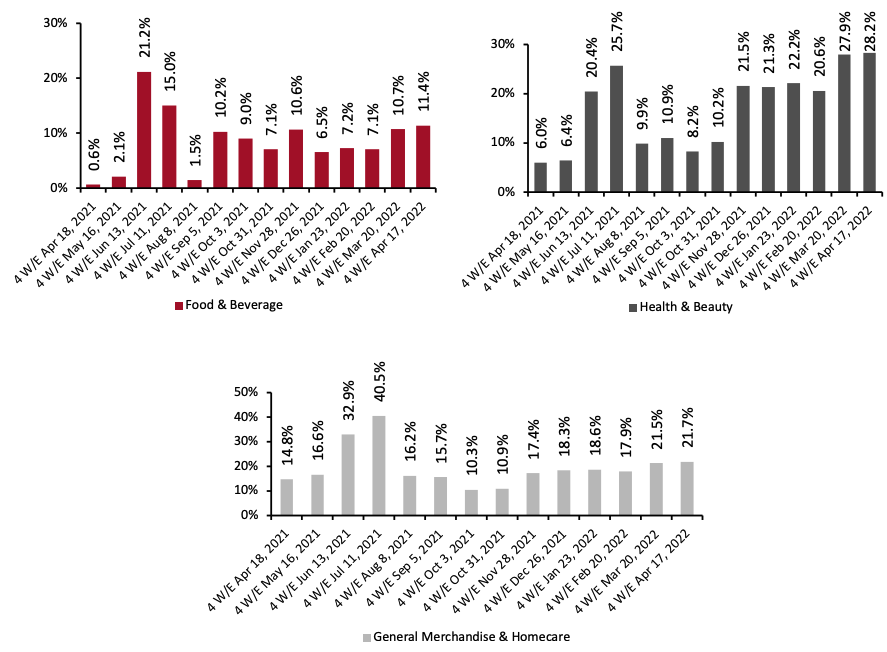
Source: IRI E-Market Insights™/Coresight Research[/caption] Separately, the US Bureau of Labor Statistics reported food-at-home inflation reached 10.8% year over year in April, from 10.0% in March, while the US Census Bureau reported an 8.9% year-over-year uplift in food and beverage retailers’ sales in April (this sector data excludes other forms of grocery retailers such as mass merchandisers and warehouse clubs). Versus food inflation, the IRI data on CPG sales (above) and the Census Bureau data on food sector sales imply some erosion of grocery volumes year over year. 2. Growth Remains Steady in All Three CPG Categories We break down the online CPG market into three major categories: food & beverage, health & beauty and general merchandise & homecare. All categories’ growth remained steady this period, reaching 11.4%, 28.2% and 21.7% year over year, respectively. Of the three categories, food & beverage experienced the highest increase in March, rising 0.7 percentage points. Meanwhile, general merchandise & homecare and health & beauty growth increased marginally, at 0.2 and 0.3 percentage points, respectively.
Figure 2. E-Commerce CPG Sales Growth by Category Type (YoY % Change) [caption id="attachment_148156" align="aligncenter" width="700"]
 Historical data have been revised in the latest period
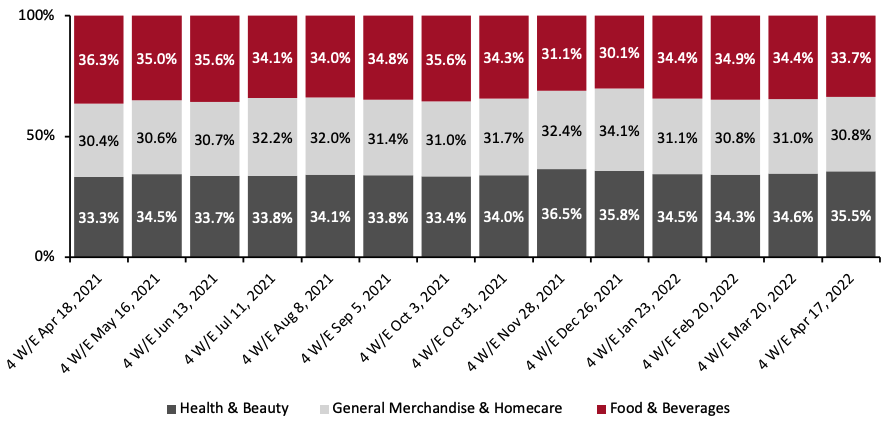
Source: IRI E-Market Insights™/Coresight Research[/caption] 3. Breakdown of Online CPG Sales: Food & Beverage’s Share Decreases for Second Consecutive Month In Figure 3 below, we breakdown online sales by CPG category. In the four weeks ended April 17, 2022, the health & beauty category rose by 0.9 percentage points to 35.5%, the largest increase of the period. Meanwhile, food & beverage and general merchandise & homecare declined by 0.7 and 0.2 percentage points to 33.7% and 30.8%, respectively, the second decline of food & beverage’s market share this year.
Figure 3. CPG E-Commerce: Breakdown of Sales Share by Category (%) [caption id="attachment_148159" align="aligncenter" width="700"]
 Source: IRI E-Market Insights™/Coresight Research[/caption]
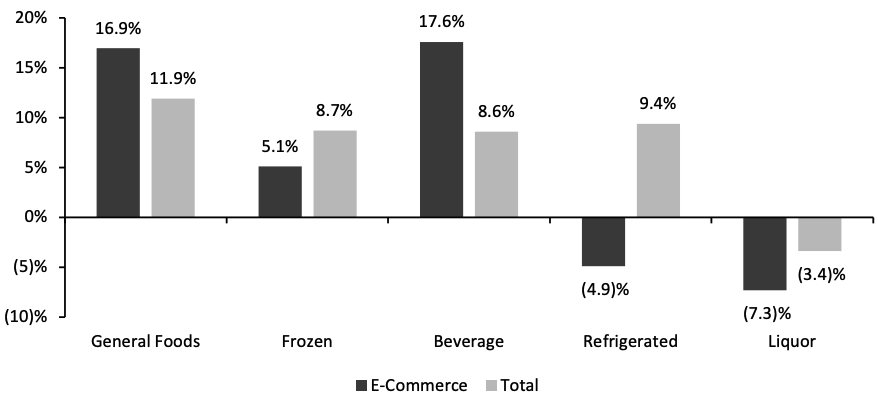
4. Beverage and General Foods Outpace Other Food Departments in Online and Total Sales, Respectively
The beverage department reported the highest year-over-year online sales growth rate, at 17.6%. Meanwhile, the general foods department reported the highest year-over-year growth rate in total sales, at 11.9% year-over-year growth. Online sales growth for the beverage department was driven by increases in sales of sports drinks (up 28.8%), milk flavoring/cocoa mixes (up 27.2%) and coffee (up 26.7%). For the general foods department, total sales growth was primarily driven by an increase in the sales of egg substitutes (up 78.6%) and matzoh food (up 65.0%).
Source: IRI E-Market Insights™/Coresight Research[/caption]
4. Beverage and General Foods Outpace Other Food Departments in Online and Total Sales, Respectively
The beverage department reported the highest year-over-year online sales growth rate, at 17.6%. Meanwhile, the general foods department reported the highest year-over-year growth rate in total sales, at 11.9% year-over-year growth. Online sales growth for the beverage department was driven by increases in sales of sports drinks (up 28.8%), milk flavoring/cocoa mixes (up 27.2%) and coffee (up 26.7%). For the general foods department, total sales growth was primarily driven by an increase in the sales of egg substitutes (up 78.6%) and matzoh food (up 65.0%).
Figure 4. Food & Beverage Departments: E-Commerce and Total Sales Growth, Four Weeks Ended April 17, 2022 (YoY % Change) [caption id="attachment_148160" align="aligncenter" width="700"]
 Source: IRI E-Market Insights™/Coresight Research[/caption]
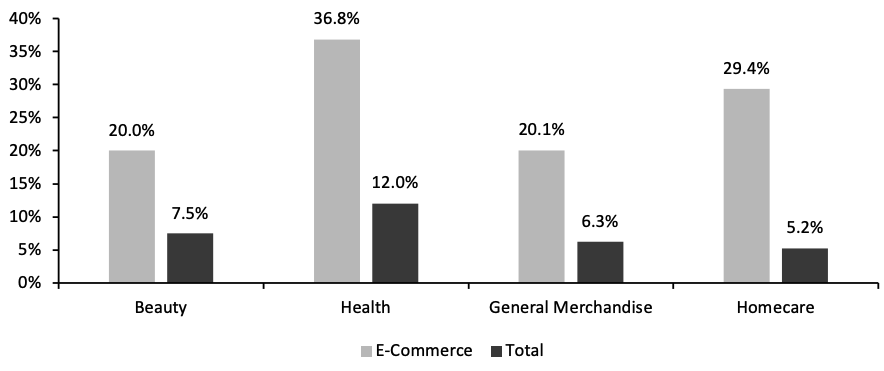
5. Health Continues to Lead Online Growth Among Nonfood Departments
The health department saw the highest year-over-year online and total sales growth among nonfood departments in the four weeks ended April 17, 2022, reaching 36.8% and 12.0% year-over-year growth, respectively. Health’s e-commerce growth was driven by denture products (up 72.6%), toothpaste (up 62.7%) and hemorrhoidal remedies (up 61.9%). Furthermore, most sub-categories registered an average year-over-year growth of around 42%.
Source: IRI E-Market Insights™/Coresight Research[/caption]
5. Health Continues to Lead Online Growth Among Nonfood Departments
The health department saw the highest year-over-year online and total sales growth among nonfood departments in the four weeks ended April 17, 2022, reaching 36.8% and 12.0% year-over-year growth, respectively. Health’s e-commerce growth was driven by denture products (up 72.6%), toothpaste (up 62.7%) and hemorrhoidal remedies (up 61.9%). Furthermore, most sub-categories registered an average year-over-year growth of around 42%.
Figure 5. Nonfood Departments: E-Commerce and Total Sales Growth, Four Weeks Ended April 17, 2022 (YoY % Change) [caption id="attachment_148161" align="aligncenter" width="700"]
 Source: IRI E-Market Insights™/Coresight Research[/caption]
What We Think
CPG e-commerce continued its strong year-over-year growth this period, passing 20%, with all three categories experiencing steady growth. We expect online CPG sales growth to continue to strengthen in the coming months due to weaker comparatives in May 2021 and consumers largely retaining their online grocery shopping habit. Although imperfectly matched versus pure food inflation, IRI data on CPG sales and Census Bureau data on food retailers’ sales imply some erosion of grocery volumes year over year—across retail in total, US shoppers are spending more but buying less.IRI Disclaimer: The information contained herein is based in part on data reported by the IRI E-Market Insights™ solution and as interpreted solely by Coresight Research. The information is believed to be reliable at the time supplied by IRI but is neither all-inclusive nor guaranteed by IRI or Coresight Research, Inc. Without limiting the generality of the foregoing, specific data points may vary considerably from other information sources. Any opinions expressed herein reflect the judgement of Coresight Research, Inc. and are subject to change. IRI disclaims liability of any kind arising from the use of this information.