albert Chan
The Coresight Research and IRI monthly US CPG Sales Tracker provides our data-driven insights into online sales trends in the US CPG industry—covering the product categories of food & beverage; health & beauty; and general merchandise & homecare. In this report, we present five key insights into the four weeks ended December 27, 2020.
1. Online CPG Growth ModeratesCPG e-commerce growth remains at elevated levels but moderated to 58.1% for the four weeks ended December 27, compared to 63% and 66.2% growth in the prior two periods. Total CPG sales growth moderated too, to 12.1% from previous growth of 15.3%. This may reflect early shopping and stocking up ahead of the final holiday peak.
A 21% drop in food-service retail sales in December, recorded by the US Census Bureau, reflected the continued shift of food dollars to at-home consumption.
Figure 1. CPG E-Commerce and Total Sales Growth (YoY % Change)
[caption id="attachment_122294" align="aligncenter" width="700"]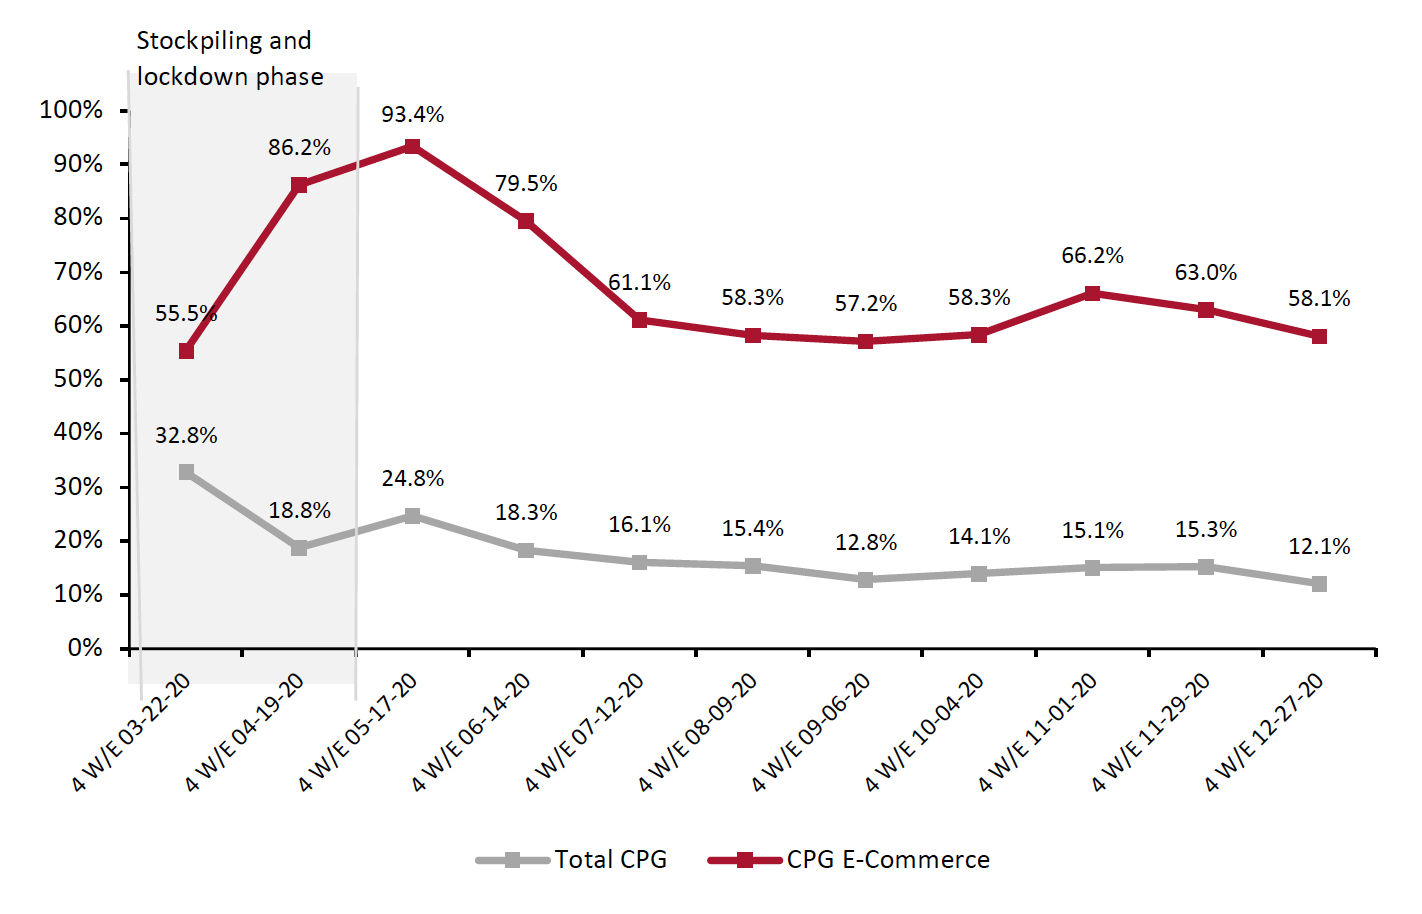 Historical data have been revised for the latest period
Source: IRI E-Market Insights™/Coresight Research[/caption] 2. Food & Beverage Online Sales Growth Slows
Food & beverage continued to see higher online growth than other categories but slowed to 75.3% in the four weeks ended December 27, compared to over 80% growth in the prior two periods. Grocery retailers continued to benefit from the strong grocery e-commerce trend. For example, Albertsons’ digital sales soared 225% in its third quarter, ended December 5, 2020—its third straight quarter of over 200% growth.
Online sales growth in the general merchandise & homecare category remains above the 60% mark but fell by 2.8 percentage points from the prior period. General merchandise retailer Big Lots reported in its third-quarter 2020 earnings conference that it had seen a “robust pull-forward of holiday sales in October and November” for the quarter ended October 31.
Health & beauty sales slowed by around four percentage points in December, moderating from the growth erosion it experienced in the prior period.
Figure 2. E-Commerce CPG Sales Growth, by Category Type (YoY % Change)
[caption id="attachment_122295" align="aligncenter" width="700"]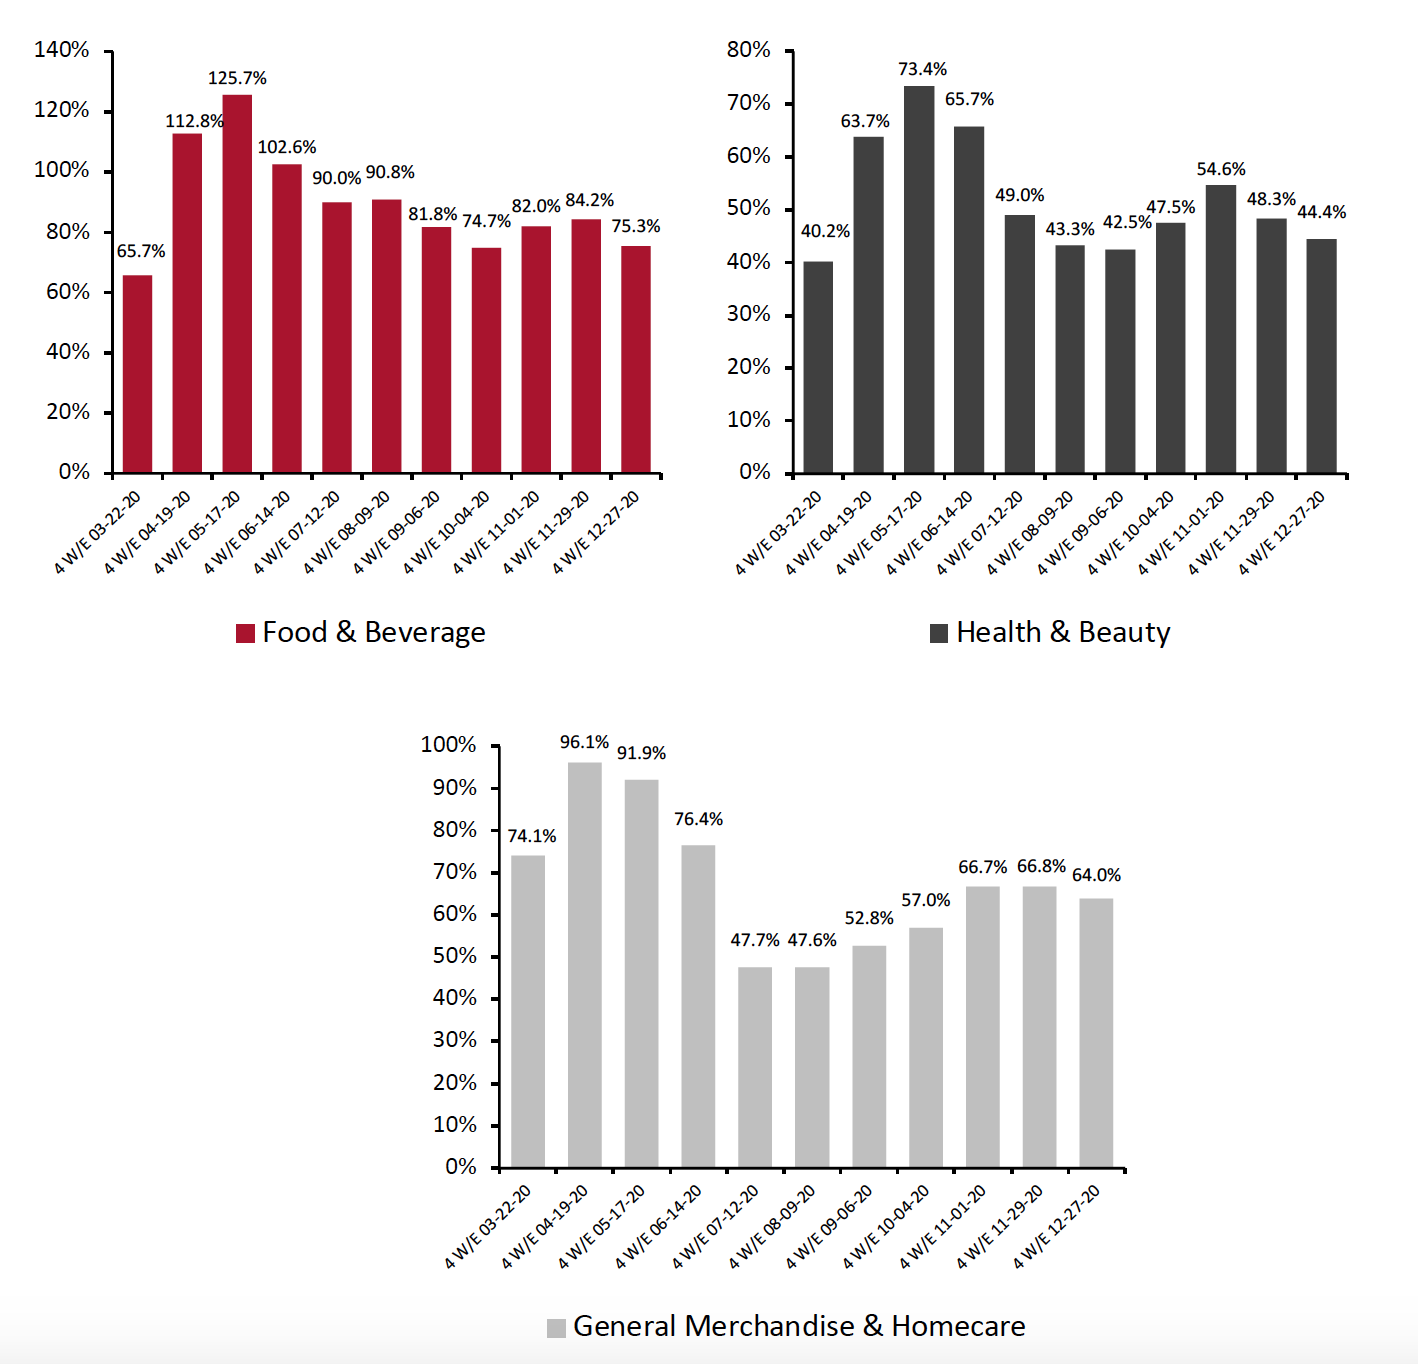 Historical data have been revised in the latest period
Source: IRI E-Market Insights™/Coresight Research[/caption] 3. Breakdown of Online CPG Sales: Food & Beverage Trending Up
The chart below shows the breakdown of online sales by type of CPG category. After posting declining share over four consecutive periods, the food & beverage share of online CPG sales rose to 33.7% in December. Health & beauty’s online share dropped by 0.3 percentage points to 43.2%, while that of general merchandise & homecare dropped by 0.2 percentage points to 23.1%.
Figure 3. CPG E-Commerce: Breakdown of Sales Share by Category (%)
[caption id="attachment_122296" align="aligncenter" width="700"]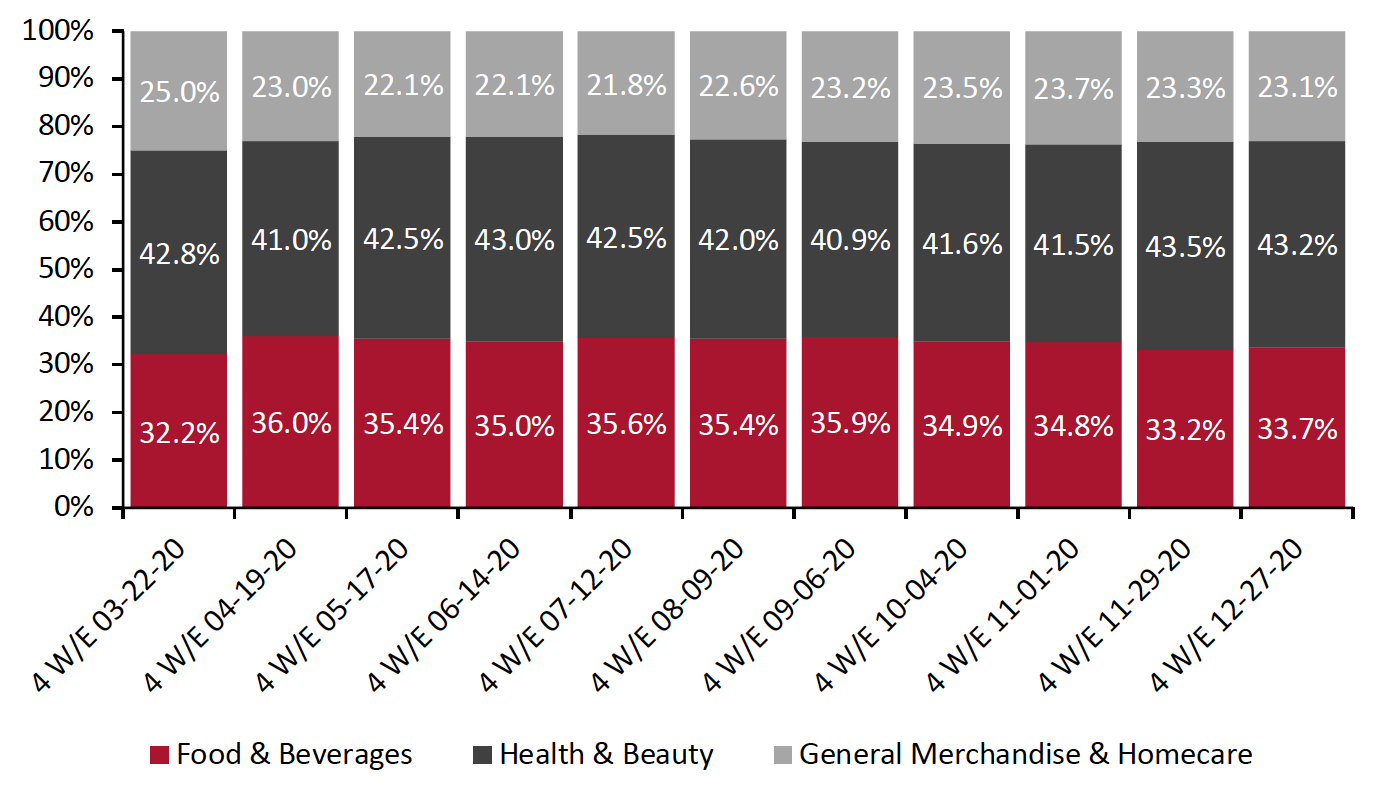 Historical data have been revised in the latest period
Source: IRI E-Market Insights™/Coresight Research[/caption] 4. The Refrigerated Foods Department Outpaces Other Food Departments in Online Sales
Total food & beverage sales growth remains in the double digits, at 13.1%. However, this is slower than the 15.1% growth in the prior period, as consumers appear to have stocked up early for the holidays.
Among the major groupings charted below, refrigerated foods saw the biggest online gains for the four weeks ended December 27, with growth of 90.4% versus last year, driven by entrées (up 153%), pasta (up 146%), creams (up 144%) and juices (up 138%).
The popularity of frozen foods has persisted, as total sales outperformed other food departments yet again, rising 21.7% in the latest period, driven by seafood (up 99%), meat (up 62%), poultry (up 61%) and dinners/entrées (up 58%). Albertsons noted higher-than-average comparable sales in its meat and seafood categories in its third fiscal quarter.
Figure 4. Food & Beverage Departments: E-Commerce and Total Sales Growth, Four Weeks Ended December 27, 2020 (YoY %)
[caption id="attachment_122297" align="aligncenter" width="700"]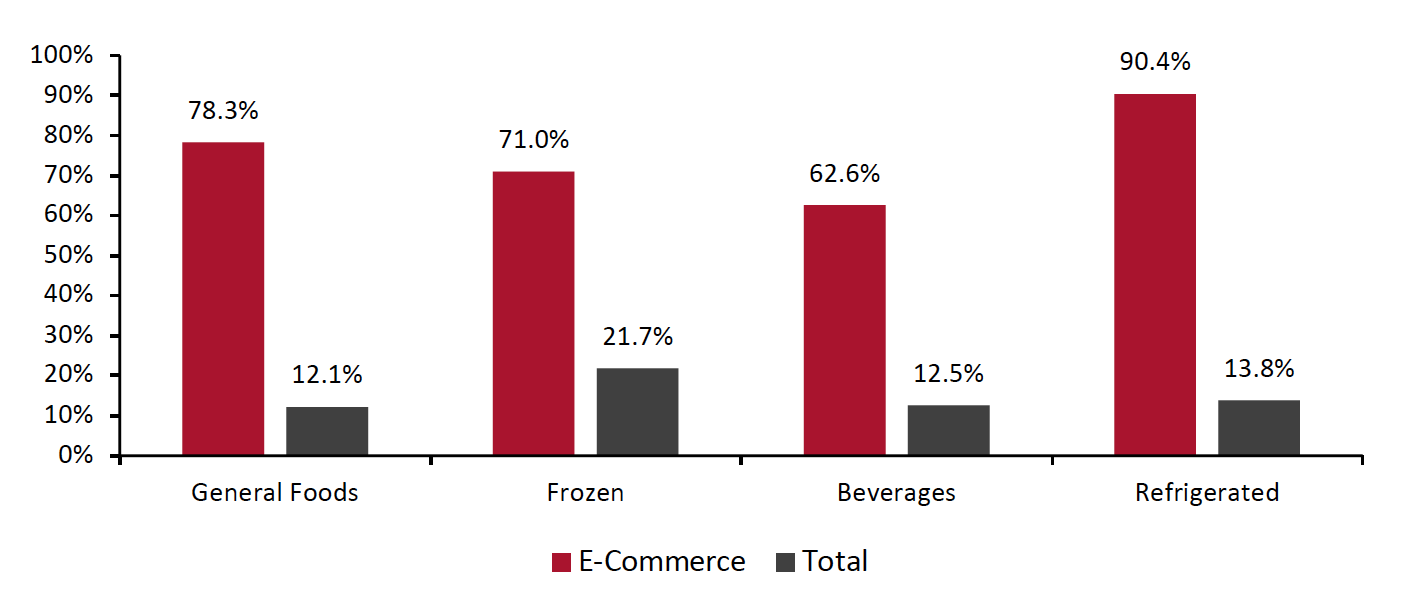 Source: IRI E-Market Insights™/Coresight Research[/caption]
5. Homecare Posted the Greatest Online Growth Among Nonfood Departments
Source: IRI E-Market Insights™/Coresight Research[/caption]
5. Homecare Posted the Greatest Online Growth Among Nonfood Departments
Homecare observed the highest online growth of 79.8% for the four weeks ended December 27, 2020, driven by cleaning tools, mops and brooms (up 158%), household cleaner (up 100%) and laundry detergent (up 40%). This category also saw the highest total growth among the nonfood departments, at 22.6%.
Household cleaning products remain at the top of consumers’ shopping lists. According to Big Lots, it saw stronger purchases in its paper and cleaning products categories in its third quarter. This trend is also supported by a Coresight Research survey conducted on January 11, 2021, which found that one in three US consumers are currently buying more household products, such as cleaning or laundry products, than they did before the coronavirus outbreak.
Figure 5. Nonfood Departments: E-Commerce and Total Sales Growth, Four Weeks Ended December 27, 2020 (YoY %)
[caption id="attachment_122298" align="aligncenter" width="700"]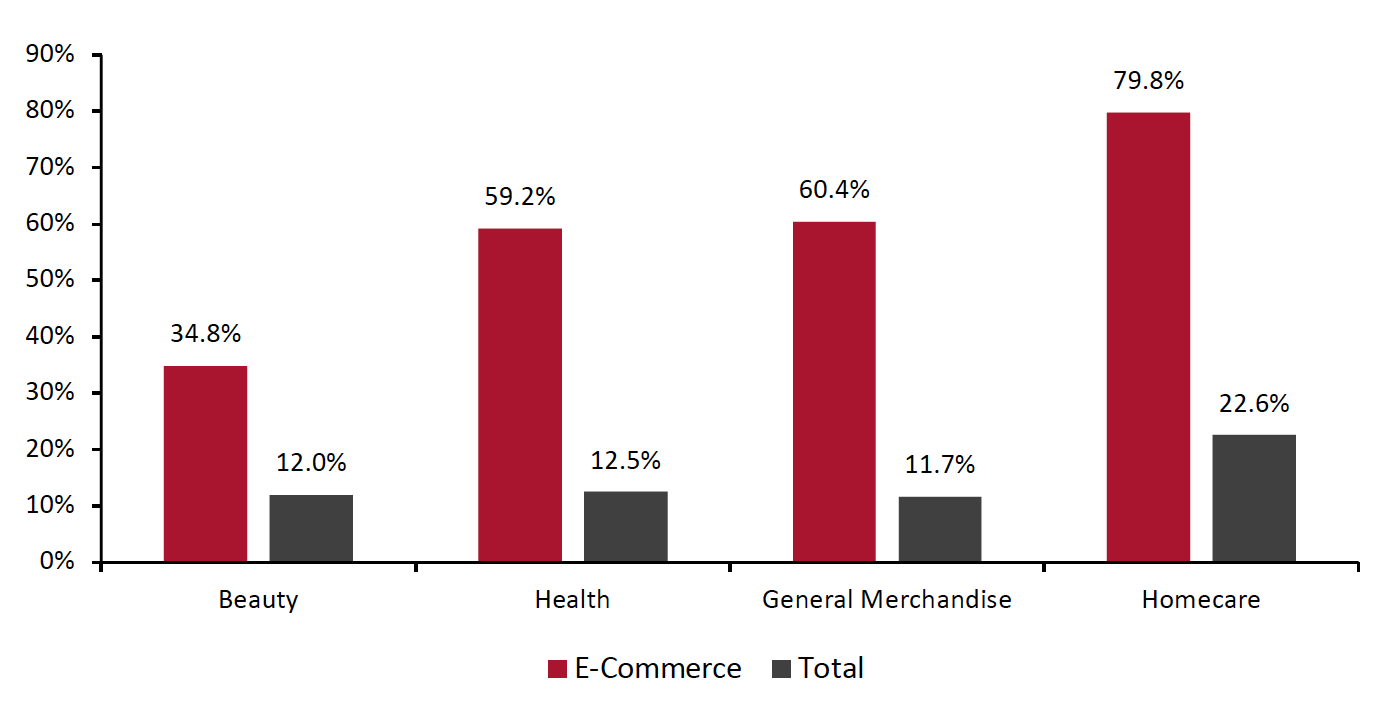 Source: IRI E-Market Insights™/Coresight Research[/caption]
What We Think
The Covid-19 pandemic is still prompting consumers to choose the online channel to shop, rather than shopping in-store, although growth in e-commerce has eased from its second peak in fall 2020.
With the rates of new coronavirus cases remaining high and the vaccine rollout being in a nascent stage, the health crisis will continue to drive at-home food consumption trends and purchases of home cleaning products.
As online buying behaviors continue, e-commerce is likely become more firmly embedded as the go-to option well beyond the pandemic. CPG firms should look to strengthen their digital channels and consider ways to reach the consumer quickly, such as by selling to consumers through their own e-commerce platforms as well as partnering with online retailers.
IRI Disclaimer: The information contained herein is based in part on data reported by the IRI E-Market Insights™ solution and as interpreted solely by Coresight Research. The information is believed to be reliable at the time supplied by IRI but is neither all-inclusive nor guaranteed by IRI or Coresight Research, Inc. Without limiting the generality of the foregoing, specific data points may vary considerably from other information sources. Any opinion expressed herein reflect the judgement of Coresight Research, Inc. and are subject to change. IRI disclaims liability of any kind arising from the use of this information.