Nitheesh NH
The Coresight Research and IRI monthly US CPG Sales Tracker provides our data-driven insights into online sales trends in the US CPG industry—covering the product categories of food & beverage; health & beauty; and general merchandise & homecare. In this report, we present five key insights into the four weeks ended September 5, 2021.
1. Online CPG Growth Continues To Moderate
CPG e-commerce year-over-year growth eased for the second consecutive month, growing 9.4% for the four weeks ended September 5, 2021, down from 12.8% in the prior period.
Growth deceleration for the latest period can be partly attributed to the annualization of pandemic spending patterns. Last year, during the four weeks ended September 6, 2020, total e-commerce CPG sales reported a staggering year-over-year increase of 75.2%.
Figure 1. CPG E-Commerce and Total Sales Growth (YoY % Change) [caption id="attachment_133823" align="aligncenter" width="700"]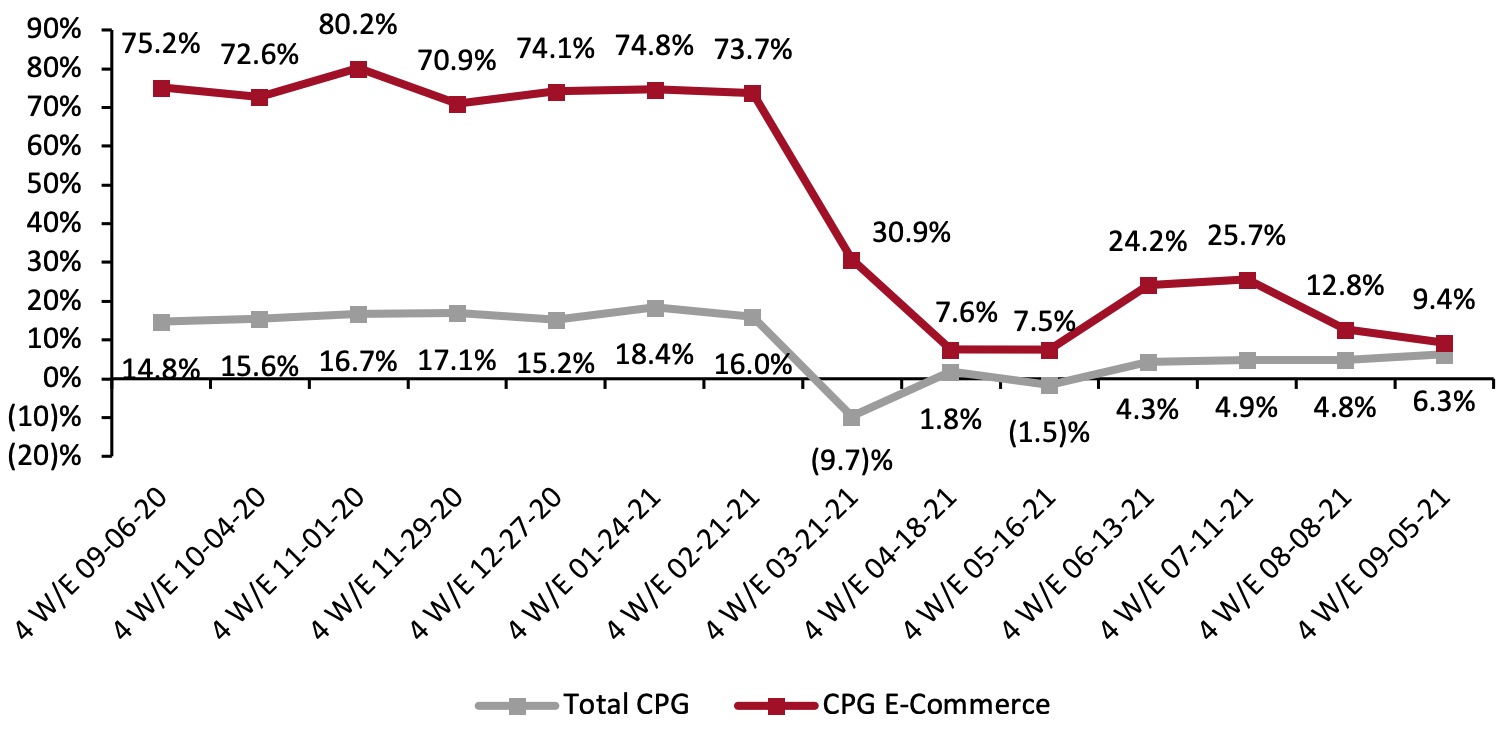 Historical data have been revised for the latest period
Source: IRI E-Market Insights™/Coresight Research[/caption] In relation to more consistent comparatives of 2019, online CPG growth showed a similar pattern: For the four weeks ended September 5, growth totaled 91.7%, but this represented a decrease of 4.6 percentage points from the previous period’s growth on a two-year basis.
Figure 2. CPG E-Commerce and Total Sales Growth (% Change from Two Years Prior) [caption id="attachment_133824" align="aligncenter" width="700"]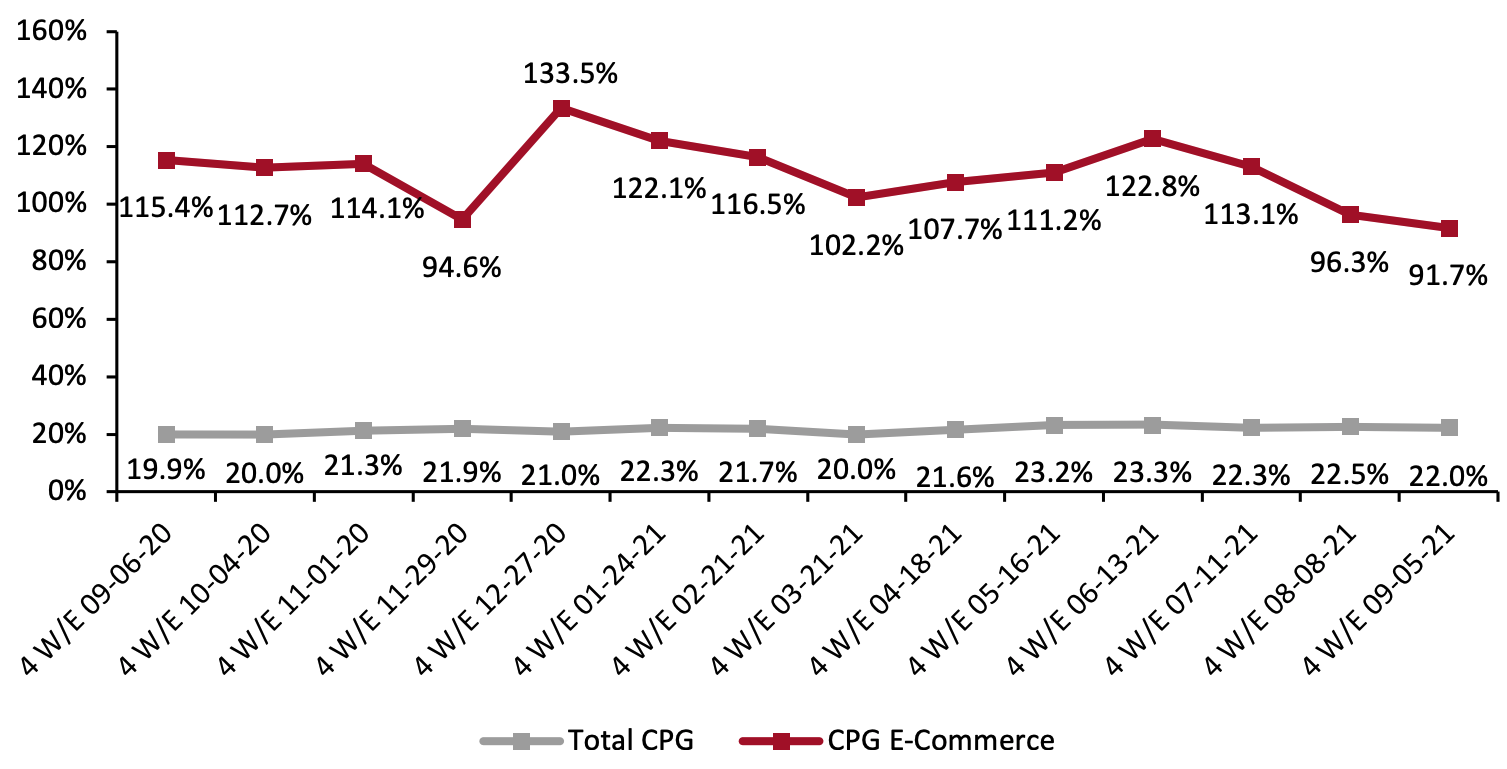 Historical data have been revised for the latest period
Source: IRI E-Market Insights™/Coresight Research [/caption] 2. General Merchandise & Homecare and Health & Beauty Witness Growth Deceleration General merchandise & homecare and health & beauty saw year-over-year growth trends soften for the second consecutive period, falling to 13.6% and 7.9%, respectively. However, online sales in both categories remain significantly elevated from 2019 levels. Online food & beverage sales stayed almost consistent versus the prior period, growing 7.2% year over year. It is worth noting that the food & beverage category continues to see high online growth relative to other categories, when compared on a two-year basis—rising by 113.6% in the latest period.
Figure 3. E-Commerce CPG Sales Growth, by Category Type (YoY % Change) [caption id="attachment_133825" align="aligncenter" width="700"]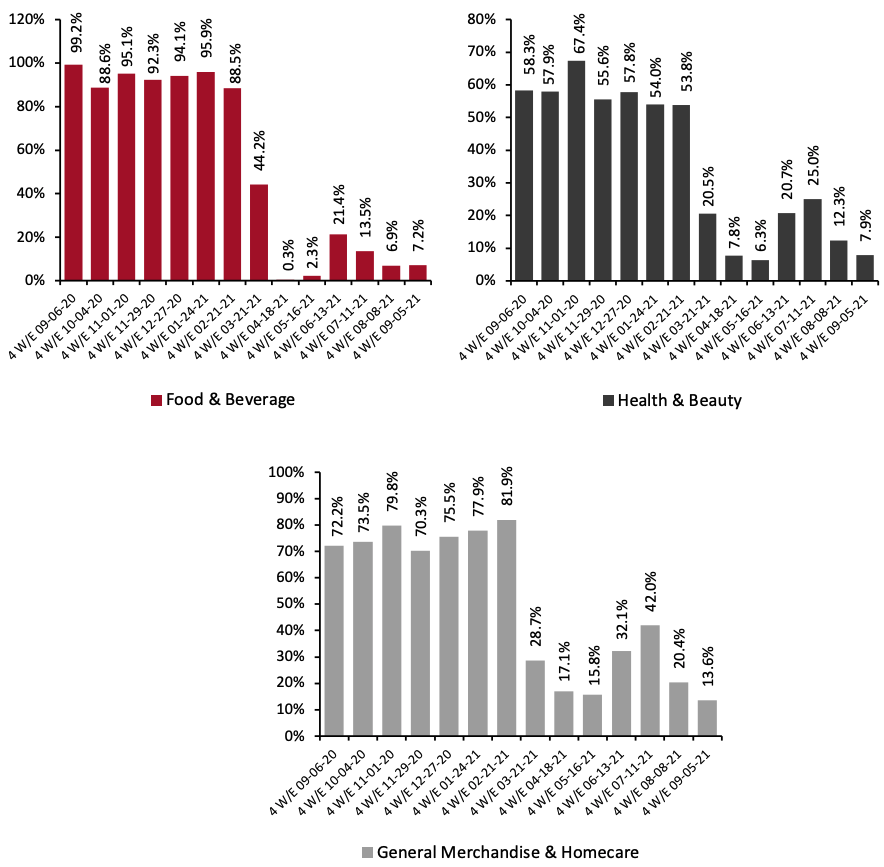 Historical data have been revised in the latest period
Source: IRI E-Market Insights™/Coresight Research[/caption]
Figure 4. E-Commerce CPG Sales Growth, by Category Type (% Change from Two Years Prior) [caption id="attachment_133826" align="aligncenter" width="700"]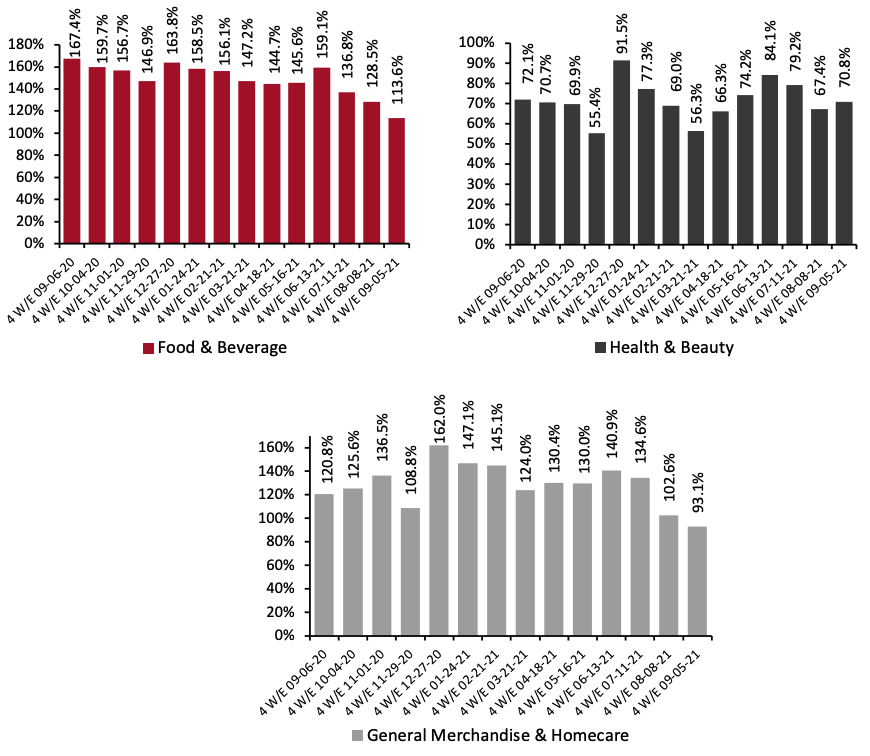 Historical data have been revised in the latest period
Source: IRI E-Market Insights™/Coresight Research[/caption] 3. Breakdown of Online CPG Sales: Food & Beverage Trending Upward Food & beverage’s online share is on an upward trend, reaching 34.5% for the four weeks ended September 5. Healthy & beauty picked up again to reach 34.1%, while the general merchandise & homecare share declined by 0.7 percentage points to reach 31.4%.
Figure 5. CPG E-Commerce: Breakdown of Sales Share by Category (%) [caption id="attachment_133827" align="aligncenter" width="700"]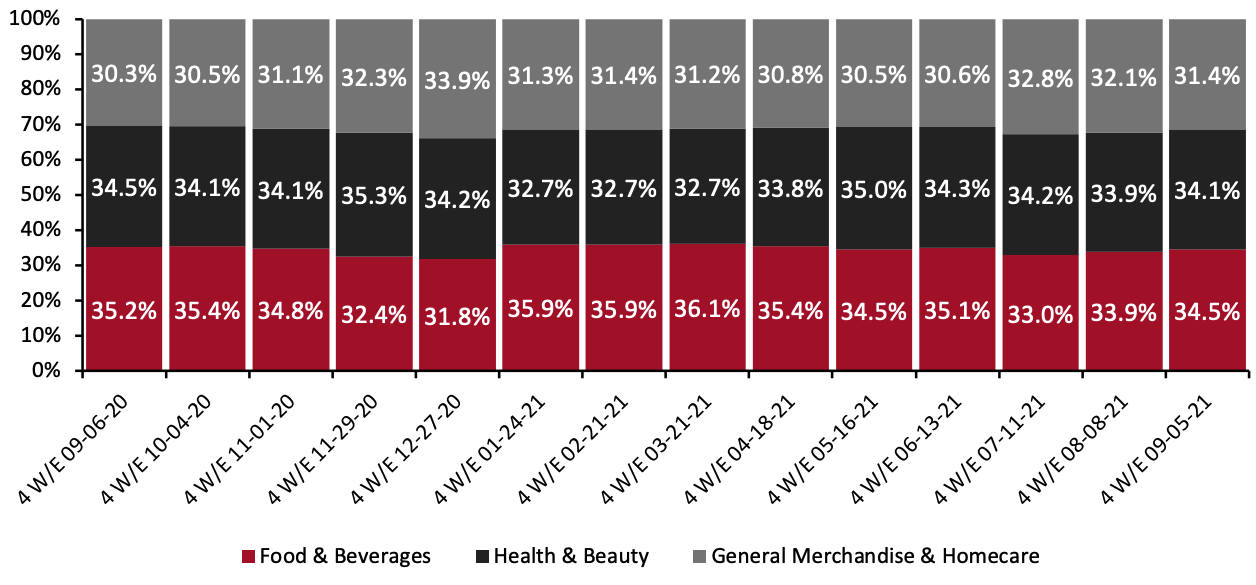 Source: IRI E-Market Insights™/Coresight Research[/caption]
4. Frozen Food Outpaces Other Food Departments in Online Sales
Frozen food has been a popular department throughout the pandemic and continues to hold firm. Among the major food departments charted below, frozen saw substantial online gains—growing 16.7% from the comparable period in 2020 and 127.4% from 2019. Year-over-year online growth was driven by processed poultry (up 39%), appetizers and snack rolls (up 35.6%) and pies (up 13.9%).
On a two-year basis, however, the refrigerated department witnessed higher growth, reaching 139.7%. Growth was driven by creamers (up 260%), seafood (up 227.3%) and breakfast meats (up 193.8%).
Source: IRI E-Market Insights™/Coresight Research[/caption]
4. Frozen Food Outpaces Other Food Departments in Online Sales
Frozen food has been a popular department throughout the pandemic and continues to hold firm. Among the major food departments charted below, frozen saw substantial online gains—growing 16.7% from the comparable period in 2020 and 127.4% from 2019. Year-over-year online growth was driven by processed poultry (up 39%), appetizers and snack rolls (up 35.6%) and pies (up 13.9%).
On a two-year basis, however, the refrigerated department witnessed higher growth, reaching 139.7%. Growth was driven by creamers (up 260%), seafood (up 227.3%) and breakfast meats (up 193.8%).
Figure 6. Food & Beverage Departments: E-Commerce and Total Sales Growth, Four Weeks Ended September 5, 2021 (YoY and Yo2Y % Change) [caption id="attachment_133828" align="aligncenter" width="700"]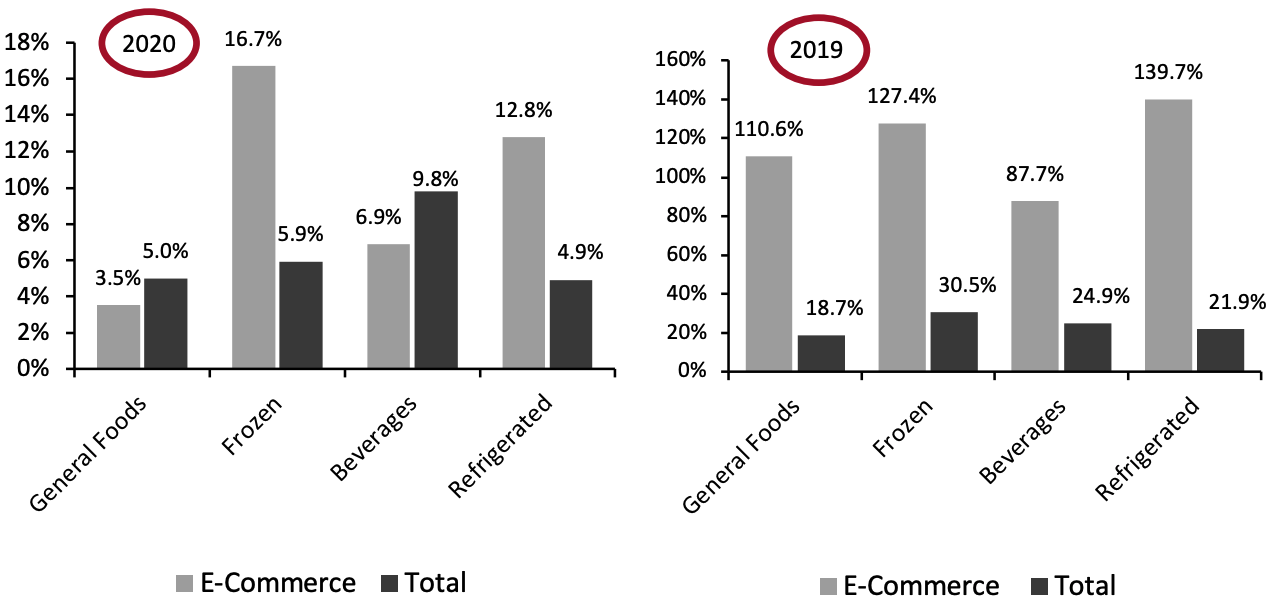 Source: IRI E-Market Insights™/Coresight Research[/caption]
5. Health Reports the Highest Online Growth Among Nonfood Departments
The health department observed the highest year-over-year online sales growth relative to other nonfood departments, recording 16.7% for the four weeks ended September 5, 2021. Growth was driven by sleeping remedies (up 54.8%), feminine needs (up 35.9%) and home health kits (up 33.5%).
Online sales of homecare products grew by only 11.0% year over year. However, compared to 2019, online sales grew significantly by 155.0% and total sales were up by 38.4%—both higher than other nonfood categories. The department is likely to see a renewed surge as concerns over Covid-19 rise in the US again.
Source: IRI E-Market Insights™/Coresight Research[/caption]
5. Health Reports the Highest Online Growth Among Nonfood Departments
The health department observed the highest year-over-year online sales growth relative to other nonfood departments, recording 16.7% for the four weeks ended September 5, 2021. Growth was driven by sleeping remedies (up 54.8%), feminine needs (up 35.9%) and home health kits (up 33.5%).
Online sales of homecare products grew by only 11.0% year over year. However, compared to 2019, online sales grew significantly by 155.0% and total sales were up by 38.4%—both higher than other nonfood categories. The department is likely to see a renewed surge as concerns over Covid-19 rise in the US again.
Figure 6. Nonfood Departments: E-Commerce and Total Sales Growth, Four Weeks Ended September 5, 2021 (YoY and Yo2Y % Change) [caption id="attachment_133829" align="aligncenter" width="700"]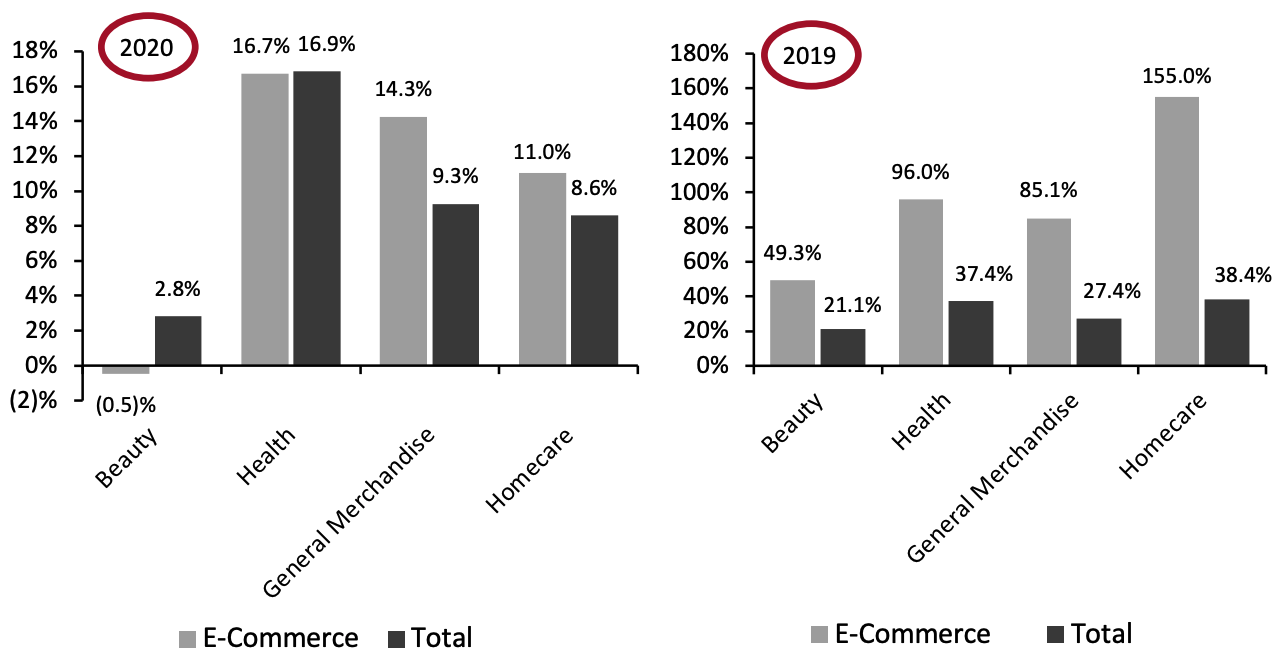 Source: IRI E-Market Insights™/Coresight Research[/caption]
What We Think
As the fear of a Covid-19 resurgence mounts, consumers’ avoidance of public places has increased. Coresight Research’s US Consumer Tracker on September 13, 2021, found that the avoidance rate for shopping centers/malls was up 5.4 percentage points from the prior week, while shops in general saw a rise of 2.8 percentage points.
As we head toward winter and the holiday season, with uncertainty remaining over the prospects for seasonal Covid-19 infections, we expect more consumers to avoid public places and stores for shopping—which could be exacerbated by a winter peak of coronavirus cases. We expect that increased avoidance will contribute to sustained strength in CPG e-commerce, and retailers and brands must be ready to flex their capacity to match online demand.
Source: IRI E-Market Insights™/Coresight Research[/caption]
What We Think
As the fear of a Covid-19 resurgence mounts, consumers’ avoidance of public places has increased. Coresight Research’s US Consumer Tracker on September 13, 2021, found that the avoidance rate for shopping centers/malls was up 5.4 percentage points from the prior week, while shops in general saw a rise of 2.8 percentage points.
As we head toward winter and the holiday season, with uncertainty remaining over the prospects for seasonal Covid-19 infections, we expect more consumers to avoid public places and stores for shopping—which could be exacerbated by a winter peak of coronavirus cases. We expect that increased avoidance will contribute to sustained strength in CPG e-commerce, and retailers and brands must be ready to flex their capacity to match online demand.
Figure 1. CPG E-Commerce and Total Sales Growth (YoY % Change) [caption id="attachment_133823" align="aligncenter" width="700"]
Historical data have been revised for the latest periodSource: IRI E-Market Insights™/Coresight Research[/caption] In relation to more consistent comparatives of 2019, online CPG growth showed a similar pattern: For the four weeks ended September 5, growth totaled 91.7%, but this represented a decrease of 4.6 percentage points from the previous period’s growth on a two-year basis.
Figure 2. CPG E-Commerce and Total Sales Growth (% Change from Two Years Prior) [caption id="attachment_133824" align="aligncenter" width="700"]
Historical data have been revised for the latest periodSource: IRI E-Market Insights™/Coresight Research [/caption] 2. General Merchandise & Homecare and Health & Beauty Witness Growth Deceleration General merchandise & homecare and health & beauty saw year-over-year growth trends soften for the second consecutive period, falling to 13.6% and 7.9%, respectively. However, online sales in both categories remain significantly elevated from 2019 levels. Online food & beverage sales stayed almost consistent versus the prior period, growing 7.2% year over year. It is worth noting that the food & beverage category continues to see high online growth relative to other categories, when compared on a two-year basis—rising by 113.6% in the latest period.
Figure 3. E-Commerce CPG Sales Growth, by Category Type (YoY % Change) [caption id="attachment_133825" align="aligncenter" width="700"]
Historical data have been revised in the latest periodSource: IRI E-Market Insights™/Coresight Research[/caption]
Figure 4. E-Commerce CPG Sales Growth, by Category Type (% Change from Two Years Prior) [caption id="attachment_133826" align="aligncenter" width="700"]
Historical data have been revised in the latest periodSource: IRI E-Market Insights™/Coresight Research[/caption] 3. Breakdown of Online CPG Sales: Food & Beverage Trending Upward Food & beverage’s online share is on an upward trend, reaching 34.5% for the four weeks ended September 5. Healthy & beauty picked up again to reach 34.1%, while the general merchandise & homecare share declined by 0.7 percentage points to reach 31.4%.
Figure 5. CPG E-Commerce: Breakdown of Sales Share by Category (%) [caption id="attachment_133827" align="aligncenter" width="700"]
Source: IRI E-Market Insights™/Coresight Research[/caption]
4. Frozen Food Outpaces Other Food Departments in Online Sales
Frozen food has been a popular department throughout the pandemic and continues to hold firm. Among the major food departments charted below, frozen saw substantial online gains—growing 16.7% from the comparable period in 2020 and 127.4% from 2019. Year-over-year online growth was driven by processed poultry (up 39%), appetizers and snack rolls (up 35.6%) and pies (up 13.9%).
On a two-year basis, however, the refrigerated department witnessed higher growth, reaching 139.7%. Growth was driven by creamers (up 260%), seafood (up 227.3%) and breakfast meats (up 193.8%).
Figure 6. Food & Beverage Departments: E-Commerce and Total Sales Growth, Four Weeks Ended September 5, 2021 (YoY and Yo2Y % Change) [caption id="attachment_133828" align="aligncenter" width="700"]
Source: IRI E-Market Insights™/Coresight Research[/caption]
5. Health Reports the Highest Online Growth Among Nonfood Departments
The health department observed the highest year-over-year online sales growth relative to other nonfood departments, recording 16.7% for the four weeks ended September 5, 2021. Growth was driven by sleeping remedies (up 54.8%), feminine needs (up 35.9%) and home health kits (up 33.5%).
Online sales of homecare products grew by only 11.0% year over year. However, compared to 2019, online sales grew significantly by 155.0% and total sales were up by 38.4%—both higher than other nonfood categories. The department is likely to see a renewed surge as concerns over Covid-19 rise in the US again.
Figure 6. Nonfood Departments: E-Commerce and Total Sales Growth, Four Weeks Ended September 5, 2021 (YoY and Yo2Y % Change) [caption id="attachment_133829" align="aligncenter" width="700"]
Source: IRI E-Market Insights™/Coresight Research[/caption]
What We Think
As the fear of a Covid-19 resurgence mounts, consumers’ avoidance of public places has increased. Coresight Research’s US Consumer Tracker on September 13, 2021, found that the avoidance rate for shopping centers/malls was up 5.4 percentage points from the prior week, while shops in general saw a rise of 2.8 percentage points.
As we head toward winter and the holiday season, with uncertainty remaining over the prospects for seasonal Covid-19 infections, we expect more consumers to avoid public places and stores for shopping—which could be exacerbated by a winter peak of coronavirus cases. We expect that increased avoidance will contribute to sustained strength in CPG e-commerce, and retailers and brands must be ready to flex their capacity to match online demand.
IRI Disclaimer: The information contained herein is based in part on data reported by the IRI E-Market Insights™ solution and as interpreted solely by Coresight Research. The information is believed to be reliable at the time supplied by IRI but is neither all-inclusive nor guaranteed by IRI or Coresight Research, Inc. Without limiting the generality of the foregoing, specific data points may vary considerably from other information sources. Any opinion expressed herein reflect the judgement of Coresight Research, Inc. and are subject to change. IRI disclaims liability of any kind arising from the use of this information.