Nitheesh NH
The Coresight Research and IRI monthly US CPG Sales Tracker provides our data-driven insights into online sales trends in the US CPG industry—covering the product categories of food & beverage; health & beauty; and general merchandise & homecare. In this report, we present five key insights into the four weeks ended August 8, 2021.
1. Online CPG Growth Dips, Following Growth Reported for Previous Two Periods
CPG e-commerce grew by 12.8% for the four weeks ended August 8, 2021—decelerating from the 25.7% growth reported in the previous period.
The channel witnessed strong growth averaging approximately 25.1% over the prior two consecutive periods, likely driven by the spread of Covid-19 Delta variant as consumers turn away from physical stores. The dip in online retail sales growth for the four weeks ended August 8, 2021, can be partly attributed to the annualization of pandemic spending patterns. Last year, during the four weeks ended August 9, 2020, total e-commerce CPG sales reported staggering year-over-year growth of 74.0%.
Figure 1. CPG E-Commerce and Total Sales Growth (YoY % Change) [caption id="attachment_132609" align="aligncenter" width="725"]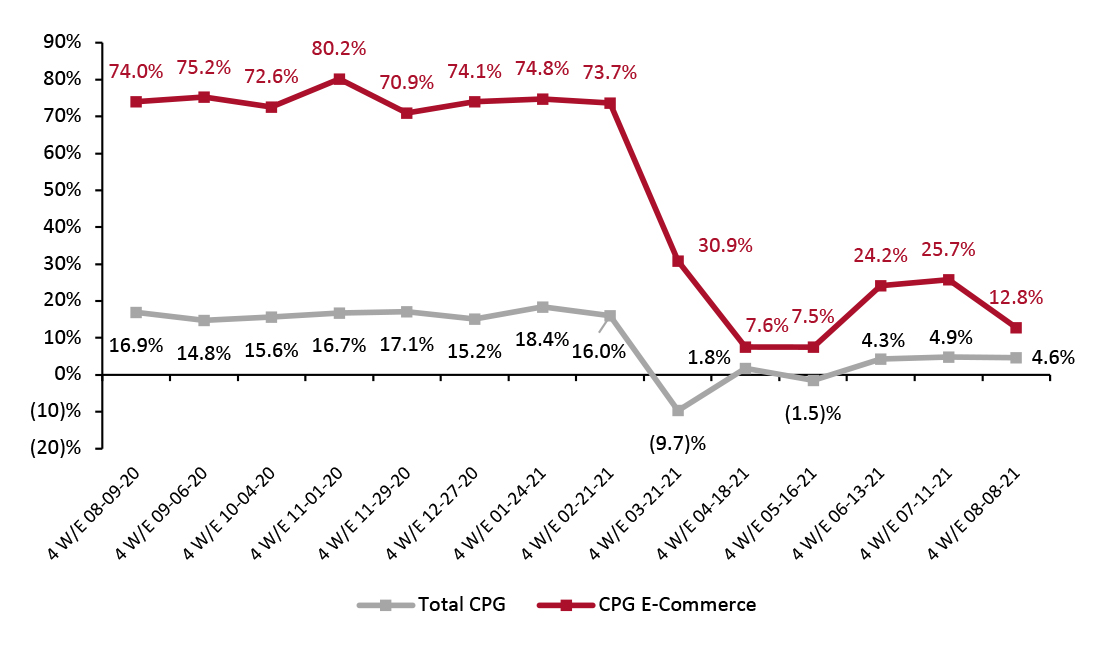 Historical data have been revised for the latest period
Source: IRI E-Market Insights™/Coresight Research[/caption] Comparing CPG e-commerce sales to the same period in 2019 shows strong positive growth of 96.3% for the four weeks ended August 8, 2021: Online CPG sales have almost doubled compared to pre-pandemic levels.
Figure 2. CPG E-Commerce and Total Sales Growth (% Change from Two Years Prior) [caption id="attachment_132550" align="aligncenter" width="700"]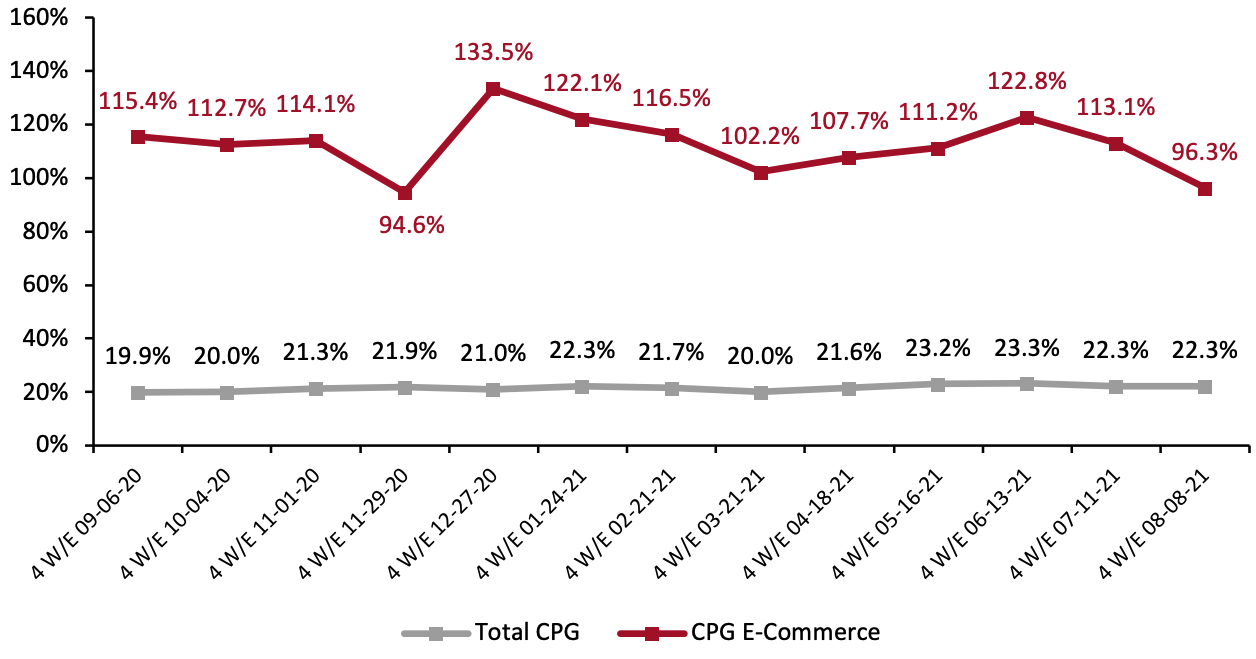 Historical data have been revised for the latest period
Source: IRI E-Market Insights™/Coresight Research[/caption] 2. All Three Categories Witnessed Deceleration in E-Commerce Sales Growth Year-over-year growth of online food & beverage sales was 6.5 percentage points lower in the four weeks ended August 8, 2021, compared to the previous period. Nevertheless, we expect online sales to accelerate in the coming months, due to rising Covid-19 cases in the US caused by the Delta variant. According to Healthline data, new US Covid-19 cases have reached 150,000 per day, as of August 31, 2021—the highest level since January. Coresight Research’s US Consumer Tracker survey conducted on August 16, 2021, revealed a downward trend in the proportion of US consumers visiting shopping centers—having fallen by 9.2 percentage points from the peak on June 28, 2021. In the long run, we expect that online sales of CPG products will witness solid growth in 2022 and beyond, due to pandemic-induced channel stickiness. The health & beauty category witnessed year-over-year growth of 12.3% (declining by 12.7 percentage points compared to the previous period), and sales growth totaled 66.7% on a two-year basis (compared to pre-pandemic 2019)—down from 78.7% in the previous period. General merchandise & homecare’s year-over-year growth also decelerated, by more than 20 percentage points—to 20.5% from 42.3% growth in the prior period.
Figure 3. E-Commerce CPG Sales Growth, by Category Type (YoY % Change) [caption id="attachment_132551" align="aligncenter" width="700"]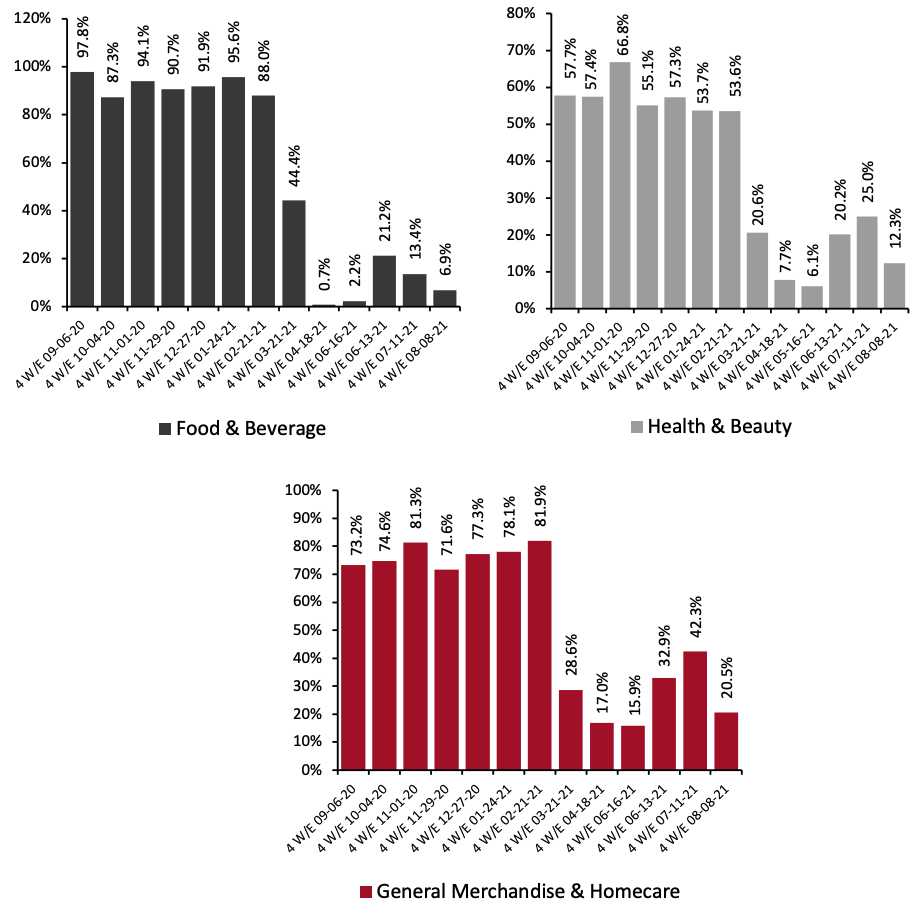 Historical data have been revised in the latest period
Source: IRI E-Market Insights™/Coresight Research[/caption]
Figure 4. E-Commerce CPG Sales Growth, by Category Type (% Change from Two Years Prior) [caption id="attachment_132552" align="aligncenter" width="700"]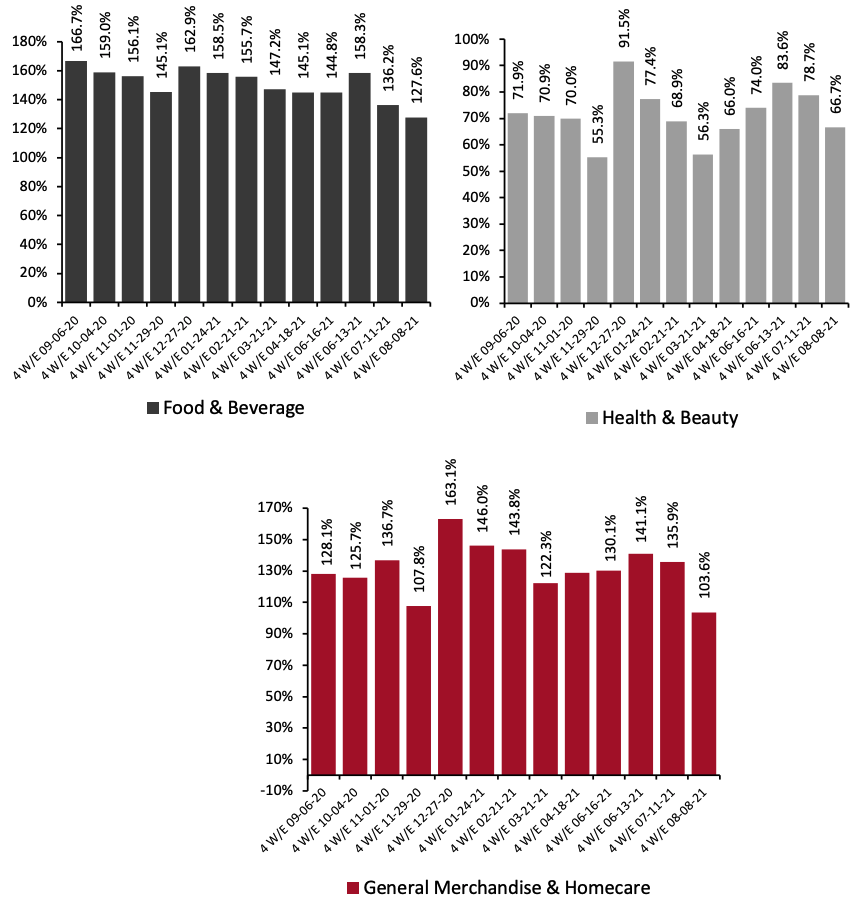 Historical data have been revised in the latest period
Source: IRI E-Market Insights™/Coresight Research[/caption] 3. Breakdown of Online CPG Sales: Food & Beverage Improves Slightly Food & beverage’s share of total e-commerce sales improved slightly from the prior period, to 34.5% during the four weeks ended August 8, 2021, following a marginal 2.0-percentage-point decline in the previous period. Health & beauty and general merchandise and homecare saw slight dips in their shares of online sales, by 0.3 percentage points and 0.6 percentage points, respectively.
Figure 5. CPG E-Commerce: Breakdown of Sales Share by Category (%) [caption id="attachment_132553" align="aligncenter" width="700"]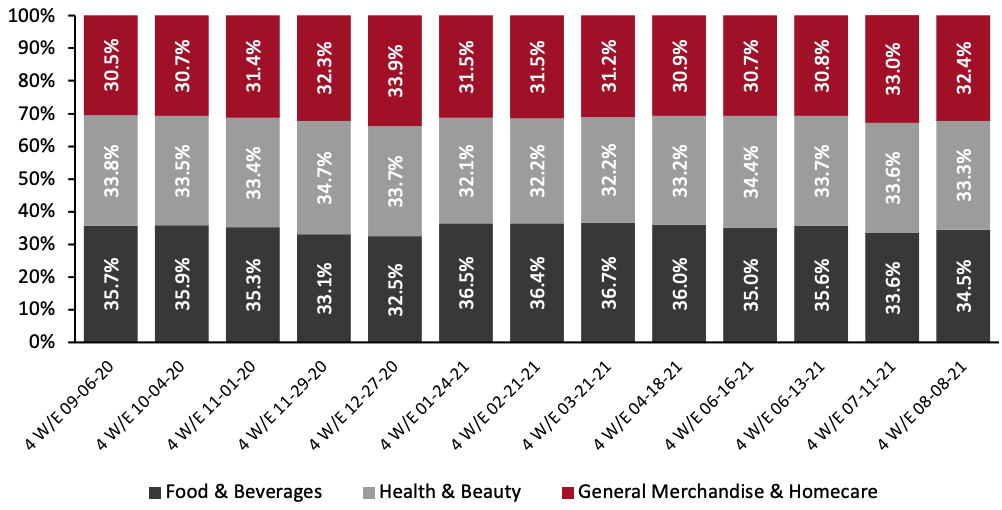 Source: IRI E-Market Insights™/Coresight Research[/caption]
4. Beverage Department Continues To Outperform Other Food Departments in Online Sales
The beverage department reported the highest year-over-year online sales growth of all departments, totaling 11.7%. It saw 112.0% growth on a two-year basis. Growth was driven by nonfruit drinks (up 57.7%), instant tea mixes (up 32.7%) and energy drinks (up 22.7%).
Online sales of refrigerated food grew by just 2.9% year over year—partly due to the annualization of strong comparatives from 2020, when lockdown restrictions caused a surge in sales. Compared to 2019, the category saw the highest online sales growth of all departments, at 172.5%.
Source: IRI E-Market Insights™/Coresight Research[/caption]
4. Beverage Department Continues To Outperform Other Food Departments in Online Sales
The beverage department reported the highest year-over-year online sales growth of all departments, totaling 11.7%. It saw 112.0% growth on a two-year basis. Growth was driven by nonfruit drinks (up 57.7%), instant tea mixes (up 32.7%) and energy drinks (up 22.7%).
Online sales of refrigerated food grew by just 2.9% year over year—partly due to the annualization of strong comparatives from 2020, when lockdown restrictions caused a surge in sales. Compared to 2019, the category saw the highest online sales growth of all departments, at 172.5%.
Figure 6. Food & Beverage Departments: E-Commerce and Total Sales Growth, Four Weeks Ended August 8, 2021 (YoY and Yo2Y % Change) [caption id="attachment_132610" align="aligncenter" width="725"]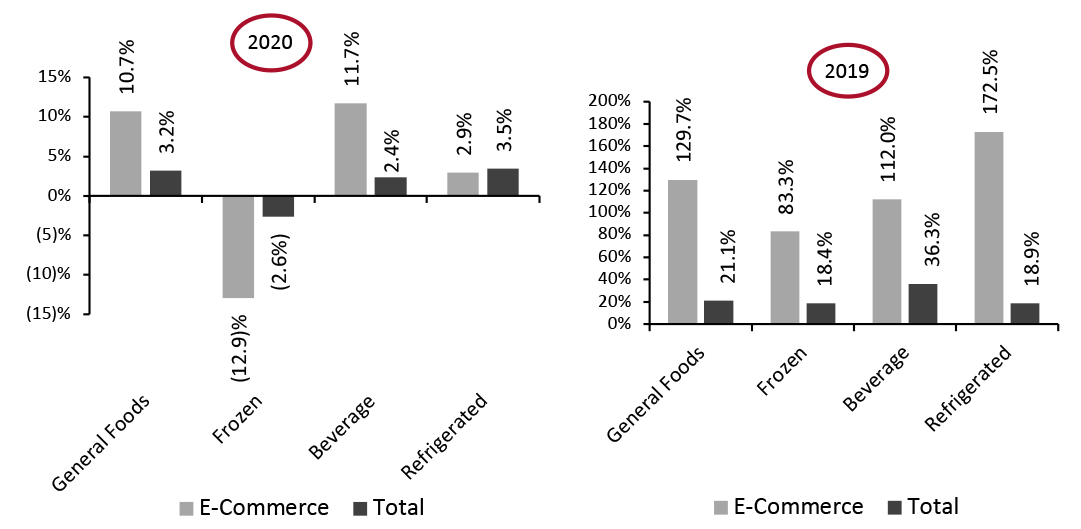 Source: IRI E-Market Insights™/Coresight Research[/caption]
5. General Merchandise Reports the Highest Online Growth Among Nonfood Departments
The general merchandise department witnessed the highest year-over-year online sales growth relative to other nonfood departments, of 22.1%. Growth was driven by writing instruments (up 255.3%), office products (up 92.3%) and candles (up 55.9%).
Online sales growth of homecare products decelerated to 13.8% year over year. However, compared to 2019, online sales grew significantly, by 131.1%. Total homecare sales were up 32.1%.
Source: IRI E-Market Insights™/Coresight Research[/caption]
5. General Merchandise Reports the Highest Online Growth Among Nonfood Departments
The general merchandise department witnessed the highest year-over-year online sales growth relative to other nonfood departments, of 22.1%. Growth was driven by writing instruments (up 255.3%), office products (up 92.3%) and candles (up 55.9%).
Online sales growth of homecare products decelerated to 13.8% year over year. However, compared to 2019, online sales grew significantly, by 131.1%. Total homecare sales were up 32.1%.
Figure 7. Nonfood Departments: E-Commerce and Total Sales Growth, Four Weeks Ended August 8, 2021 (YoY and Yo2Y % Change) [caption id="attachment_132557" align="aligncenter" width="700"]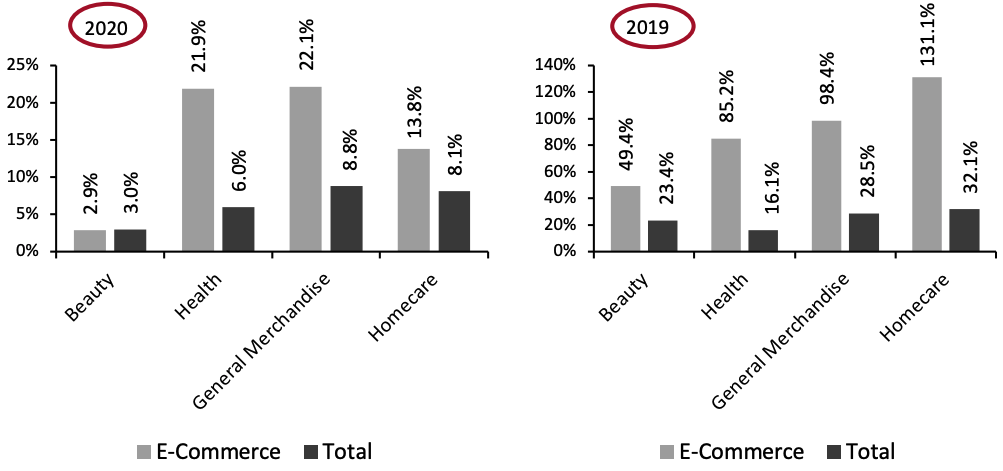 Source: IRI E-Market Insights™/Coresight Research[/caption]
What We Think
CPG e-commerce growth has slowed against tough year-over-year comparatives but remains positive even after consumers’ gradual return to in-store shopping—with growth still in the double-digit percentage range for the four weeks ended August 8, 2021.
As Covid-19 in the US has resurged to more than 150,000 new cases per day as of August 31, 2021, there may be more lockdowns in the near future. We therefore expect online food & beverage sales to witness growth during the fourth quarter of 2021. It is imperative that US brands and retailers are prepared for the potential impacts of lockdowns on consumer behavior—such as consumers stockpiling groceries. CPG companies and retailers need to leverage lessons learned from last year and be able to quickly adapt.
Source: IRI E-Market Insights™/Coresight Research[/caption]
What We Think
CPG e-commerce growth has slowed against tough year-over-year comparatives but remains positive even after consumers’ gradual return to in-store shopping—with growth still in the double-digit percentage range for the four weeks ended August 8, 2021.
As Covid-19 in the US has resurged to more than 150,000 new cases per day as of August 31, 2021, there may be more lockdowns in the near future. We therefore expect online food & beverage sales to witness growth during the fourth quarter of 2021. It is imperative that US brands and retailers are prepared for the potential impacts of lockdowns on consumer behavior—such as consumers stockpiling groceries. CPG companies and retailers need to leverage lessons learned from last year and be able to quickly adapt.
Figure 1. CPG E-Commerce and Total Sales Growth (YoY % Change) [caption id="attachment_132609" align="aligncenter" width="725"]
Source: IRI E-Market Insights™/Coresight Research[/caption] Comparing CPG e-commerce sales to the same period in 2019 shows strong positive growth of 96.3% for the four weeks ended August 8, 2021: Online CPG sales have almost doubled compared to pre-pandemic levels.
Figure 2. CPG E-Commerce and Total Sales Growth (% Change from Two Years Prior) [caption id="attachment_132550" align="aligncenter" width="700"]
Historical data have been revised for the latest periodSource: IRI E-Market Insights™/Coresight Research[/caption] 2. All Three Categories Witnessed Deceleration in E-Commerce Sales Growth Year-over-year growth of online food & beverage sales was 6.5 percentage points lower in the four weeks ended August 8, 2021, compared to the previous period. Nevertheless, we expect online sales to accelerate in the coming months, due to rising Covid-19 cases in the US caused by the Delta variant. According to Healthline data, new US Covid-19 cases have reached 150,000 per day, as of August 31, 2021—the highest level since January. Coresight Research’s US Consumer Tracker survey conducted on August 16, 2021, revealed a downward trend in the proportion of US consumers visiting shopping centers—having fallen by 9.2 percentage points from the peak on June 28, 2021. In the long run, we expect that online sales of CPG products will witness solid growth in 2022 and beyond, due to pandemic-induced channel stickiness. The health & beauty category witnessed year-over-year growth of 12.3% (declining by 12.7 percentage points compared to the previous period), and sales growth totaled 66.7% on a two-year basis (compared to pre-pandemic 2019)—down from 78.7% in the previous period. General merchandise & homecare’s year-over-year growth also decelerated, by more than 20 percentage points—to 20.5% from 42.3% growth in the prior period.
Figure 3. E-Commerce CPG Sales Growth, by Category Type (YoY % Change) [caption id="attachment_132551" align="aligncenter" width="700"]
Historical data have been revised in the latest periodSource: IRI E-Market Insights™/Coresight Research[/caption]
Figure 4. E-Commerce CPG Sales Growth, by Category Type (% Change from Two Years Prior) [caption id="attachment_132552" align="aligncenter" width="700"]
Historical data have been revised in the latest periodSource: IRI E-Market Insights™/Coresight Research[/caption] 3. Breakdown of Online CPG Sales: Food & Beverage Improves Slightly Food & beverage’s share of total e-commerce sales improved slightly from the prior period, to 34.5% during the four weeks ended August 8, 2021, following a marginal 2.0-percentage-point decline in the previous period. Health & beauty and general merchandise and homecare saw slight dips in their shares of online sales, by 0.3 percentage points and 0.6 percentage points, respectively.
Figure 5. CPG E-Commerce: Breakdown of Sales Share by Category (%) [caption id="attachment_132553" align="aligncenter" width="700"]
Source: IRI E-Market Insights™/Coresight Research[/caption]
4. Beverage Department Continues To Outperform Other Food Departments in Online Sales
The beverage department reported the highest year-over-year online sales growth of all departments, totaling 11.7%. It saw 112.0% growth on a two-year basis. Growth was driven by nonfruit drinks (up 57.7%), instant tea mixes (up 32.7%) and energy drinks (up 22.7%).
Online sales of refrigerated food grew by just 2.9% year over year—partly due to the annualization of strong comparatives from 2020, when lockdown restrictions caused a surge in sales. Compared to 2019, the category saw the highest online sales growth of all departments, at 172.5%.
Figure 6. Food & Beverage Departments: E-Commerce and Total Sales Growth, Four Weeks Ended August 8, 2021 (YoY and Yo2Y % Change) [caption id="attachment_132610" align="aligncenter" width="725"]
Figure 7. Nonfood Departments: E-Commerce and Total Sales Growth, Four Weeks Ended August 8, 2021 (YoY and Yo2Y % Change) [caption id="attachment_132557" align="aligncenter" width="700"]
Source: IRI E-Market Insights™/Coresight Research[/caption]
What We Think
CPG e-commerce growth has slowed against tough year-over-year comparatives but remains positive even after consumers’ gradual return to in-store shopping—with growth still in the double-digit percentage range for the four weeks ended August 8, 2021.
As Covid-19 in the US has resurged to more than 150,000 new cases per day as of August 31, 2021, there may be more lockdowns in the near future. We therefore expect online food & beverage sales to witness growth during the fourth quarter of 2021. It is imperative that US brands and retailers are prepared for the potential impacts of lockdowns on consumer behavior—such as consumers stockpiling groceries. CPG companies and retailers need to leverage lessons learned from last year and be able to quickly adapt.
IRI Disclaimer: The information contained herein is based in part on data reported by the IRI E-Market Insights™ solution and as interpreted solely by Coresight Research. The information is believed to be reliable at the time supplied by IRI but is neither all-inclusive nor guaranteed by IRI or Coresight Research, Inc. Without limiting the generality of the foregoing, specific data points may vary considerably from other information sources. Any opinion expressed herein reflect the judgement of Coresight Research, Inc. and are subject to change. IRI disclaims liability of any kind arising from the use of this information.