Nitheesh NH
US CPG Sales Tracker: Coresight Research x IRI Analysis
The Coresight Research and IRI monthly US CPG Sales Tracker presents data-driven insights into online sales trends in the US CPG industry—covering the product categories of food & beverage, health & beauty, and general merchandise & homecare. In this report, we present five key insights for the four weeks ended March 20, 2022. 1. Online CPG Growth Jumps to High-Teens Growth CPG e-commerce growth rose to 19.5% in March 2022, the first deviation from this year’s steady mid-teens growth rate, reflecting the continual easing of comparatives from one year earlier. We expect e-commerce year-over-year growth rates to accelerate in April as comparatives weaken further. The two-year stack for e-commerce stands at 48.7% in March 2022—down from an 84.8% two-year stack in February—but still points toward strong growth overall. In contrast, total growth has slowed slightly this period—down to 7.5% year over year from 7.7% in February—but still retains stable with single digit growth.Figure 1. CPG E-Commerce and Total Sales Growth (YoY % Change) [caption id="attachment_147227" align="aligncenter" width="700"]
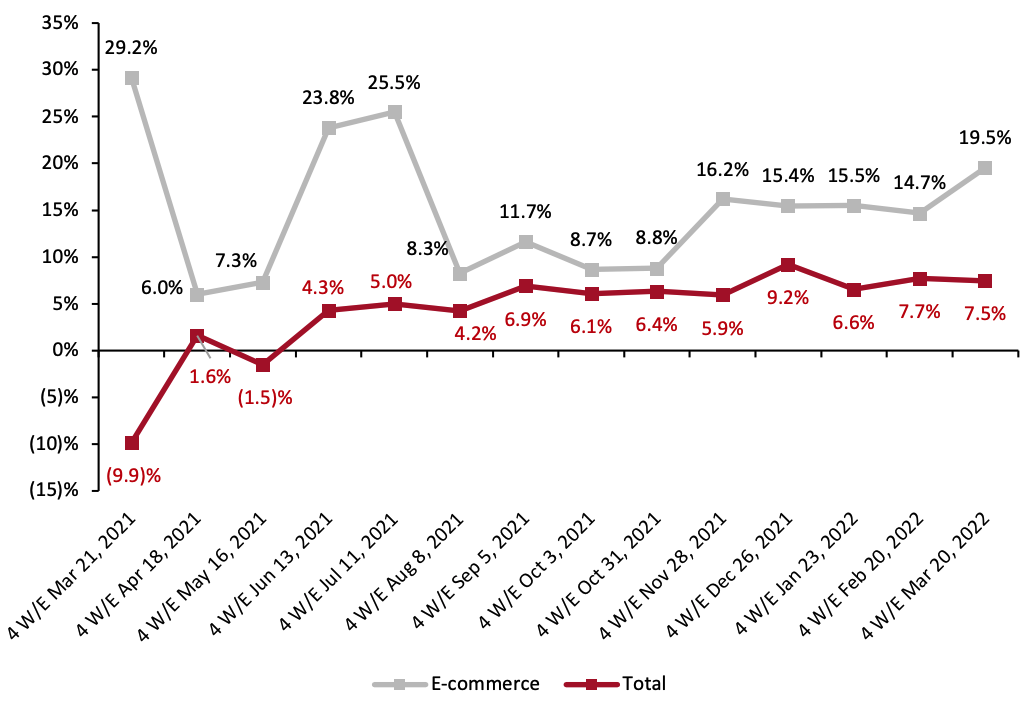 Historical data have been revised for the latest period
Source: IRI E-Market Insights™/Coresight Research[/caption] 2. Strong Growth Continues in All Three Categories We break down the online CPG market into three major categories: food & beverage, health & beauty, and general merchandise & homecare. All categories’ growth accelerated this period, reaching 10.2%, 28.0% and 21.9% year over year, respectively. Of the three categories, health & beauty’s growth saw the largest increase from the last period, up 7.5 percentage points from 20.5% in February. Meanwhile, food & beverage and general merchandise & homecare grew 3.1 and 4.1 percentage points, respectively.
Figure 2. E-Commerce CPG Sales Growth by Category Type (YoY % Change) [caption id="attachment_145927" align="aligncenter" width="700"]
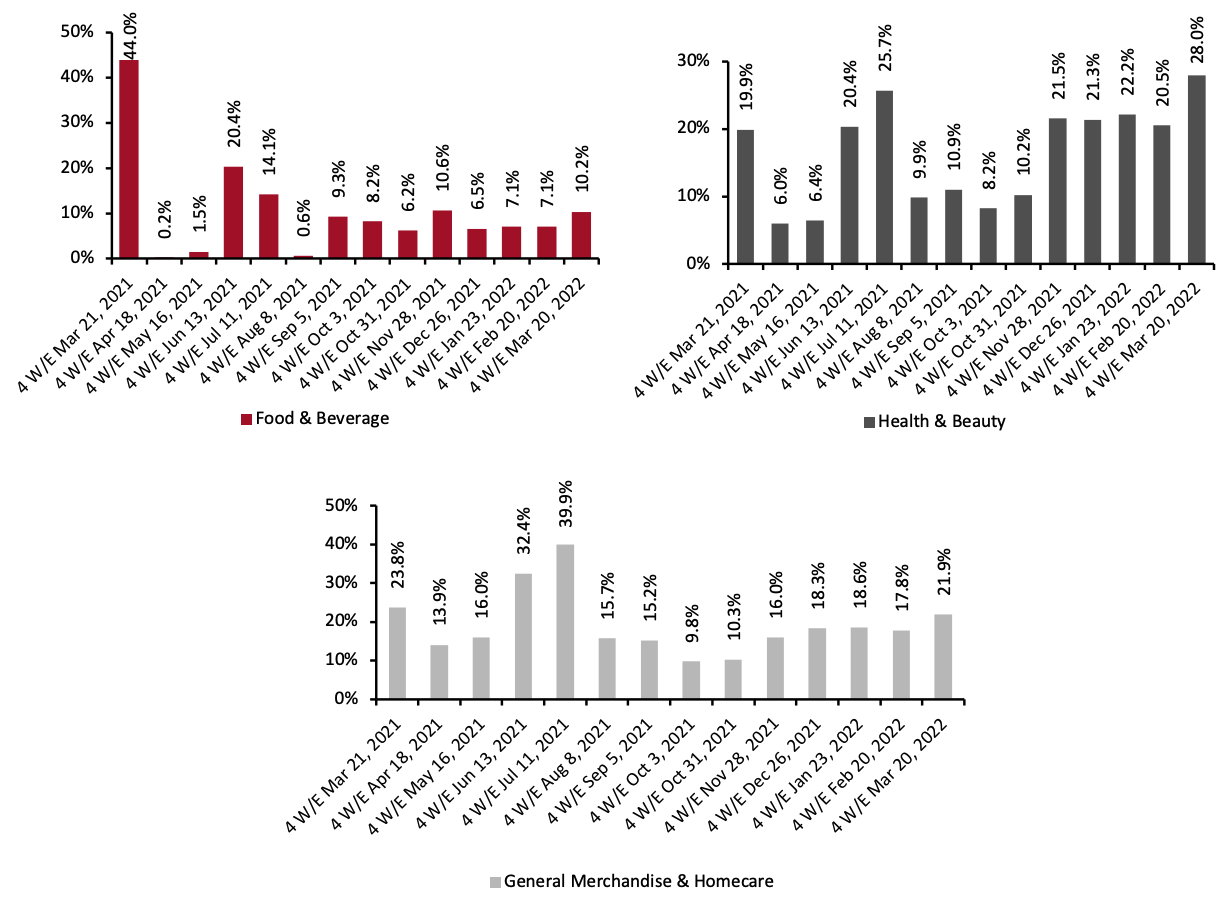 Historical data have been revised in the latest period
Source: IRI E-Market Insights™/Coresight Research[/caption] 3. Breakdown of Online CPG Sales: Food & Beverage Share Increases for Second Consecutive Month In Figure 3, we break down online CPG sales by category. In the four weeks ended March 20, 2022, the general merchandise & homecare and health & beauty categories rose by 0.2 and 0.3 percentage points to 31.0% and 34.7%, respectively. Meanwhile, food & beverage declined by 0.5 percentage points to 34.3%, the first decline in market share this year.
Figure 3. CPG E-Commerce: Breakdown of Sales Share by Category (%) [caption id="attachment_146121" align="aligncenter" width="701"]
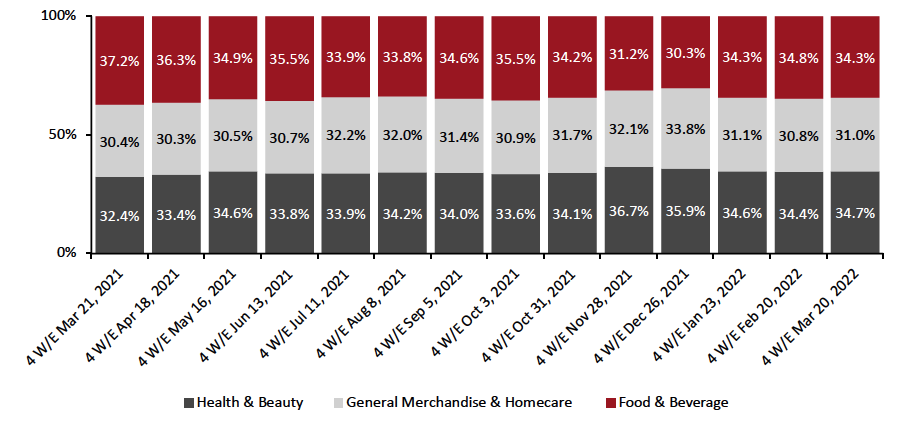 Source: IRI E-Market Insights™/Coresight Research[/caption]
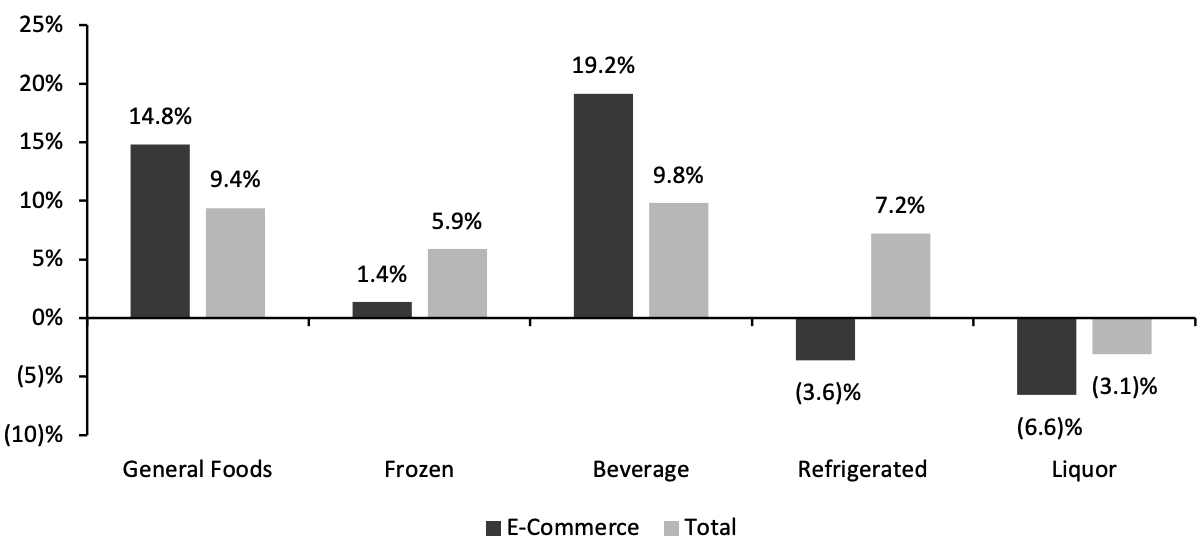
4. Beverage Outpaces Other Food Departments in Online and Total Sales
The beverage department reported the highest year-over-year online and total sales growth rates, at 19.2% and 9.8%, respectively. Year-over-year growth was driven by increases in sales of milk flavoring/cocoa mixes (up 58.8%), instant tea mixes (up 50.7%) and sports drinks (up 28.8%).
Source: IRI E-Market Insights™/Coresight Research[/caption]
4. Beverage Outpaces Other Food Departments in Online and Total Sales
The beverage department reported the highest year-over-year online and total sales growth rates, at 19.2% and 9.8%, respectively. Year-over-year growth was driven by increases in sales of milk flavoring/cocoa mixes (up 58.8%), instant tea mixes (up 50.7%) and sports drinks (up 28.8%).
Figure 4. Food & Beverage Departments: E-Commerce and Total Sales Growth, Four Weeks Ended March 20, 2022 (YoY % Change) [caption id="attachment_145929" align="aligncenter" width="700"]
 Source: IRI E-Market Insights™/Coresight Research[/caption]
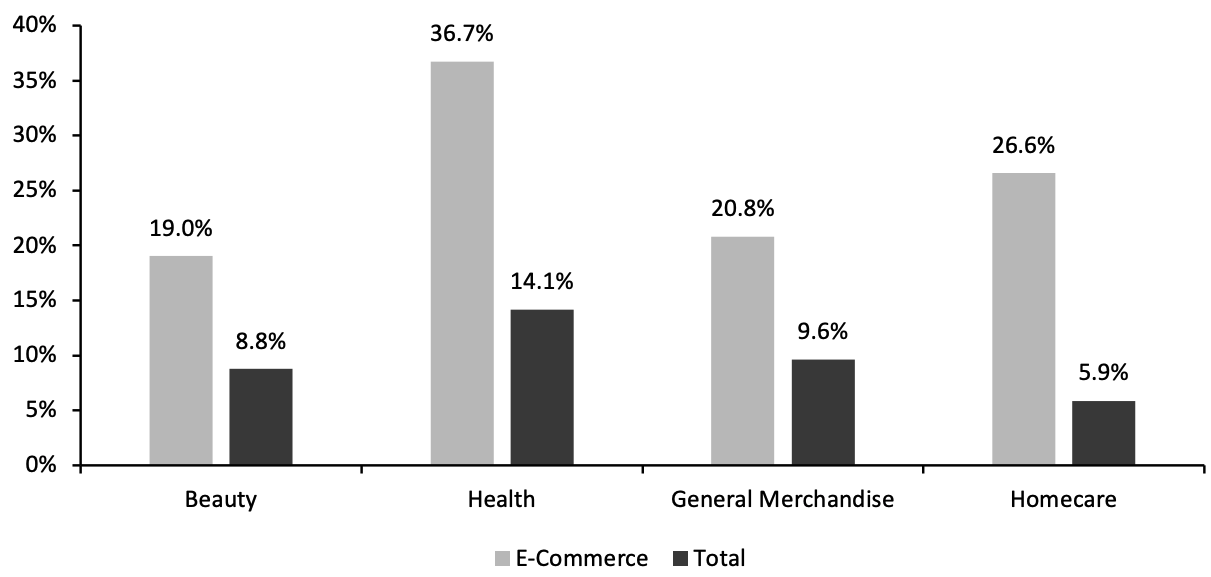
5. Health Leads Online Growth Among Nonfood Departments
The health department saw the highest year-over-year online and total sales growth among nonfood departments in the four weeks ended March 20, 2022, reaching 36.7% and 14.1% year-over-year growth, respectively. Growth in health e-commerce was driven by home healthcare/kits (up 89.0%), external analgesic rubs (up 67.1%) and toothpaste (up 64.0%).
Source: IRI E-Market Insights™/Coresight Research[/caption]
5. Health Leads Online Growth Among Nonfood Departments
The health department saw the highest year-over-year online and total sales growth among nonfood departments in the four weeks ended March 20, 2022, reaching 36.7% and 14.1% year-over-year growth, respectively. Growth in health e-commerce was driven by home healthcare/kits (up 89.0%), external analgesic rubs (up 67.1%) and toothpaste (up 64.0%).
Figure 5. Nonfood Departments: E-Commerce and Total Sales Growth, Four Weeks Ended March 20, 2022 (YoY % Change) [caption id="attachment_145930" align="aligncenter" width="700"]
 Source: IRI E-Market Insights™/Coresight Research[/caption]
What We Think
E-commerce CPG rose to high-teens year-over-year growth this period, and we expect it to continue to grow in the coming months due to increasingly weaker comparatives in April. CPG e-commerce grew across all three categories this period, buoyed by weaker comparatives from March 2021. The increase in online food & beverage sales was slower than that of the other two categories this period, resulting in a slight decrease in the category’s market share.IRI Disclaimer: The information contained herein is based in part on data reported by the IRI E-Market Insights™ solution and as interpreted solely by Coresight Research. The information is believed to be reliable at the time supplied by IRI but is neither all-inclusive nor guaranteed by IRI or Coresight Research, Inc. Without limiting the generality of the foregoing, specific data points may vary considerably from other information sources. Any opinions expressed herein reflect the judgement of Coresight Research, Inc. and are subject to change. IRI disclaims liability of any kind arising from the use of this information.