Nitheesh NH
The Coresight Research and IRI monthly US CPG Sales Tracker provides our data-driven insights into online sales trends in the US CPG industry—covering the product categories of food & beverage; health & beauty; and general merchandise & homecare. In this report, we present five key insights into the four weeks ended June 13, 2021.
1. Online CPG Growth Re-Accelerates
The online CPG channel has re-accelerated in the latest period after contracting for three consecutive months. The previous slowdown can be partly attributed to the annualization of pandemic spending patterns. Online CPG sales grew 11.4% for the four weeks ended June 13, compared to 3.1% growth for the four weeks ended May 16.
Figure 1. CPG E-Commerce and Total Sales Growth (YoY % Change) [caption id="attachment_131061" align="aligncenter" width="700"]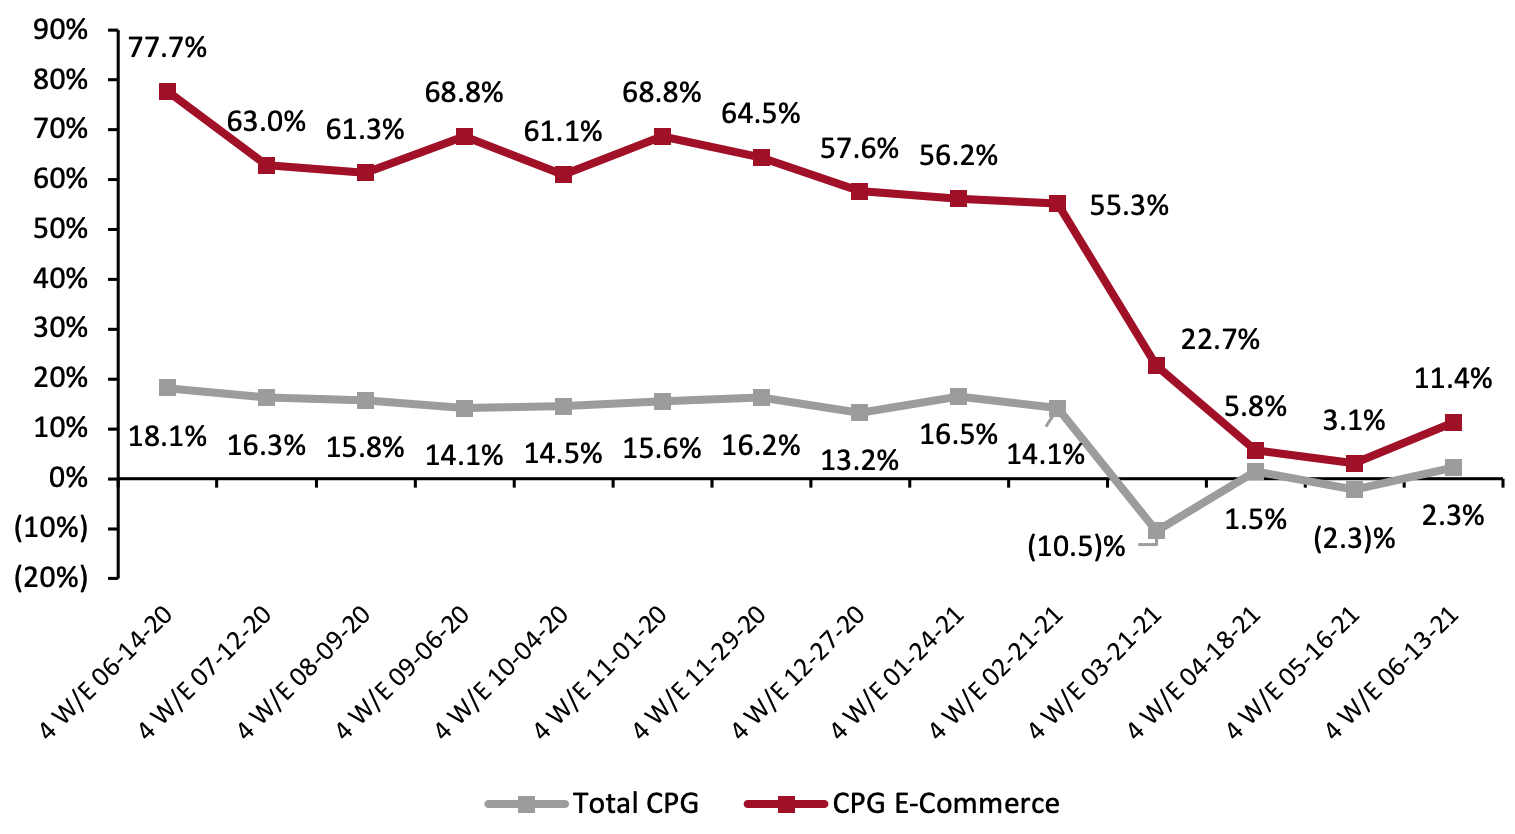 Historical data have been revised for the latest period
Source: IRI E-Market Insights™/Coresight Research[/caption] Compared to the same period in 2019, CPG e-commerce sales have shown strong, positive growth for the four weeks ended June 13, 2021, with sales almost doubling.
Figure 2. CPG E-Commerce and Total Sales Growth (% Change from Two Years Prior) [caption id="attachment_131062" align="aligncenter" width="700"]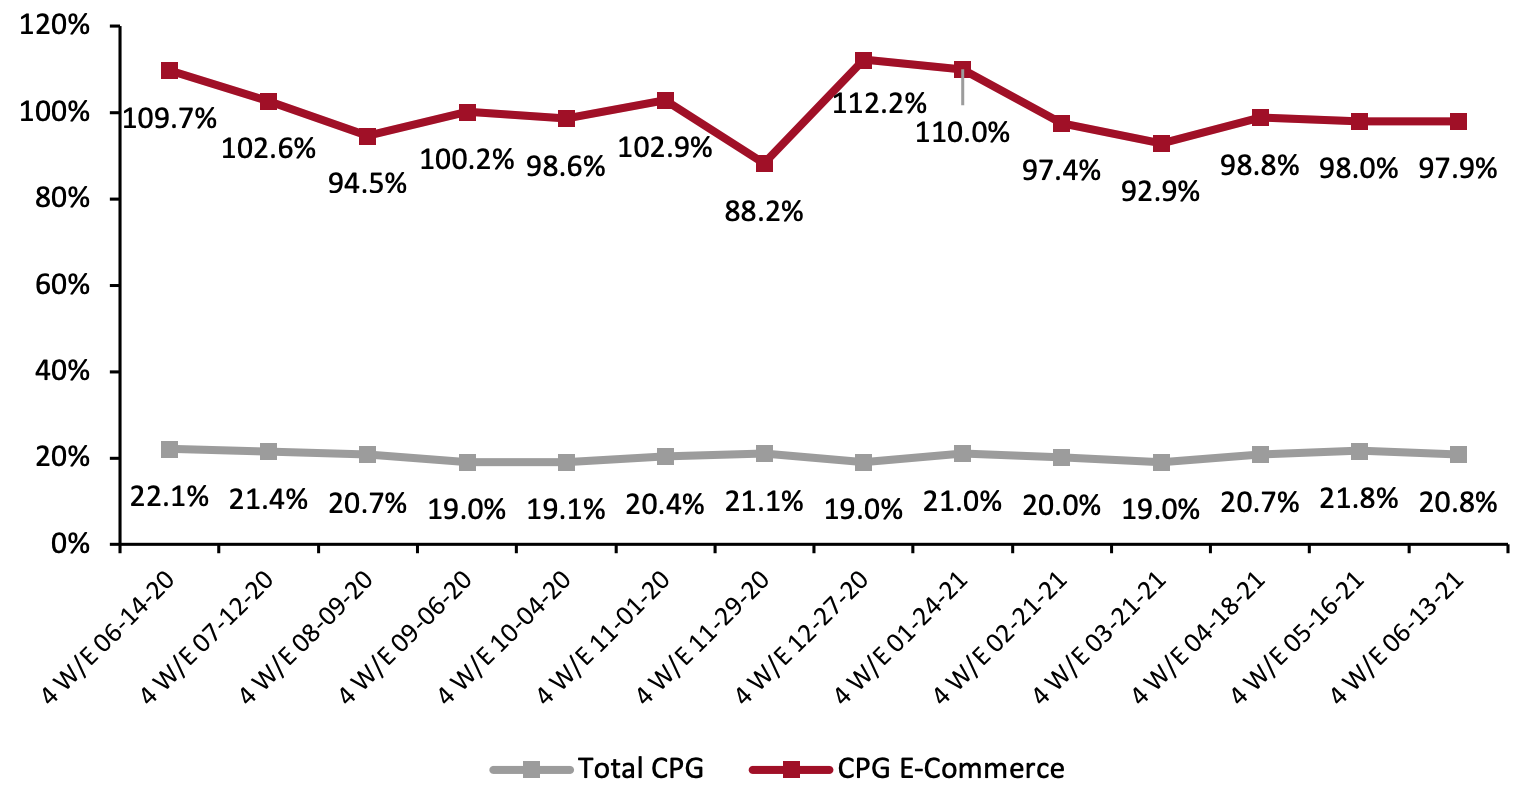 Historical data have been revised for the latest period
Source: IRI E-Market Insights™/Coresight Research[/caption] 2. Food & Beverage Online Sales Experience an Uptick Online food & beverage sales saw growth of 13.8% for the period ended June 13, 2021, compared to 0.9% in the prior period. Relative to other categories, it continues to see high online growth compared to 2019, soaring by 123.4%—indicating that the channel has retained its appeal with consumers. Both general merchandise & homecare and health & beauty have seen sales rise again after a spell of softening growth. On a two-year basis, general merchandise & homecare saw significant growth of 108.2% in the latest period, while health & beauty grew by 76.1%.
Figure 3. E-Commerce CPG Sales Growth, by Category Type (YoY % Change) [caption id="attachment_131063" align="aligncenter" width="700"]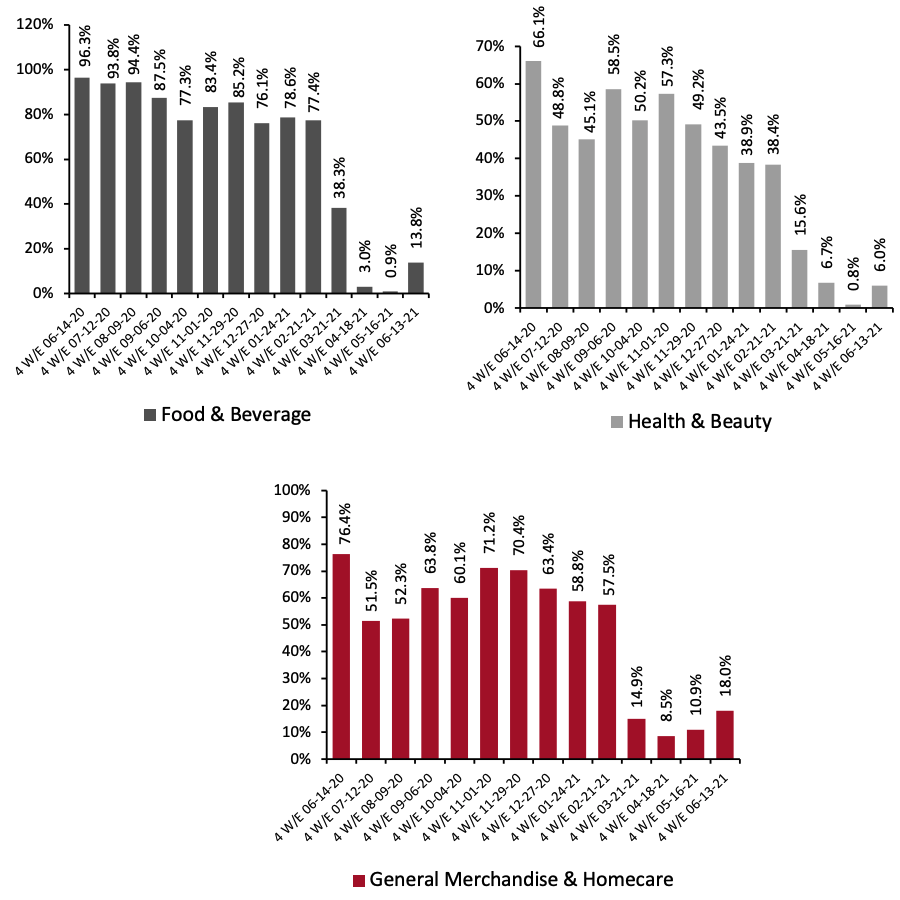 Historical data have been revised in the latest period
Source: IRI E-Market Insights™/Coresight Research[/caption]
Figure 4. E-Commerce CPG Sales Growth, by Category Type (% Change from Two Years Prior) [caption id="attachment_131064" align="aligncenter" width="700"]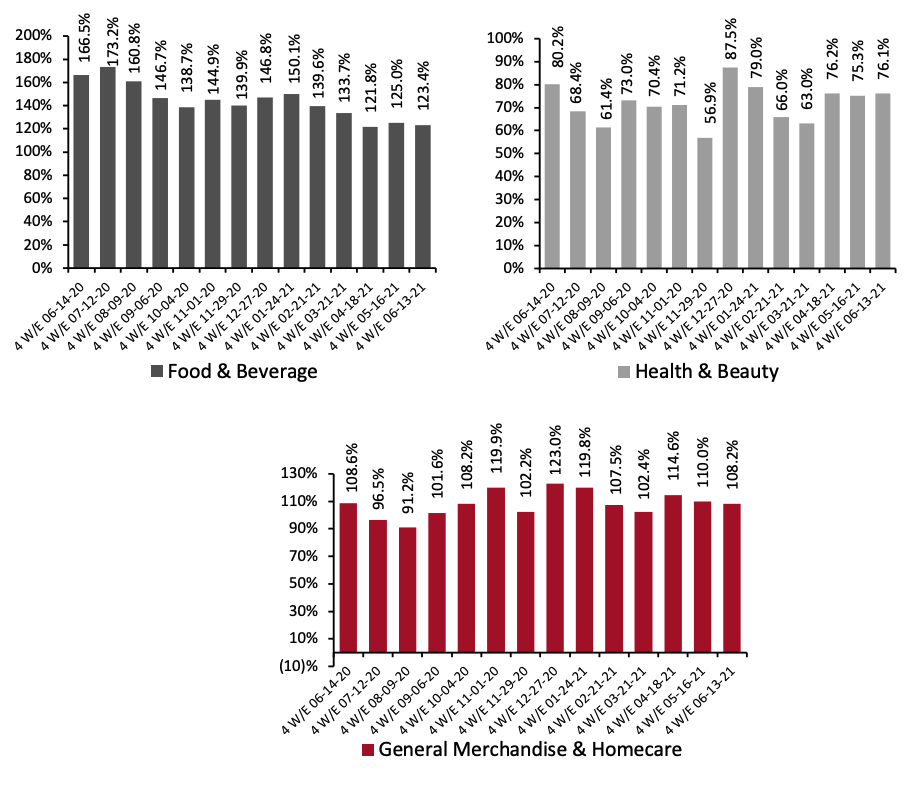 Historical data have been revised in the latest period
Source: IRI E-Market Insights™/Coresight Research[/caption] 3. Breakdown of Online CPG Sales: Health & Beauty and General Merchandise & Homecare See Marginal Decrease Health & beauty’s share declined by 0.5 percentage points to hit 41.6% for the four weeks ended June 13, 2021. General merchandise & homecare also declined slightly to 23.6%, while food & beverage picked up again to reach 34.8%.
Figure 5. CPG E-Commerce: Breakdown of Sales Share by Category (%) [caption id="attachment_131065" align="aligncenter" width="700"]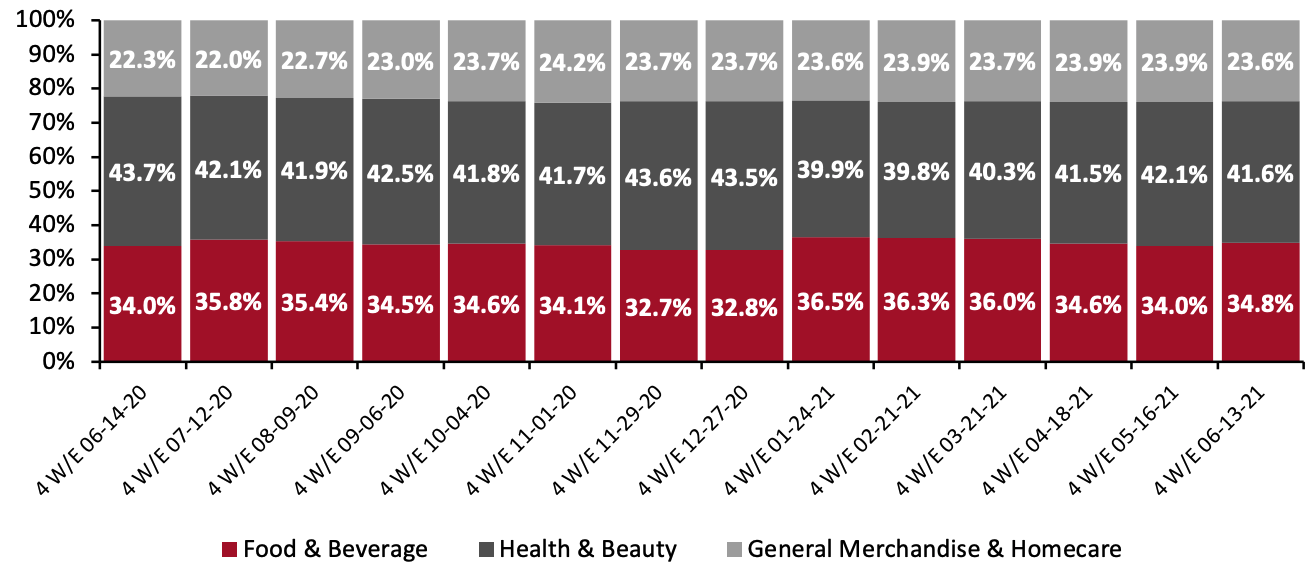 Source: IRI E-Market Insights™/Coresight Research[/caption]
4. The Beverages Department Outpaces Other Food Departments in Online Sales
Among the major food departments charted below, beverages saw the biggest online year-over-year gains, with 20.7% growth. This was driven by sports drinks (up 54.3%), liquid drink enhancers (up 40.4%) and carbonated beverages (up 35.9%).
Frozen foods—which saw an incredible surge during the pandemic—outpaced other food departments in total sales when compared against 2019 levels, with 27.3% growth.
Source: IRI E-Market Insights™/Coresight Research[/caption]
4. The Beverages Department Outpaces Other Food Departments in Online Sales
Among the major food departments charted below, beverages saw the biggest online year-over-year gains, with 20.7% growth. This was driven by sports drinks (up 54.3%), liquid drink enhancers (up 40.4%) and carbonated beverages (up 35.9%).
Frozen foods—which saw an incredible surge during the pandemic—outpaced other food departments in total sales when compared against 2019 levels, with 27.3% growth.
Figure 6. Food & Beverage Departments: E-Commerce and Total Sales Growth, Four Weeks Ended June 13, 2021 (YoY and Yo2Y % Change) [caption id="attachment_131090" align="aligncenter" width="725"]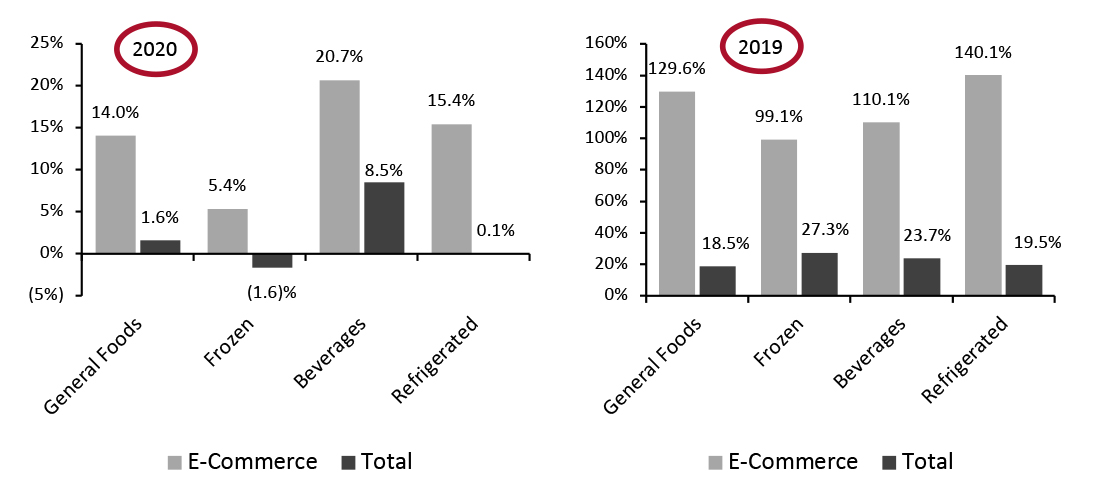 Source: IRI E-Market Insights™/Coresight Research[/caption]
5. General Merchandise Posted the Strongest Online Growth Among Nonfood Departments
General merchandise—which consists of a wide range of nonfood items, such as batteries, culinary items, napkins and towels, paper, pest control items and pet food—observed the highest online year-over-year growth in the latest period, increasing by 18.4%. Growth was driven by paper napkins (up 42.1%), cups and plates (up 41.7%) and writing instruments (up 31.1%).
On a two-year basis, homecare products saw 125.6% growth in online sales, the highest growth relative to other nonfood categories.
Figure 6. Nonfood Departments: E-Commerce and Total Sales Growth, Four Weeks Ended June 13, 2021 (YoY and Yo2Y % Change)
[caption id="attachment_131092" align="aligncenter" width="725"]
Source: IRI E-Market Insights™/Coresight Research[/caption]
5. General Merchandise Posted the Strongest Online Growth Among Nonfood Departments
General merchandise—which consists of a wide range of nonfood items, such as batteries, culinary items, napkins and towels, paper, pest control items and pet food—observed the highest online year-over-year growth in the latest period, increasing by 18.4%. Growth was driven by paper napkins (up 42.1%), cups and plates (up 41.7%) and writing instruments (up 31.1%).
On a two-year basis, homecare products saw 125.6% growth in online sales, the highest growth relative to other nonfood categories.
Figure 6. Nonfood Departments: E-Commerce and Total Sales Growth, Four Weeks Ended June 13, 2021 (YoY and Yo2Y % Change)
[caption id="attachment_131092" align="aligncenter" width="725"]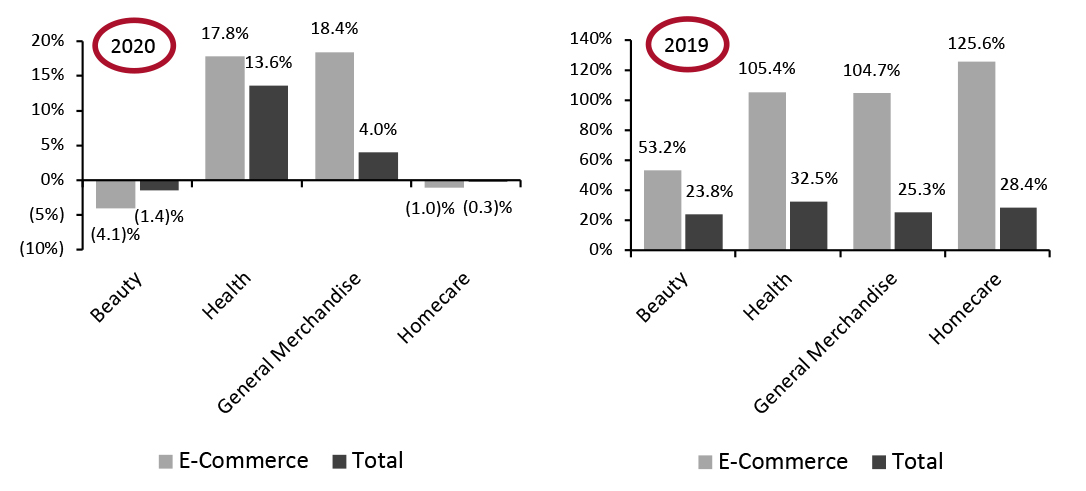 Source: IRI E-Market Insights™/Coresight Research[/caption]
What We Think
CPG e-commerce has begun to rise again, as we move beyond peak growth periods caused by last year’s consumer stockpiling and lockdown phases. Additionally, online CPG sales have almost doubled compared to pre-pandemic levels, demonstrating the channel’s continued strength and its impressive staying power.
We believe that pandemic-driven shopping behaviors will potentially outlast the crisis and expect that e-commerce will become more entrenched in consumer buying habits. To thrive in a post-crisis future, it will be imperative for CPG manufacturers and retailers to capitalize on the e-commerce wave and to build and enhance their online sales channels.
Source: IRI E-Market Insights™/Coresight Research[/caption]
What We Think
CPG e-commerce has begun to rise again, as we move beyond peak growth periods caused by last year’s consumer stockpiling and lockdown phases. Additionally, online CPG sales have almost doubled compared to pre-pandemic levels, demonstrating the channel’s continued strength and its impressive staying power.
We believe that pandemic-driven shopping behaviors will potentially outlast the crisis and expect that e-commerce will become more entrenched in consumer buying habits. To thrive in a post-crisis future, it will be imperative for CPG manufacturers and retailers to capitalize on the e-commerce wave and to build and enhance their online sales channels.
Figure 1. CPG E-Commerce and Total Sales Growth (YoY % Change) [caption id="attachment_131061" align="aligncenter" width="700"]
Historical data have been revised for the latest periodSource: IRI E-Market Insights™/Coresight Research[/caption] Compared to the same period in 2019, CPG e-commerce sales have shown strong, positive growth for the four weeks ended June 13, 2021, with sales almost doubling.
Figure 2. CPG E-Commerce and Total Sales Growth (% Change from Two Years Prior) [caption id="attachment_131062" align="aligncenter" width="700"]
Historical data have been revised for the latest periodSource: IRI E-Market Insights™/Coresight Research[/caption] 2. Food & Beverage Online Sales Experience an Uptick Online food & beverage sales saw growth of 13.8% for the period ended June 13, 2021, compared to 0.9% in the prior period. Relative to other categories, it continues to see high online growth compared to 2019, soaring by 123.4%—indicating that the channel has retained its appeal with consumers. Both general merchandise & homecare and health & beauty have seen sales rise again after a spell of softening growth. On a two-year basis, general merchandise & homecare saw significant growth of 108.2% in the latest period, while health & beauty grew by 76.1%.
Figure 3. E-Commerce CPG Sales Growth, by Category Type (YoY % Change) [caption id="attachment_131063" align="aligncenter" width="700"]
Historical data have been revised in the latest periodSource: IRI E-Market Insights™/Coresight Research[/caption]
Figure 4. E-Commerce CPG Sales Growth, by Category Type (% Change from Two Years Prior) [caption id="attachment_131064" align="aligncenter" width="700"]
Historical data have been revised in the latest periodSource: IRI E-Market Insights™/Coresight Research[/caption] 3. Breakdown of Online CPG Sales: Health & Beauty and General Merchandise & Homecare See Marginal Decrease Health & beauty’s share declined by 0.5 percentage points to hit 41.6% for the four weeks ended June 13, 2021. General merchandise & homecare also declined slightly to 23.6%, while food & beverage picked up again to reach 34.8%.
Figure 5. CPG E-Commerce: Breakdown of Sales Share by Category (%) [caption id="attachment_131065" align="aligncenter" width="700"]
Source: IRI E-Market Insights™/Coresight Research[/caption]
4. The Beverages Department Outpaces Other Food Departments in Online Sales
Among the major food departments charted below, beverages saw the biggest online year-over-year gains, with 20.7% growth. This was driven by sports drinks (up 54.3%), liquid drink enhancers (up 40.4%) and carbonated beverages (up 35.9%).
Frozen foods—which saw an incredible surge during the pandemic—outpaced other food departments in total sales when compared against 2019 levels, with 27.3% growth.
Figure 6. Food & Beverage Departments: E-Commerce and Total Sales Growth, Four Weeks Ended June 13, 2021 (YoY and Yo2Y % Change) [caption id="attachment_131090" align="aligncenter" width="725"]
IRI Disclaimer: The information contained herein is based in part on data reported by the IRI E-Market Insights™ solution and as interpreted solely by Coresight Research. The information is believed to be reliable at the time supplied by IRI but is neither all-inclusive nor guaranteed by IRI or Coresight Research, Inc. Without limiting the generality of the foregoing, specific data points may vary considerably from other information sources. Any opinion expressed herein reflect the judgement of Coresight Research, Inc. and are subject to change. IRI disclaims liability of any kind arising from the use of this information.