Nitheesh NH
US CPG Sales Tracker: Coresight Research x IRI Analysis
The Coresight Research and IRI monthly US CPG Sales Tracker presents data-driven insights into online sales trends in the US CPG industry—covering the product categories of food & beverage, health & beauty, and general merchandise & homecare. In this report, we present five key insights for the four weeks ended June 12, 2022. 1. Online CPG Continues Its Mid-Teens Growth CPG e-commerce year-over-year growth further declined to 15.2% for the four weeks ended June 12, 2022, from 16.0% in May, maintaining the mid-teens growth seen in January, February and May 2022. We expect e-commerce year-over-year growth rates to decline marginally in July 2022 due to strong comparatives. The two-year stack for e-commerce stands at 39.2% in June 2022—up from a 23.3% two-year stack in May—maintaining strong growth overall. Total CPG sales growth improved marginally this period—up to 8.0% year over year from 7.6% in May—retaining stability with high single-digit growth.Figure 1. CPG E-Commerce and Total Sales Growth (YoY % Change) [caption id="attachment_151277" align="aligncenter" width="700"]
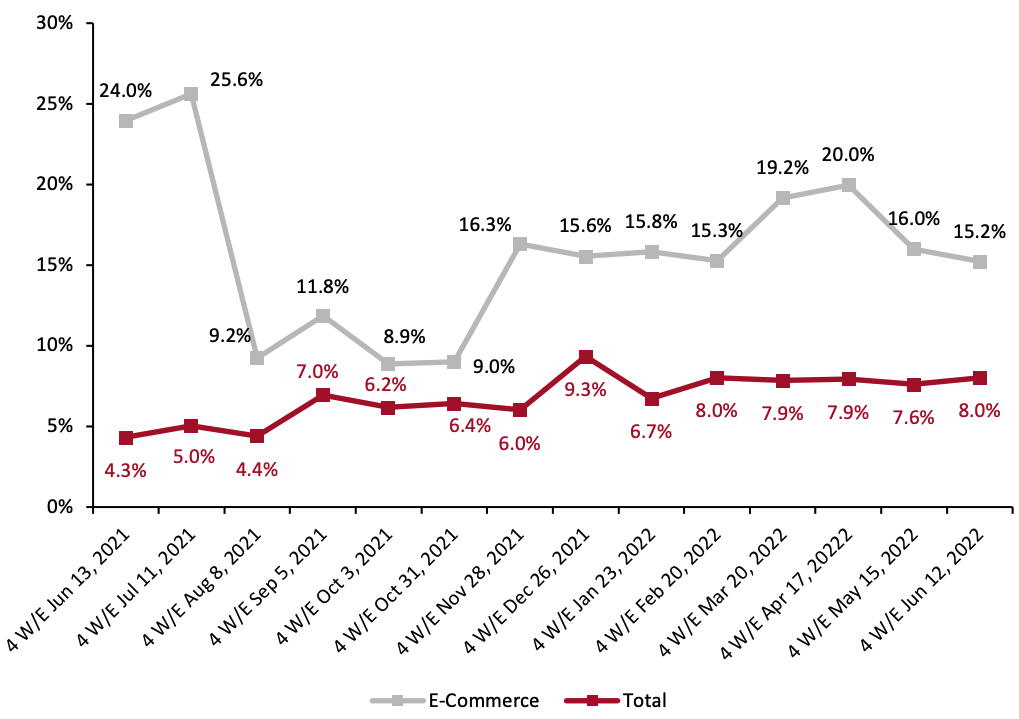 Historical data have been revised for the latest period
Source: IRI E-Market Insights™/Coresight Research[/caption] 2. All Three Categories Maintain Consistent Online Growth We break down the online CPG market into three major categories: food & beverage, health & beauty, and general merchandise & homecare. All categories maintained stable double-digit growth this period, reaching 11.3%, 17.3% and 17.7% year over year, respectively. Of the three categories, health & beauty growth saw an increase of 0.6 percentage points from 16.7% in May. Meanwhile, growth in food & beverage and general merchandise & homecare declined, by 1.9 and 0.9 percentage points, respectively.
Figure 2. E-Commerce CPG Sales Growth by Category Type (YoY % Change) [caption id="attachment_151278" align="aligncenter" width="700"]
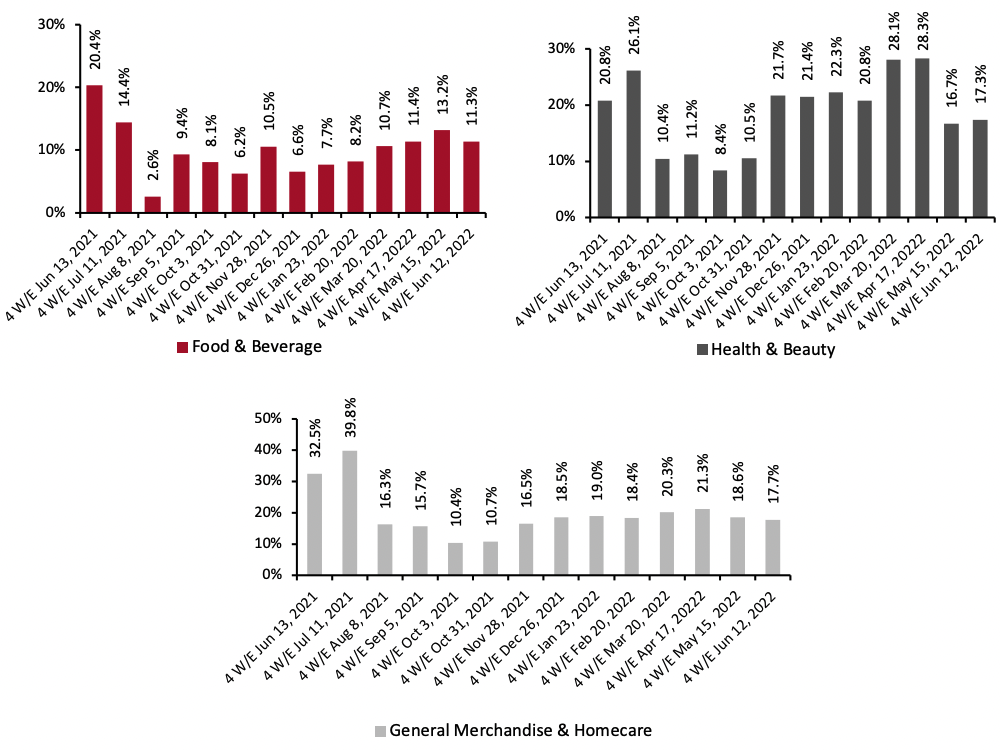 Historical data have been revised in the latest period
Source: IRI E-Market Insights™/Coresight Research[/caption] 3. Breakdown of Online CPG Sales: Health & Beauty Share Decreases Marginally Figure 3 shows the breakdown of online sales by CPG category. In the four weeks ended June 12, 2022, the health & beauty category declined again, this time by a marginal 0.4 percentage points to 34.3%—marking its fourth decline in market share this year. Meanwhile, food & beverage and general merchandise & homecare increased marginally, by 0.2 and 0.1 percentage points, to 34.3% and 31.4%, respectively.
Figure 3. CPG E-Commerce: Breakdown of Sales Share by Category (%) [caption id="attachment_151279" align="aligncenter" width="700"]
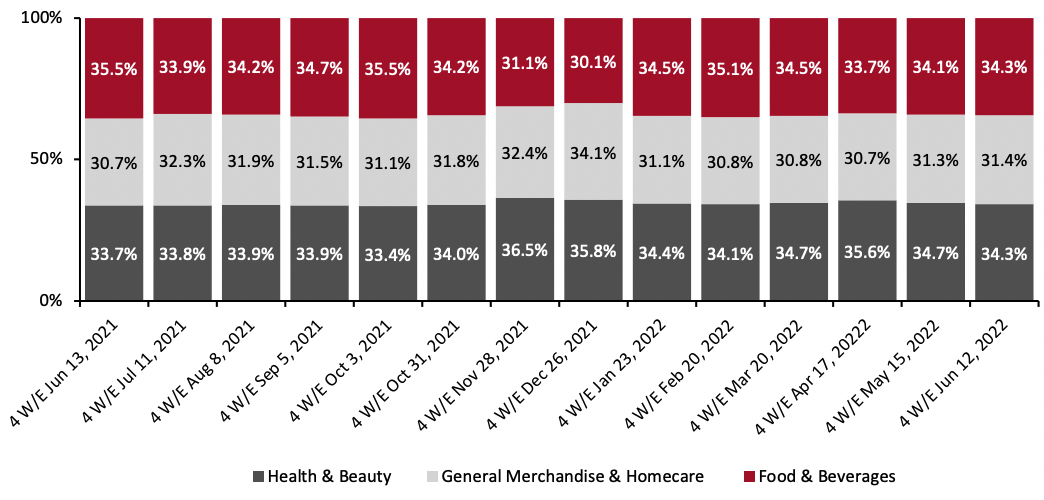 Source: IRI E-Market Insights™/Coresight Research[/caption]
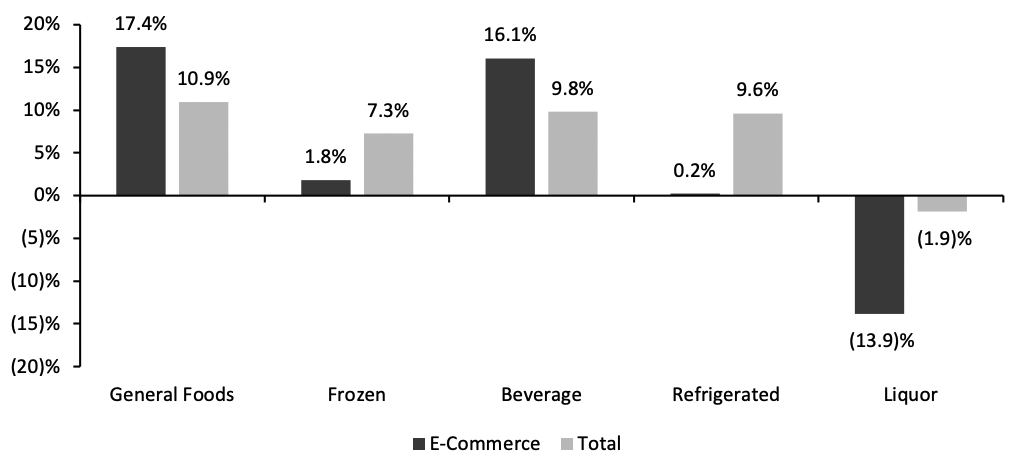
4. General Foods Outpace Other Food Departments in Online and Total Sales
The general foods department reported the highest year-over-year online and total sales growth rate, at 17.4% and 10.9%, respectively. Year-over-year online sales growth for general foods was driven by increases in sales of frosting (up 63.6%), baking cups/paper (up 48.9%), gum (up 42.7%) and hot cereal (up 41.7%). Furthermore, year-over-year total sales growth for the department was driven by egg substitutes (up 120.4%) and pasta (24.9%), as well as overall inflation.
Source: IRI E-Market Insights™/Coresight Research[/caption]
4. General Foods Outpace Other Food Departments in Online and Total Sales
The general foods department reported the highest year-over-year online and total sales growth rate, at 17.4% and 10.9%, respectively. Year-over-year online sales growth for general foods was driven by increases in sales of frosting (up 63.6%), baking cups/paper (up 48.9%), gum (up 42.7%) and hot cereal (up 41.7%). Furthermore, year-over-year total sales growth for the department was driven by egg substitutes (up 120.4%) and pasta (24.9%), as well as overall inflation.
Figure 4. Food & Beverage Departments: E-Commerce and Total Sales Growth, Four Weeks Ended Jun 12, 2022 (YoY % Change) [caption id="attachment_151280" align="aligncenter" width="700"]
 Source: IRI E-Market Insights™/Coresight Research[/caption]
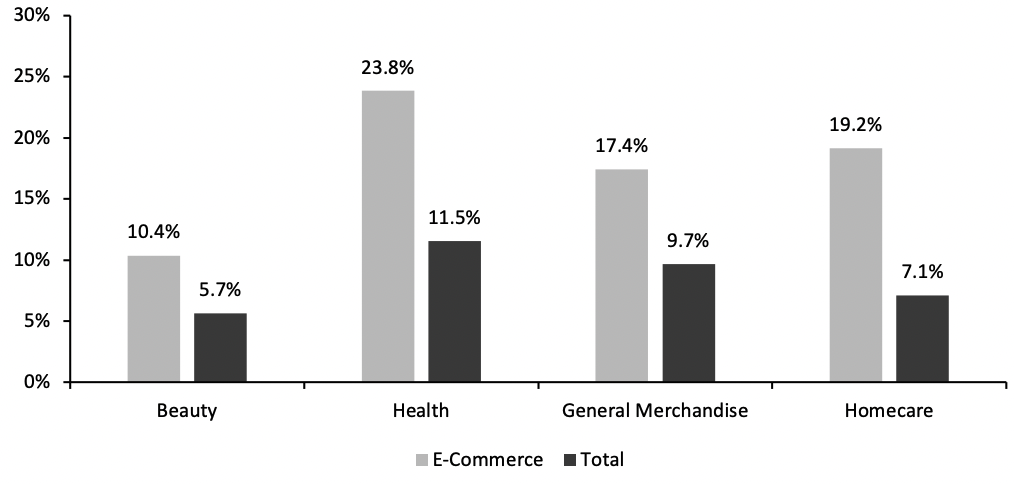
5. Health Stays in the Lead for Online Growth Among Nonfood Departments
The health department saw the highest year-over-year online and total sales growth among nonfood departments in the four weeks ended June 12, 2022, reaching 23.8% and 11.5% growth, respectively. Growth in health e-commerce was driven by adult incontinence products (up 99.2%), denture products (up 49.4%), and home healthcare/kits (up 45.7%).
Source: IRI E-Market Insights™/Coresight Research[/caption]
5. Health Stays in the Lead for Online Growth Among Nonfood Departments
The health department saw the highest year-over-year online and total sales growth among nonfood departments in the four weeks ended June 12, 2022, reaching 23.8% and 11.5% growth, respectively. Growth in health e-commerce was driven by adult incontinence products (up 99.2%), denture products (up 49.4%), and home healthcare/kits (up 45.7%).
Figure 5. Nonfood Departments: E-Commerce and Total Sales Growth, Four Weeks Ended Jun 12, 2022 (YoY % Change) [caption id="attachment_151281" align="aligncenter" width="700"]
 Source: IRI E-Market Insights™/Coresight Research[/caption]
What We Think
We expect e-commerce CPG growth to decline marginally in the coming months against strong comparatives from last year. Furthermore, rising inflation and higher input costs are impacting the profit margins of US retailers. Most retailers, including CPG majors, have announced additional price increases for some of their product categories, which is likely to adversely impact consumer spending on CPG categories in the short term.IRI Disclaimer: The information contained herein is based in part on data reported by the IRI E-Market Insights™ solution and as interpreted solely by Coresight Research. The information is believed to be reliable at the time supplied by IRI but is neither all-inclusive nor guaranteed by IRI or Coresight Research, Inc. Without limiting the generality of the foregoing, specific data points may vary considerably from other information sources. Any opinions expressed herein reflect the judgement of Coresight Research, Inc. and are subject to change. IRI disclaims liability of any kind arising from the use of this information.