DIpil Das
The Coresight Research and IRI monthly US CPG Sales Tracker provides our data-driven insights into online sales trends in the US CPG industry—covering the product categories of food & beverage; health & beauty; and general merchandise & homecare. In this report, we present five key insights into the four weeks ended October 3, 2021.
1. Online CPG Growth Continues To Dip
CPG e-commerce growth dipped to 7.9% for the four weeks ended October 3, 2021, down from 11.5% in the previous period. Total CPG sales also witnessed a slight dip in the growth rate.
The deceleration in online retail sales for the latest period can be partly attributed to the annualization of pandemic spending patterns. The total e-commerce CPG sales growth rate for the same period in 2020, during the four weeks ended October 4, 2020, remained at a much higher rate of 71.6%. We expect that year-over-year growth for the rest of the year will decline primarily on the back of strong comparatives.
Figure 1. CPG E-Commerce and Total Sales Growth (YoY % Change) [caption id="attachment_136374" align="aligncenter" width="726"]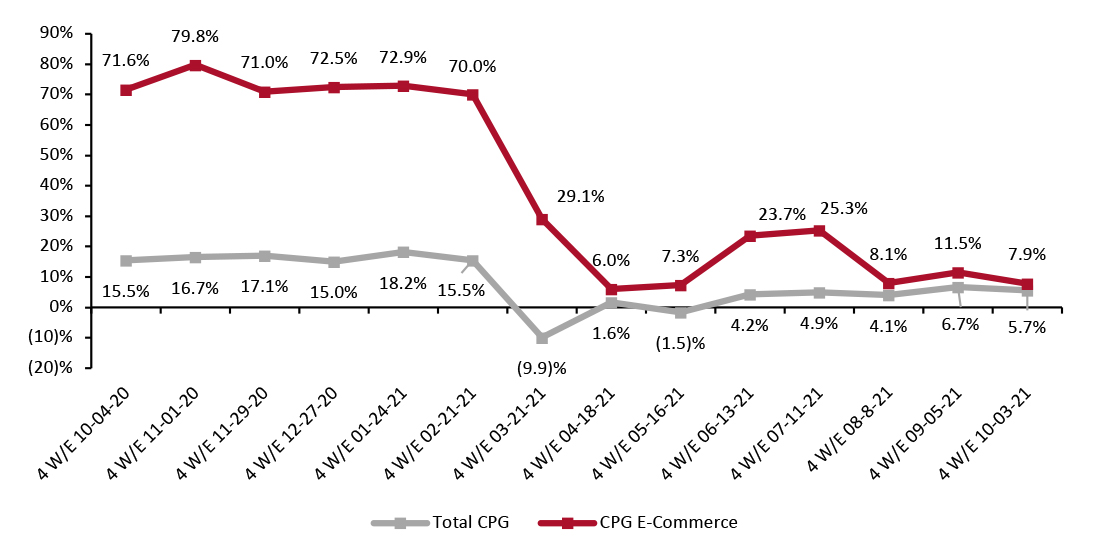 Historical data have been revised for the latest period
Source: IRI E-Market Insights™/Coresight Research [/caption] However, comparing CPG e-commerce sales to the period two years prior shows strong positive growth of 85.2% for the four weeks ended October 3, 2021—online CPG sales have increased significantly compared to pre-pandemic levels.
Figure 2. CPG E-Commerce and Total Sales Growth (% Change from Two Years Prior) [caption id="attachment_136375" align="aligncenter" width="726"]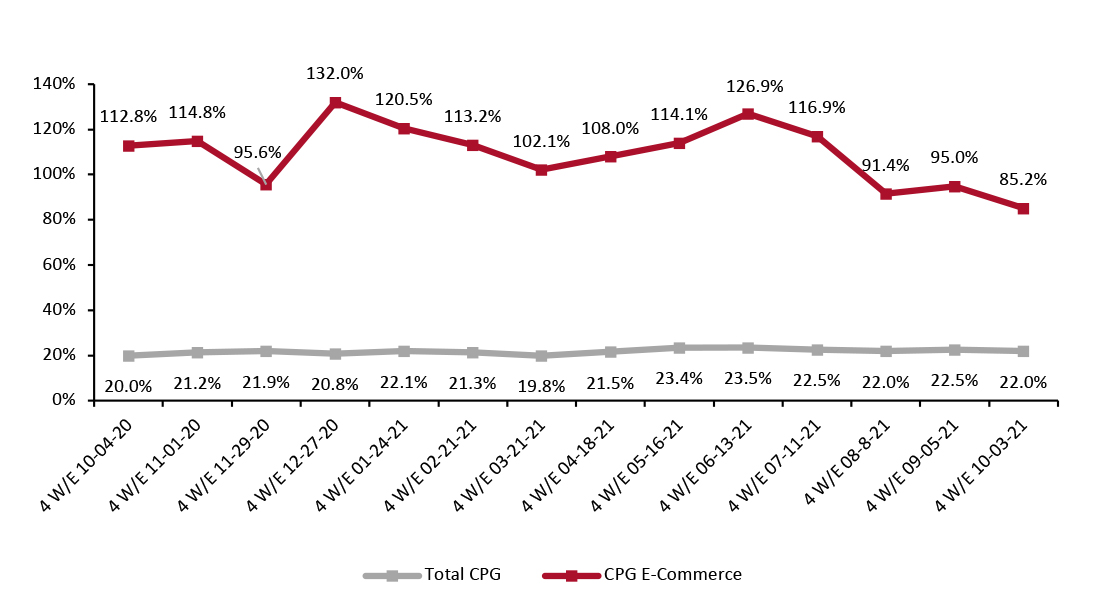 Historical data have been revised for the latest period
Source: IRI E-Market Insights™/Coresight Research [/caption] 2. All Three Categories Witnessed Deceleration in E-Commerce Sales Growth All three categories—food & beverage, health & beauty and general merchandise & homecare—witnessed slight deceleration in year-over-year growth rates, falling to 8.4%, 7.7%, and 9.0%, respectively. The general merchandise & homecare category witnessed 9.0% growth, declining 5.9 percentage points compared to the previous period. However, it reported growth of 90.0% compared to 2019. The online food & beverage category witnessed a slight decline of 2.9 percentage points in year-over-year online sales. On a two-year basis, online sales of food & beverage witnessed significant growth of 96.7%.
Figure 3. E-Commerce CPG Sales Growth, by Category Type (YoY % Change) [caption id="attachment_137210" align="aligncenter" width="700"]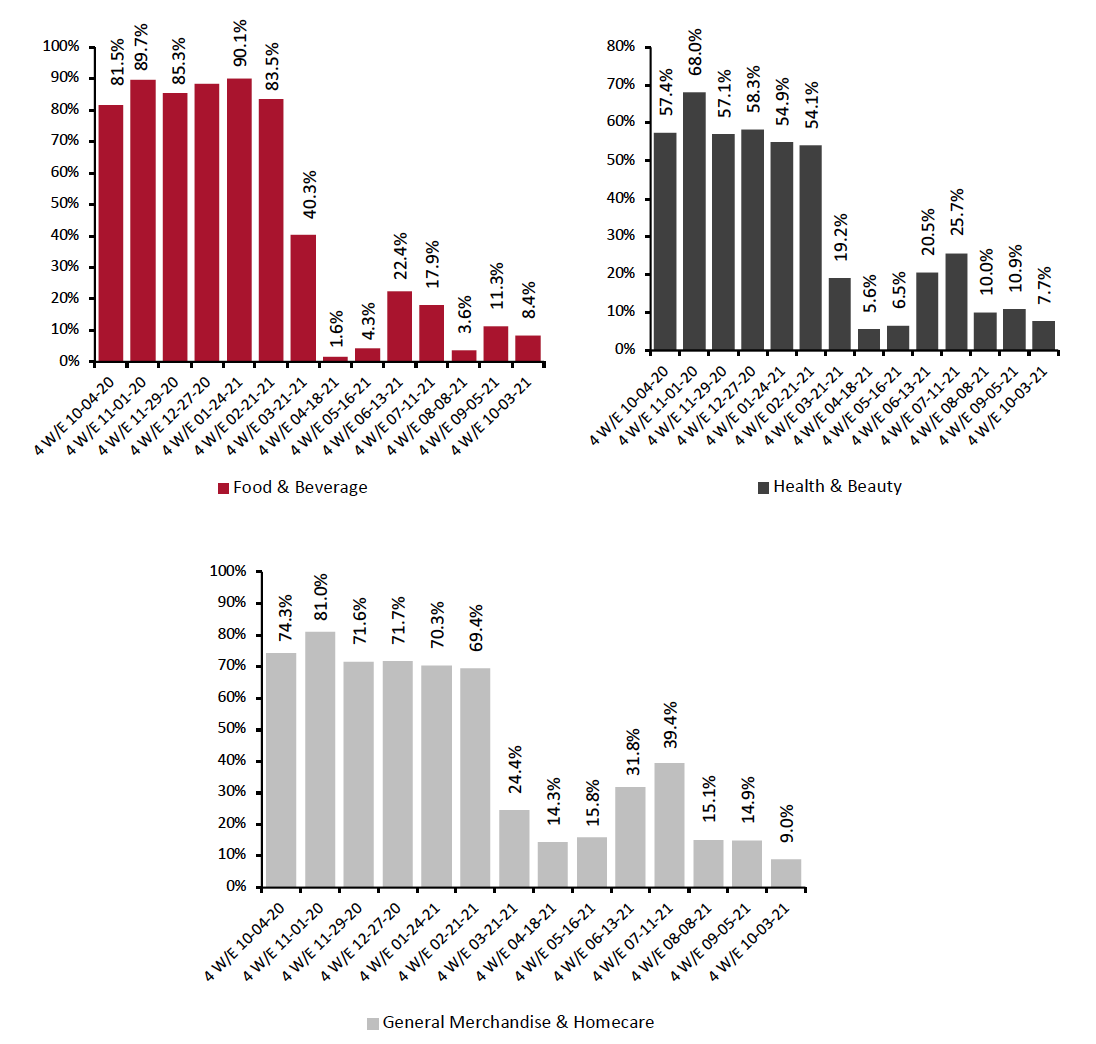 Historical data have been revised in the latest period
Source: IRI E-Market Insights™/Coresight Research[/caption]
Figure 4. E-Commerce CPG Sales Growth, by Category Type (% Change from Two Years Prior) [caption id="attachment_137211" align="aligncenter" width="700"]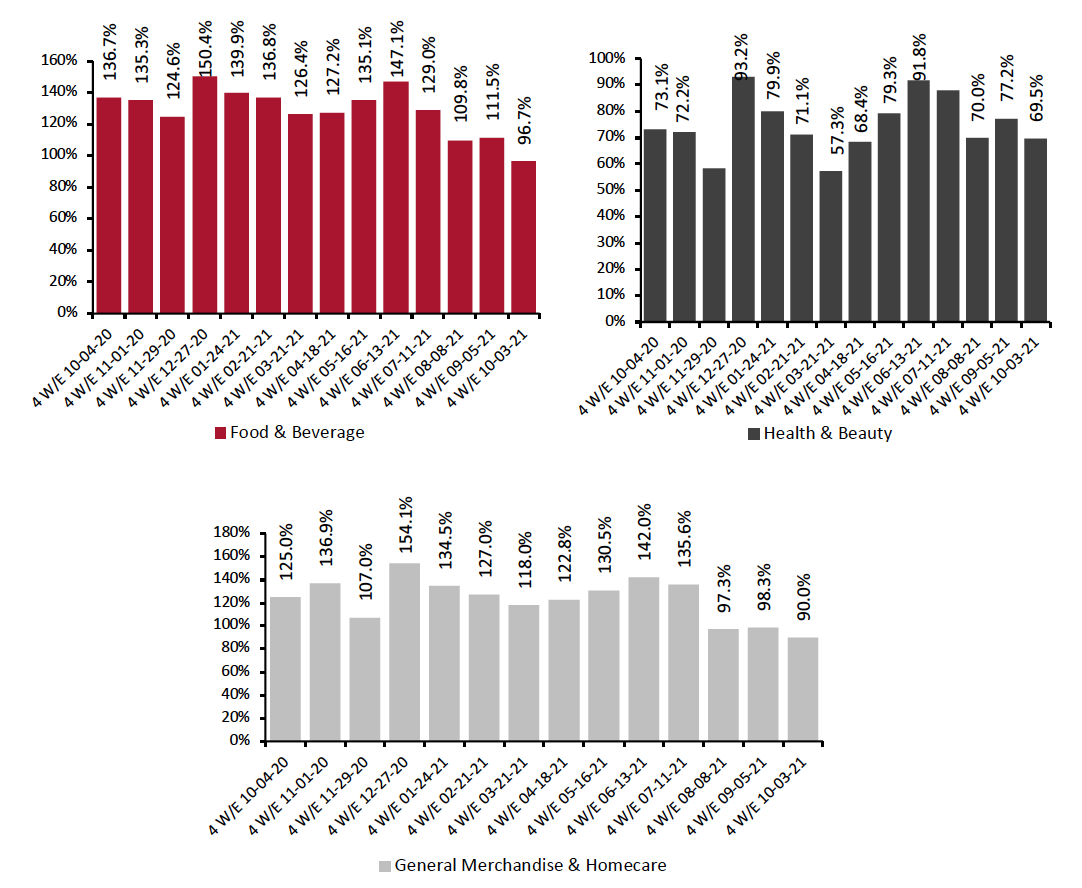 Historical data have been revised in the latest period
Source: IRI E-Market Insights™/Coresight Research[/caption] 3. Breakdown of Online CPG Sales: Food & Beverage Share Rises, While Health & Beauty Dips The chart below shows the breakdown of online sales by type of CPG category. Food & beverage’s share improved slightly, reaching 38.6% during the four weeks ended October 3, 2021. Health & beauty’s online share reduced slightly, by 0.4 percentage points, and accounted for 31.6% of the CPG e-commerce market share, while general merchandise & homecare also decreased to 29.7%.
Figure 5. CPG E-Commerce: Breakdown of Sales Share by Category (%) [caption id="attachment_136378" align="aligncenter" width="725"]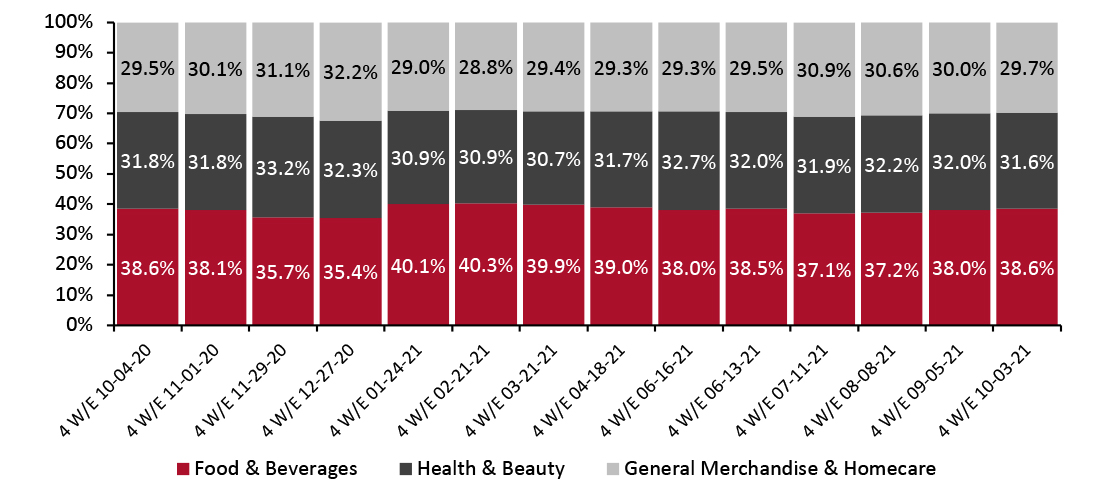 Source: IRI E-Market Insights™/Coresight Research[/caption]
4. Refrigerated Department Outperforms Other Food Departments in Online Sales
As compared to other departments, refrigerated reported the highest year-over-year online growth—total online sales increased by 18.3% from the comparable period in 2020 and 110.5% from 2019. Growth was driven by online sales of desserts (up 71.0%), entrées (up 63.5%) and seafood (up 33.3%).
Source: IRI E-Market Insights™/Coresight Research[/caption]
4. Refrigerated Department Outperforms Other Food Departments in Online Sales
As compared to other departments, refrigerated reported the highest year-over-year online growth—total online sales increased by 18.3% from the comparable period in 2020 and 110.5% from 2019. Growth was driven by online sales of desserts (up 71.0%), entrées (up 63.5%) and seafood (up 33.3%).
Figure 6. Food & Beverage Departments: E-Commerce and Total Sales Growth, Four Weeks Ended October 3, 2021 (% Change vs. 2020 and 2019) [caption id="attachment_136379" align="aligncenter" width="726"]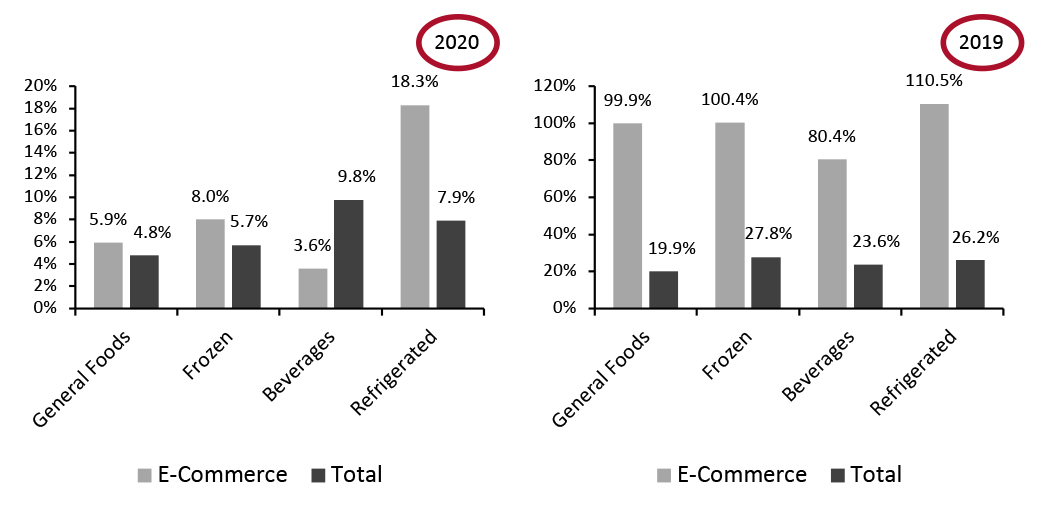 Source: IRI E-Market Insights™/Coresight Research [/caption]
5. General Merchandise Reports Highest Online and Total Growth Among Nonfood Departments
The homecare department recorded the highest year-over-year online sales growth relative to other nonfood departments, growing by 13.1%. Homecare e-commerce sales were driven by cleaning tools including mops and brooms (up 23.9%), pest control (up 23.0%), and fabric softeners (up 19.7%).
Online sales of health products grew by only 9.4% year over year. However, compared to 2019, online sales grew significantly, reaching 86.7% and total sales were up 37.0%.
Source: IRI E-Market Insights™/Coresight Research [/caption]
5. General Merchandise Reports Highest Online and Total Growth Among Nonfood Departments
The homecare department recorded the highest year-over-year online sales growth relative to other nonfood departments, growing by 13.1%. Homecare e-commerce sales were driven by cleaning tools including mops and brooms (up 23.9%), pest control (up 23.0%), and fabric softeners (up 19.7%).
Online sales of health products grew by only 9.4% year over year. However, compared to 2019, online sales grew significantly, reaching 86.7% and total sales were up 37.0%.
Figure 7. Nonfood Departments: E-Commerce and Total Sales Growth, Four Weeks Ended October 3, 2021 (% Change vs. 2020 and 2019) [caption id="attachment_136380" align="aligncenter" width="726"]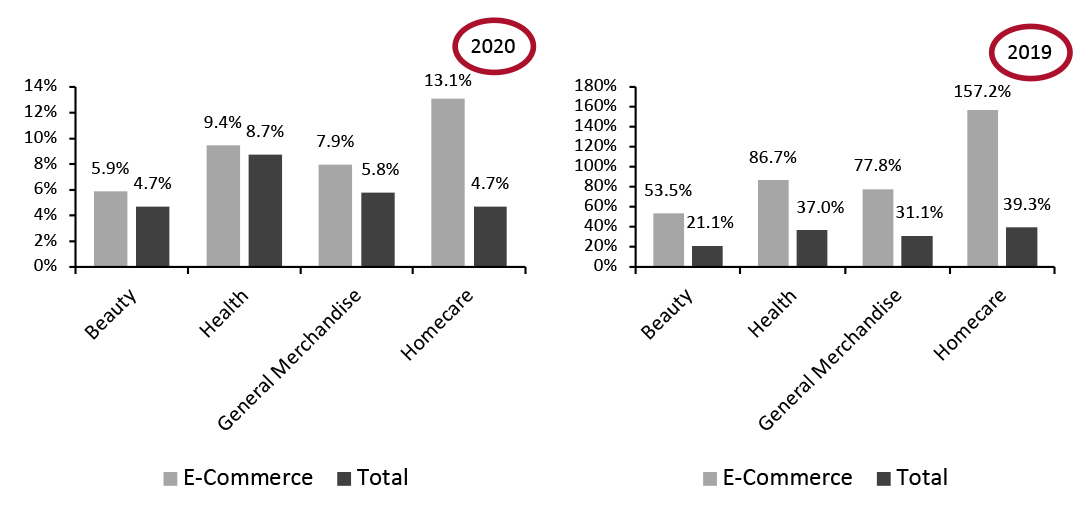 Source: IRI E-Market Insights™/Coresight Research [/caption]
IRI Disclaimer: The information contained herein is based in part on data reported by the IRI E-Market Insights™ solution and as interpreted solely by Coresight Research. The information is believed to be reliable at the time supplied by IRI but is neither all-inclusive nor guaranteed by IRI or Coresight Research, Inc. Without limiting the generality of the foregoing, specific data points may vary considerably from other information sources. Any opinion expressed herein reflect the judgement of Coresight Research, Inc. and are subject to change. IRI disclaims liability of any kind arising from the use of this information.
Figure 1. CPG E-Commerce and Total Sales Growth (YoY % Change) [caption id="attachment_136374" align="aligncenter" width="726"]
Source: IRI E-Market Insights™/Coresight Research [/caption] However, comparing CPG e-commerce sales to the period two years prior shows strong positive growth of 85.2% for the four weeks ended October 3, 2021—online CPG sales have increased significantly compared to pre-pandemic levels.
Figure 2. CPG E-Commerce and Total Sales Growth (% Change from Two Years Prior) [caption id="attachment_136375" align="aligncenter" width="726"]
Source: IRI E-Market Insights™/Coresight Research [/caption] 2. All Three Categories Witnessed Deceleration in E-Commerce Sales Growth All three categories—food & beverage, health & beauty and general merchandise & homecare—witnessed slight deceleration in year-over-year growth rates, falling to 8.4%, 7.7%, and 9.0%, respectively. The general merchandise & homecare category witnessed 9.0% growth, declining 5.9 percentage points compared to the previous period. However, it reported growth of 90.0% compared to 2019. The online food & beverage category witnessed a slight decline of 2.9 percentage points in year-over-year online sales. On a two-year basis, online sales of food & beverage witnessed significant growth of 96.7%.
Figure 3. E-Commerce CPG Sales Growth, by Category Type (YoY % Change) [caption id="attachment_137210" align="aligncenter" width="700"]
Source: IRI E-Market Insights™/Coresight Research[/caption]
Figure 4. E-Commerce CPG Sales Growth, by Category Type (% Change from Two Years Prior) [caption id="attachment_137211" align="aligncenter" width="700"]
Source: IRI E-Market Insights™/Coresight Research[/caption] 3. Breakdown of Online CPG Sales: Food & Beverage Share Rises, While Health & Beauty Dips The chart below shows the breakdown of online sales by type of CPG category. Food & beverage’s share improved slightly, reaching 38.6% during the four weeks ended October 3, 2021. Health & beauty’s online share reduced slightly, by 0.4 percentage points, and accounted for 31.6% of the CPG e-commerce market share, while general merchandise & homecare also decreased to 29.7%.
Figure 5. CPG E-Commerce: Breakdown of Sales Share by Category (%) [caption id="attachment_136378" align="aligncenter" width="725"]
Figure 6. Food & Beverage Departments: E-Commerce and Total Sales Growth, Four Weeks Ended October 3, 2021 (% Change vs. 2020 and 2019) [caption id="attachment_136379" align="aligncenter" width="726"]
Figure 7. Nonfood Departments: E-Commerce and Total Sales Growth, Four Weeks Ended October 3, 2021 (% Change vs. 2020 and 2019) [caption id="attachment_136380" align="aligncenter" width="726"]
What We Think
CPG e-commerce continues to witness slowing sales growth due to tough year-over-year comparatives. We expect online food & beverage sales to witness steeper growth declines during the fourth quarter of 2021 as consumers have begun returning to physical stores. As the rate of new infections is declining, fear of the Covid-19 Delta variant has subsided among US consumers—eased further by high vaccination rates and the rollout of booster shots. The overall avoidance rate of public spaces has dropped below 60.0%, according to Coresight Research’s recent US Consumer Tracker survey findings. As consumers return to stores, we expect growth rates to further decline.IRI Disclaimer: The information contained herein is based in part on data reported by the IRI E-Market Insights™ solution and as interpreted solely by Coresight Research. The information is believed to be reliable at the time supplied by IRI but is neither all-inclusive nor guaranteed by IRI or Coresight Research, Inc. Without limiting the generality of the foregoing, specific data points may vary considerably from other information sources. Any opinion expressed herein reflect the judgement of Coresight Research, Inc. and are subject to change. IRI disclaims liability of any kind arising from the use of this information.