Nitheesh NH
US CPG Sales Tracker: Coresight Research x IRI Analysis
The Coresight Research and IRI monthly US CPG Sales Tracker presents data-driven insights into online sales trends in the US CPG industry—covering the product categories of food & beverage, health & beauty, and general merchandise & homecare. In this report, we present five key insights for the four weeks ended July 10, 2022. 1. Online CPG Growth Jumps to High-Teens CPG e-commerce year-over-year growth increased to 19.0% during the four weeks ended July 10, 2022, up from 14.8% in June, a return to high-teens growth seen in March and April of this year. We expect e-commerce year-over-year growth rates to remain similarly strong or possibly increase in August due to weaker comparatives. The two-year stack for e-commerce maintained its strong growth and now stands at 44.7%—up from a 39.2% two-year stack in June. Total CPG sales growth improved marginally this period, up to 9.1% year over year from 8.1% in June.Figure 1. CPG E-Commerce and Total Sales Growth (YoY % Change) [caption id="attachment_152783" align="aligncenter" width="700"]
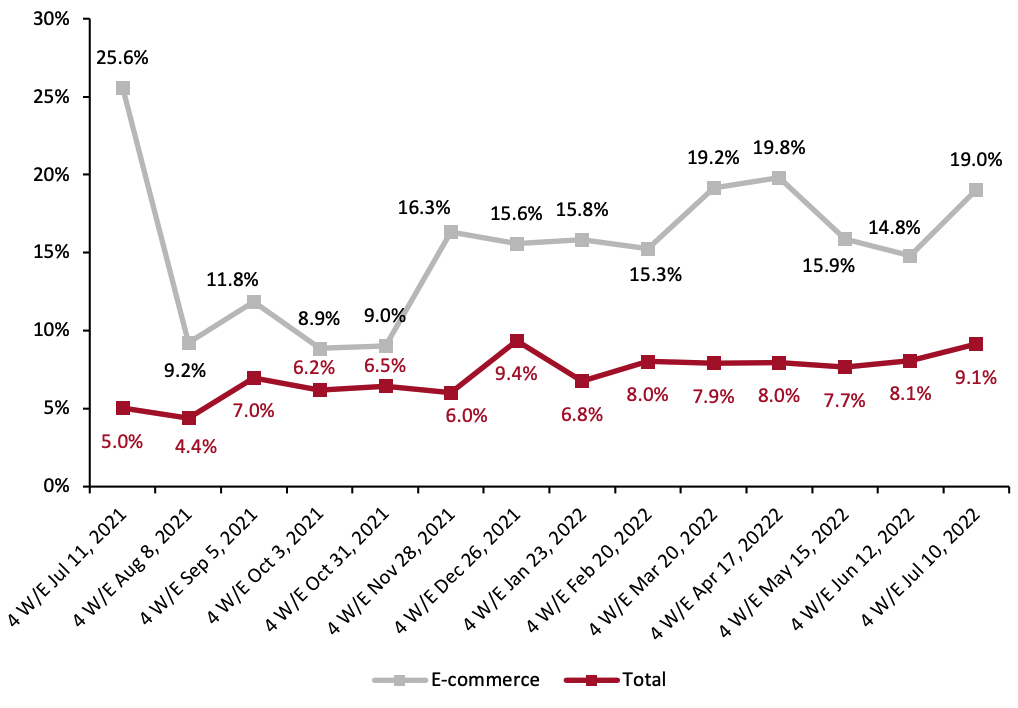 Historical data have been revised for the latest period
Source: IRI E-Market Insights™/Coresight Research[/caption] 2. All Three Categories Retain Their Double-Digit Online Growth We break down the online CPG market into three major categories: food & beverage, health & beauty, and general merchandise & homecare. All categories retained double-digit year-over-year growth this period, reaching 20.0%, 21.1% and 16.2%, respectively. Of the three categories, food & beverages and health & beauty growth saw increases of 9.8 and 3.6 PPTs, from 10.2% and 17.5% in June, respectively. Meanwhile, general merchandise & homecare month-over-month growth declined by 1.1 PPTs.
Figure 2. E-Commerce CPG Sales Growth by Category Type (YoY % Change) [caption id="attachment_152784" align="aligncenter" width="700"]
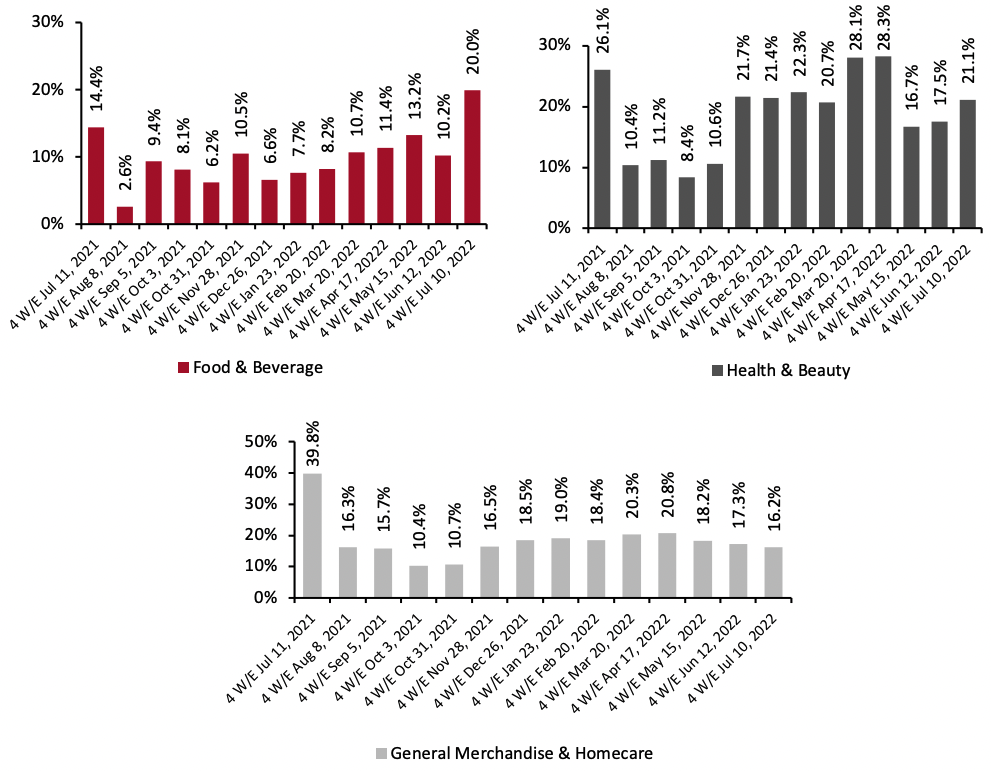 Historical data have been revised in the latest period
Source: IRI E-Market Insights™/Coresight Research[/caption] 3. Breakdown of Online CPG Sales: Categories Retain Their Sales Share from June 2022 Figure 3 below shows the breakdown of online sales share by CPG category. In the four weeks ended July 10, 2022, all three categories largely retained their sales shares from June 2022. While food & beverage and general merchandise & homecare increased by 0.1 PPTs each, to 34.2% and 31.5%, respectively, health & beauty declined by 0.1 PPTs to 34.4%.
Figure 3. CPG E-Commerce: Breakdown of Sales Share by Category (%) [caption id="attachment_152785" align="aligncenter" width="700"]
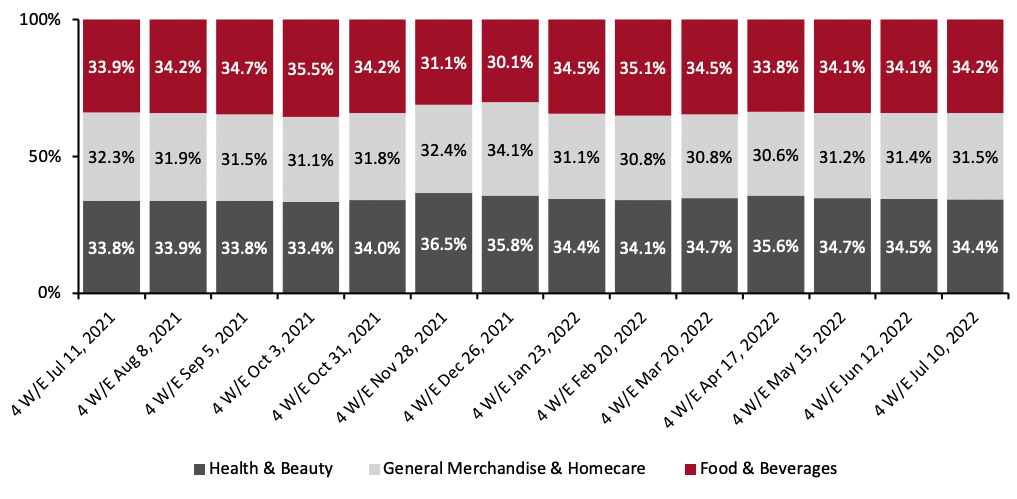 Source: IRI E-Market Insights™/Coresight Research[/caption]
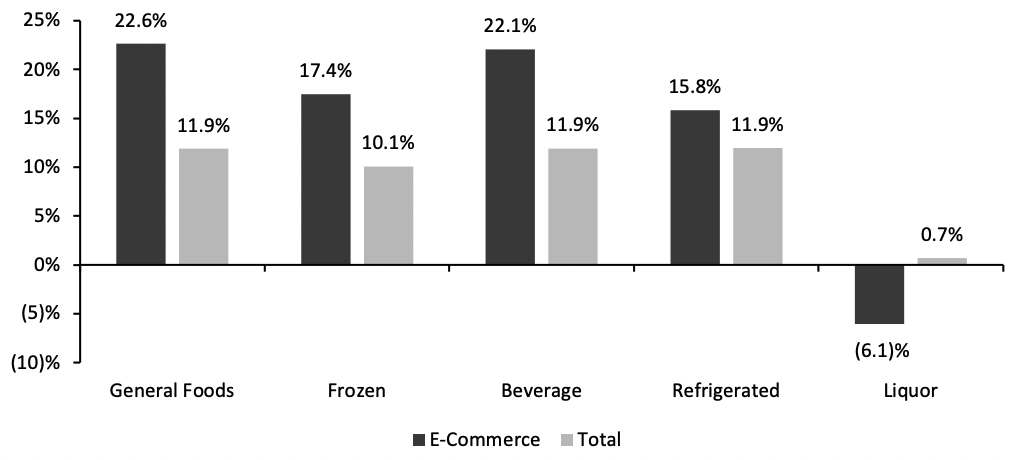
4. General Foods Outpace Other Food Departments in Online and Total Sales
The general foods department reported the highest year-over-year online sales growth rate at 22.6%. Year-over-year online sales growth for the department was driven by increases in sales of baby formula/electrolytes (up 54.1%), egg substitutes (up 49.8%) and popcorn/popcorn oil (up 48.8%).
Likewise, general foods, along with the beverage and refrigerated departments, reported the highest year-over-year growth rates in total sales, at 11.9% each.
Source: IRI E-Market Insights™/Coresight Research[/caption]
4. General Foods Outpace Other Food Departments in Online and Total Sales
The general foods department reported the highest year-over-year online sales growth rate at 22.6%. Year-over-year online sales growth for the department was driven by increases in sales of baby formula/electrolytes (up 54.1%), egg substitutes (up 49.8%) and popcorn/popcorn oil (up 48.8%).
Likewise, general foods, along with the beverage and refrigerated departments, reported the highest year-over-year growth rates in total sales, at 11.9% each.
Figure 4. Food & Beverage Departments: E-Commerce and Total Sales Growth, Four Weeks Ended Jul 10, 2022 (YoY % Change) [caption id="attachment_152786" align="aligncenter" width="700"]
 Source: IRI E-Market Insights™/Coresight Research[/caption]
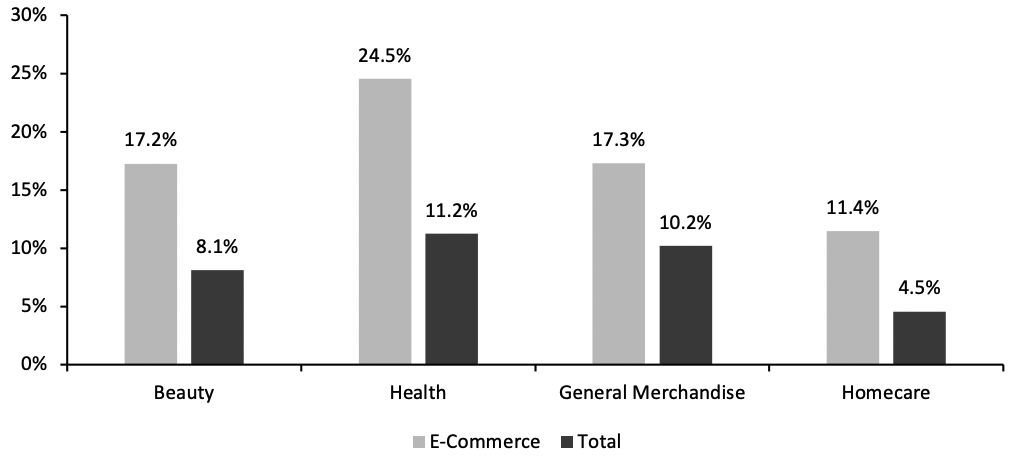
5. Health Continues to Lead Online Growth Among Nonfood Departments
The health department saw the highest year-over-year online and total sales growth among nonfood departments in the four weeks ended July 10, 2022, reaching 24.5% and 11.2% year-over-year growth, respectively. Growth in health e-commerce was driven by sanitary napkins/tampons (up 68.0%), denture products (up 53.9%), sleeping remedies (52.7%), upper respiratory (52.3%) and lip treatment (up 50.4%).
Source: IRI E-Market Insights™/Coresight Research[/caption]
5. Health Continues to Lead Online Growth Among Nonfood Departments
The health department saw the highest year-over-year online and total sales growth among nonfood departments in the four weeks ended July 10, 2022, reaching 24.5% and 11.2% year-over-year growth, respectively. Growth in health e-commerce was driven by sanitary napkins/tampons (up 68.0%), denture products (up 53.9%), sleeping remedies (52.7%), upper respiratory (52.3%) and lip treatment (up 50.4%).
Figure 5. Nonfood Departments: E-Commerce and Total Sales Growth, Four Weeks Ended Jul 10, 2022 (YoY % Change) [caption id="attachment_152788" align="aligncenter" width="700"]
 Source: IRI E-Market Insights™/Coresight Research[/caption]
What We Think
E-commerce CPG year-over-year growth returned to the high-teens this period, at 19.0%, supported by strong double-digit growth among all three categories. As comparatives weaken in August, we expect e-commerce CPG growth to remain similarly strong or accelerate in the coming months. The price-hike strategies meant to offset input cost inflation will likely continue to be employed by many CPG giants for the remainder of the year. However, companies’ focus on innovation, product quality improvements, and marketing spends will likely attract more consumer CPG spending in the long term.IRI Disclaimer: The information contained herein is based in part on data reported by the IRI E-Market Insights™ solution and as interpreted solely by Coresight Research. The information is believed to be reliable at the time supplied by IRI but is neither all-inclusive nor guaranteed by IRI or Coresight Research, Inc. Without limiting the generality of the foregoing, specific data points may vary considerably from other information sources. Any opinions expressed herein reflect the judgement of Coresight Research, Inc. and are subject to change. IRI disclaims liability of any kind arising from the use of this information.