Nitheesh NH
The Coresight Research and IRI monthly US CPG Sales Tracker provides our data-driven insights into online sales trends in the US CPG industry—covering the product categories of food & beverage; health & beauty; and general merchandise & homecare. In this report, we present five key insights into the four weeks ending July 11, 2021.
1. Online CPG Growth Accelerates for the Second Consecutive Period
Consumers continue to turn to e-commerce for CPG shopping amid the pandemic: The online CPG channel has been trending upward in the last two periods, after decelerating for the three consecutive periods prior. The deceleration was partly due to the annualization of strong growth recorded during the same periods last year, caused by lockdown restrictions. The channel expanded by 16.8% for the four weeks ended July 11, compared to 11.4% growth for the four weeks ended June 13.
Figure 1. CPG E-Commerce and Total Sales Growth (YoY % Change) [caption id="attachment_131053" align="aligncenter" width="700"]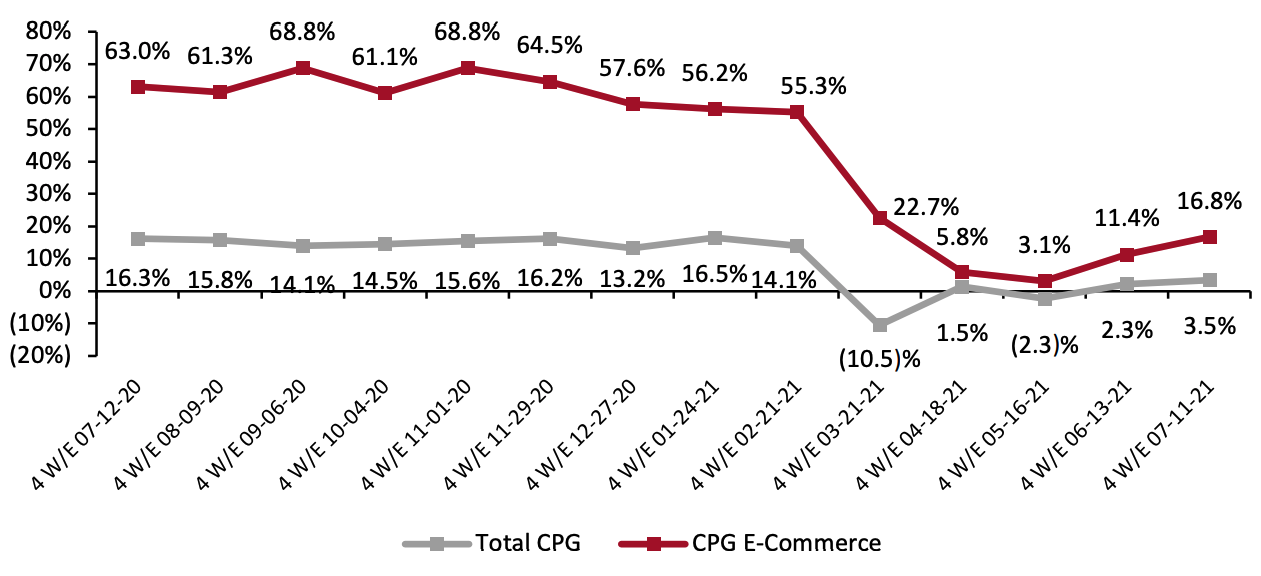 Historical data have been revised for the latest period
Source: IRI E-Market Insights™/Coresight Research[/caption] Compared to the same period in 2019, CPG e-commerce sales have shown strong, positive growth of 90.4% for the four weeks ended July 11, 2021—indicating that online CPG sales remain high versus pre-pandemic levels.
Figure 2. CPG E-Commerce and Total Sales Growth (% Change From Two Years Prior) [caption id="attachment_131047" align="aligncenter" width="700"]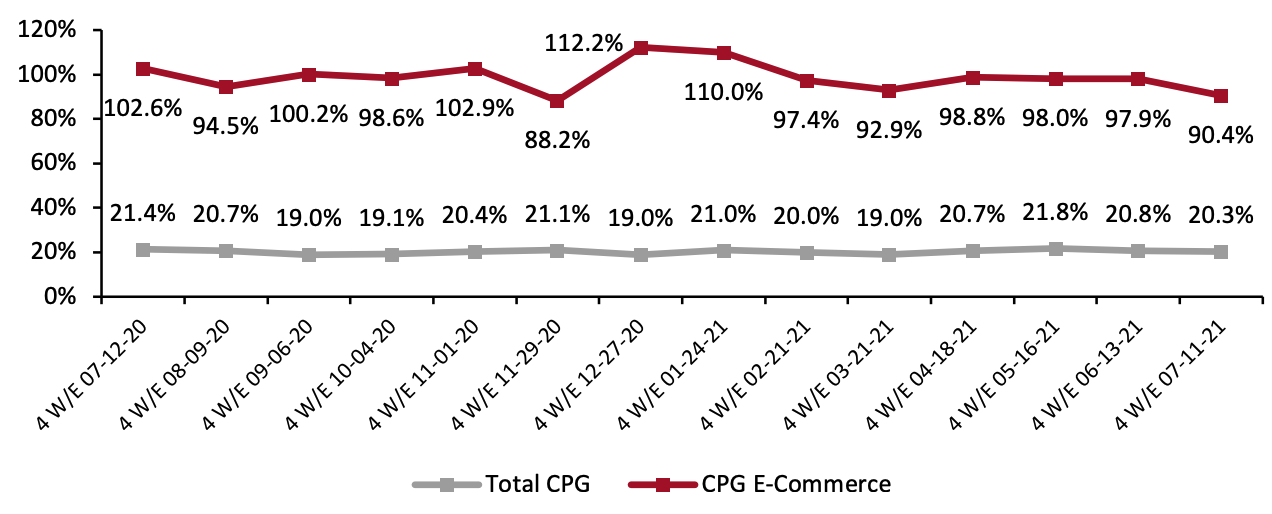 Historical data have been revised for the latest period
Source: IRI E-Market Insights™/Coresight Research[/caption] 2. Food & Beverage Online Sales Growth Slows Online food & beverage sales slowed to 9.9% year over year after posting an uptick of 13.8% in the previous period. It is worth noting that the food & beverage category continues to see high online growth relative to other categories when compared on a two-year basis—rising by 113.1% for the latest period ended July 11, 2021. Coresight Research estimates that US food & beverage e-commerce sales will slow down to 11% year over year in 2021, as consumers return to on-premise consumption and are increasingly willing to shop in stores. Nevertheless, we expect the slowdown to be temporary, with pandemic-induced channel stickiness supporting solid online growth in 2022 and beyond. General merchandise & homecare has seen its year-over-year growth trend upward for three consecutive periods, while health & beauty has accelerated for two. Online sales in both categories remain significantly elevated from 2019 levels.
Figure 3. E-Commerce CPG Sales Growth, by Category Type (YoY % Change) [caption id="attachment_131048" align="aligncenter" width="700"]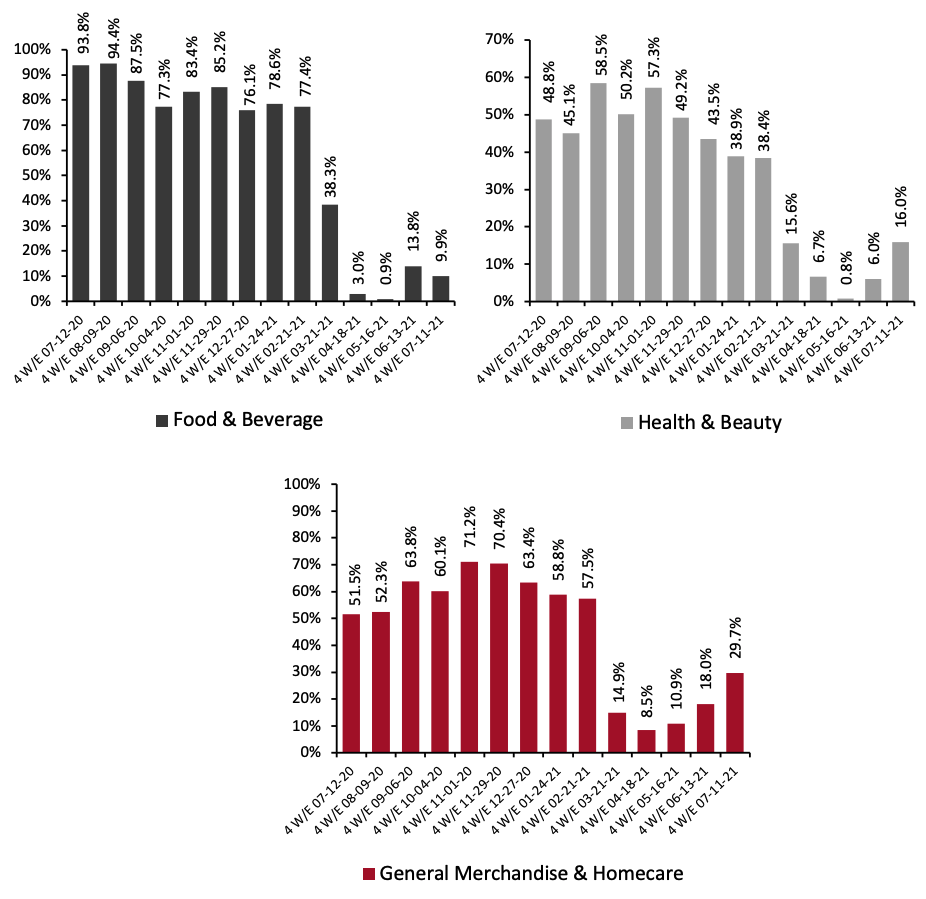 Historical data have been revised in the latest period
Source: IRI E-Market Insights™/Coresight Research[/caption]
Figure 4. E-Commerce CPG Sales Growth, by Category Type (% Change from Two Years Prior) [caption id="attachment_131049" align="aligncenter" width="700"]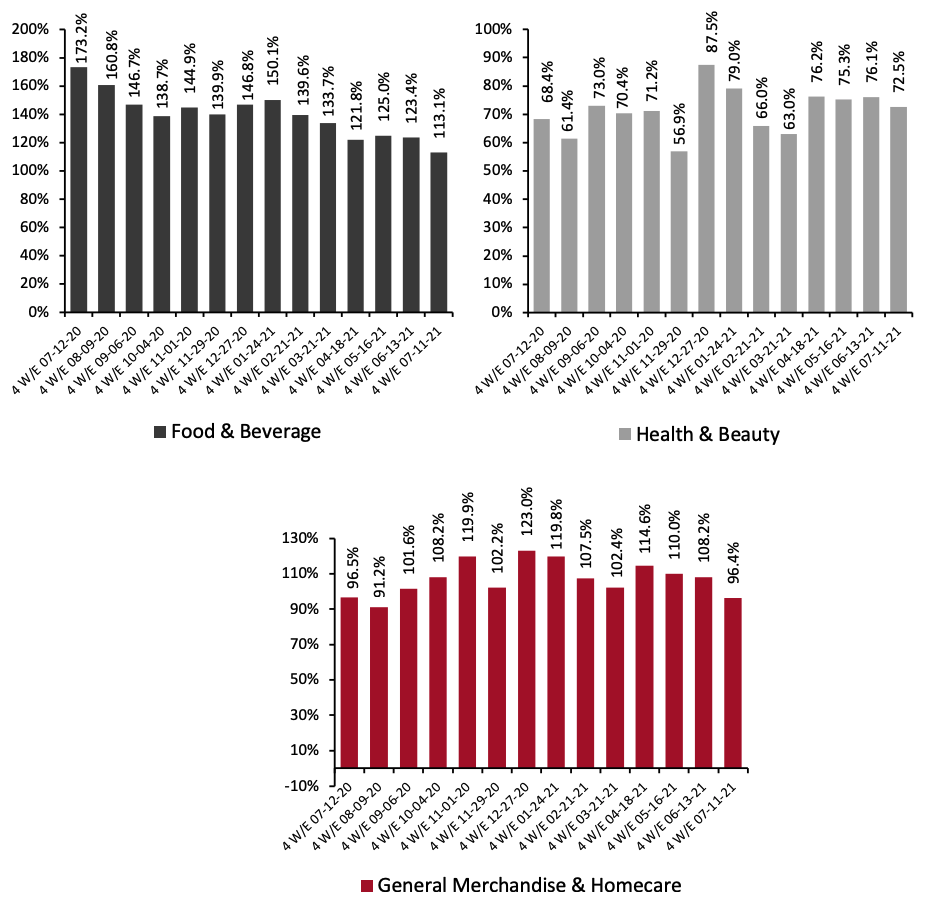 Historical data have been revised in the latest period
Source: IRI E-Market Insights™/Coresight Research[/caption] 3. Breakdown of Online CPG Sales: Food & Beverage Trending Downward The chart below shows the breakdown of online sales by type of CPG category. Health & beauty’s online share stayed almost flat relative to the last period, at 41.8% for the four weeks ended July 11, 2021. General merchandise & homecare picked up again to reach 24.5%, while food & beverage’s share declined by 1.1 percentage points to 33.7%.
Figure 5. CPG E-Commerce: Breakdown of Sales Share by Category (%) [caption id="attachment_131050" align="aligncenter" width="700"]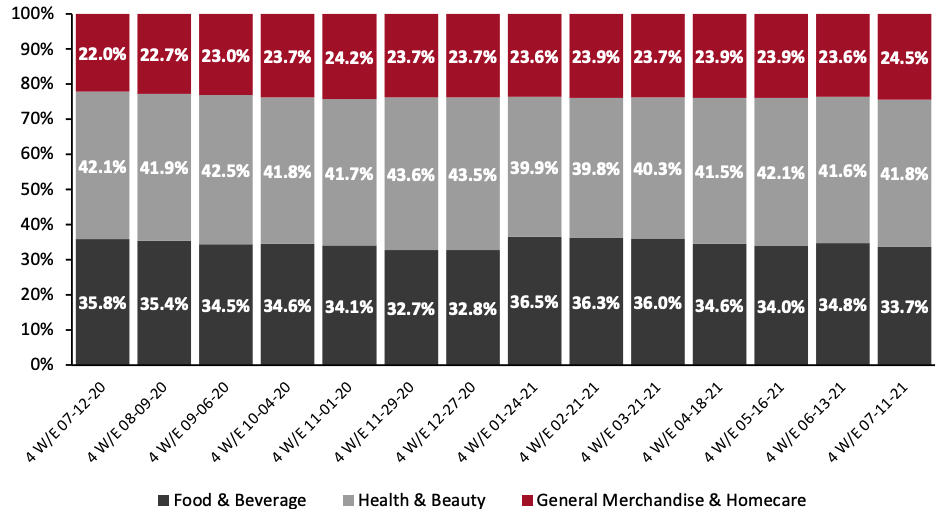 Source: IRI E-Market Insights™/Coresight Research[/caption]
4. The Beverages Department Outpaces Other Food Departments in Online Sales
Among the major food departments charted below, beverages saw substantial gains in year-over-year online sales, growing 20.7% from the comparable period in 2020 and 102.2% from 2019. Online growth was driven by coffee creamer (up 36.3% from 2020), sports drinks (up 32.7% from 2020), and ready-to-drink tea & coffee beverages (up 27.8% from 2020)
Total sales of frozen food, which has been in high demand during the crisis, grew by just 0.5% year over year—partly due to strong comparatives for the same period in 2020, where sales rose around 25% (not shown in the below figure). However, frozen saw the highest two-year increase, relative to other food & beverage departments—surging 26.9% in total sales.
Source: IRI E-Market Insights™/Coresight Research[/caption]
4. The Beverages Department Outpaces Other Food Departments in Online Sales
Among the major food departments charted below, beverages saw substantial gains in year-over-year online sales, growing 20.7% from the comparable period in 2020 and 102.2% from 2019. Online growth was driven by coffee creamer (up 36.3% from 2020), sports drinks (up 32.7% from 2020), and ready-to-drink tea & coffee beverages (up 27.8% from 2020)
Total sales of frozen food, which has been in high demand during the crisis, grew by just 0.5% year over year—partly due to strong comparatives for the same period in 2020, where sales rose around 25% (not shown in the below figure). However, frozen saw the highest two-year increase, relative to other food & beverage departments—surging 26.9% in total sales.
Figure 6. Food & Beverage Departments: E-Commerce and Total Sales Growth, Four Weeks Ended July 11, 2021 (YoY and Yo2Y % Change) [caption id="attachment_131051" align="aligncenter" width="700"]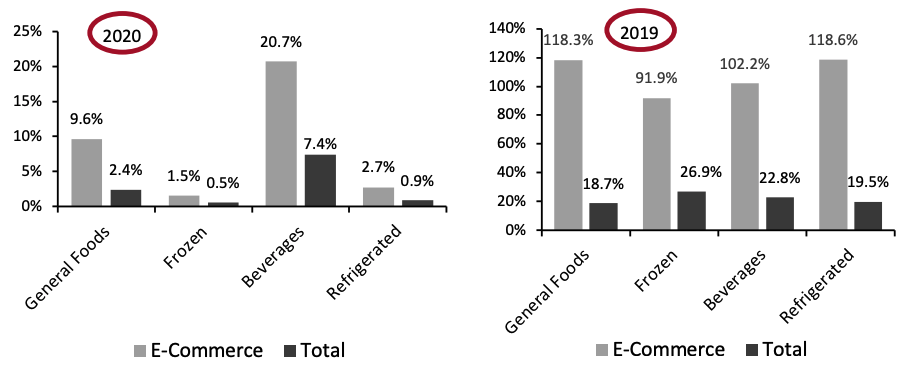 Source: IRI E-Market Insights™/Coresight Research[/caption]
Homecare Posted the Highest Online Growth Among Nonfood Departments
The homecare department saw 36.1% growth in online sales for the four weeks ended July 11—the highest growth relative to other nonfood departments. Growth was driven by online sales of home cleaning equipment, including mops and brooms (up 46.8%), household cleaners (up 42.7%) and laundry care (up 34.9%). Homecare online sales also outperformed other departments on two-year growth, surging by 117.4%.
Over the past year, homecare products have seen strong e-commerce growth as the pandemic has increased consumer emphasis on hygiene in the home. The department is likely to see a renewed surge in consumption as concerns over Covid-19 rise in the US again. According to Coresight Research’s US Consumer Tracker survey conducted on July 19, 2021, only 4.8% of respondents reported buying fewer hygiene products than before the pandemic—the lowest proportion recorded in our weekly surveys since May 31.
Figure 7. Nonfood Departments: E-Commerce and Total Sales Growth, Four Weeks Ended July 11, 2021 (YoY and Yo2Y % Change)
[caption id="attachment_131052" align="aligncenter" width="700"]
Source: IRI E-Market Insights™/Coresight Research[/caption]
Homecare Posted the Highest Online Growth Among Nonfood Departments
The homecare department saw 36.1% growth in online sales for the four weeks ended July 11—the highest growth relative to other nonfood departments. Growth was driven by online sales of home cleaning equipment, including mops and brooms (up 46.8%), household cleaners (up 42.7%) and laundry care (up 34.9%). Homecare online sales also outperformed other departments on two-year growth, surging by 117.4%.
Over the past year, homecare products have seen strong e-commerce growth as the pandemic has increased consumer emphasis on hygiene in the home. The department is likely to see a renewed surge in consumption as concerns over Covid-19 rise in the US again. According to Coresight Research’s US Consumer Tracker survey conducted on July 19, 2021, only 4.8% of respondents reported buying fewer hygiene products than before the pandemic—the lowest proportion recorded in our weekly surveys since May 31.
Figure 7. Nonfood Departments: E-Commerce and Total Sales Growth, Four Weeks Ended July 11, 2021 (YoY and Yo2Y % Change)
[caption id="attachment_131052" align="aligncenter" width="700"]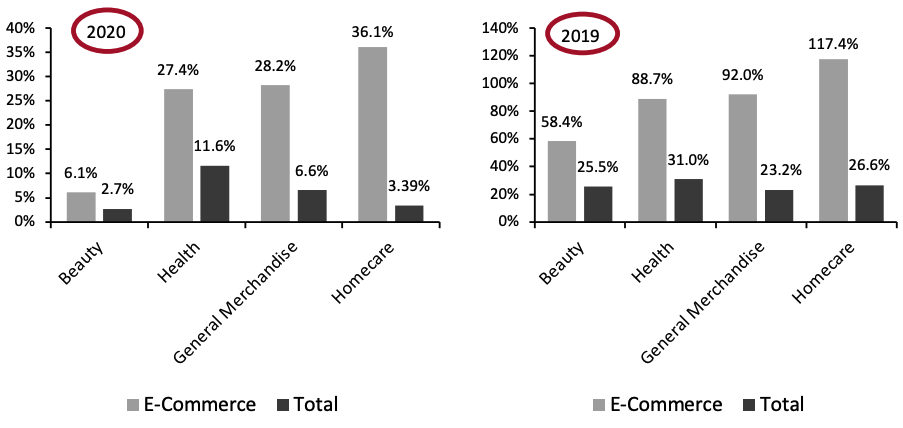 Source: IRI E-Market Insights™/Coresight Research[/caption]
What We Think
CPG e-commerce is showing impressive staying power: Despite a gradual return to in-store shopping, consumers are not abandoning online channels. Even against demanding comparatives, CPG e-commerce year-over-year growth has not yet turned negative. However, we expect that online food & beverage sales will show a greater year-over-year growth erosion through the year relative to nonfood categories, due to a potential rebound in restaurant spending and consumers’ increased willingness to purchase non-edibles online.
As fears of a Covid-19 resurgence and the potential reintroduction of pandemic restrictions mount, retailers must be ready for a possible further acceleration in online growth. They should be agile enough to rapidly increase capacity in a short period through various means, such as turning to additional physical stores to fulfill online orders and extending capacity for collection services including curbside pickup. CPG firms should also step up their digital game by diversifying to online channels, including selling directly to consumers through standalone e-commerce websites and partnering with online retailers.
Source: IRI E-Market Insights™/Coresight Research[/caption]
What We Think
CPG e-commerce is showing impressive staying power: Despite a gradual return to in-store shopping, consumers are not abandoning online channels. Even against demanding comparatives, CPG e-commerce year-over-year growth has not yet turned negative. However, we expect that online food & beverage sales will show a greater year-over-year growth erosion through the year relative to nonfood categories, due to a potential rebound in restaurant spending and consumers’ increased willingness to purchase non-edibles online.
As fears of a Covid-19 resurgence and the potential reintroduction of pandemic restrictions mount, retailers must be ready for a possible further acceleration in online growth. They should be agile enough to rapidly increase capacity in a short period through various means, such as turning to additional physical stores to fulfill online orders and extending capacity for collection services including curbside pickup. CPG firms should also step up their digital game by diversifying to online channels, including selling directly to consumers through standalone e-commerce websites and partnering with online retailers.
Figure 1. CPG E-Commerce and Total Sales Growth (YoY % Change) [caption id="attachment_131053" align="aligncenter" width="700"]
Historical data have been revised for the latest periodSource: IRI E-Market Insights™/Coresight Research[/caption] Compared to the same period in 2019, CPG e-commerce sales have shown strong, positive growth of 90.4% for the four weeks ended July 11, 2021—indicating that online CPG sales remain high versus pre-pandemic levels.
Figure 2. CPG E-Commerce and Total Sales Growth (% Change From Two Years Prior) [caption id="attachment_131047" align="aligncenter" width="700"]
Historical data have been revised for the latest periodSource: IRI E-Market Insights™/Coresight Research[/caption] 2. Food & Beverage Online Sales Growth Slows Online food & beverage sales slowed to 9.9% year over year after posting an uptick of 13.8% in the previous period. It is worth noting that the food & beverage category continues to see high online growth relative to other categories when compared on a two-year basis—rising by 113.1% for the latest period ended July 11, 2021. Coresight Research estimates that US food & beverage e-commerce sales will slow down to 11% year over year in 2021, as consumers return to on-premise consumption and are increasingly willing to shop in stores. Nevertheless, we expect the slowdown to be temporary, with pandemic-induced channel stickiness supporting solid online growth in 2022 and beyond. General merchandise & homecare has seen its year-over-year growth trend upward for three consecutive periods, while health & beauty has accelerated for two. Online sales in both categories remain significantly elevated from 2019 levels.
Figure 3. E-Commerce CPG Sales Growth, by Category Type (YoY % Change) [caption id="attachment_131048" align="aligncenter" width="700"]
Historical data have been revised in the latest periodSource: IRI E-Market Insights™/Coresight Research[/caption]
Figure 4. E-Commerce CPG Sales Growth, by Category Type (% Change from Two Years Prior) [caption id="attachment_131049" align="aligncenter" width="700"]
Historical data have been revised in the latest periodSource: IRI E-Market Insights™/Coresight Research[/caption] 3. Breakdown of Online CPG Sales: Food & Beverage Trending Downward The chart below shows the breakdown of online sales by type of CPG category. Health & beauty’s online share stayed almost flat relative to the last period, at 41.8% for the four weeks ended July 11, 2021. General merchandise & homecare picked up again to reach 24.5%, while food & beverage’s share declined by 1.1 percentage points to 33.7%.
Figure 5. CPG E-Commerce: Breakdown of Sales Share by Category (%) [caption id="attachment_131050" align="aligncenter" width="700"]
Source: IRI E-Market Insights™/Coresight Research[/caption]
4. The Beverages Department Outpaces Other Food Departments in Online Sales
Among the major food departments charted below, beverages saw substantial gains in year-over-year online sales, growing 20.7% from the comparable period in 2020 and 102.2% from 2019. Online growth was driven by coffee creamer (up 36.3% from 2020), sports drinks (up 32.7% from 2020), and ready-to-drink tea & coffee beverages (up 27.8% from 2020)
Total sales of frozen food, which has been in high demand during the crisis, grew by just 0.5% year over year—partly due to strong comparatives for the same period in 2020, where sales rose around 25% (not shown in the below figure). However, frozen saw the highest two-year increase, relative to other food & beverage departments—surging 26.9% in total sales.
Figure 6. Food & Beverage Departments: E-Commerce and Total Sales Growth, Four Weeks Ended July 11, 2021 (YoY and Yo2Y % Change) [caption id="attachment_131051" align="aligncenter" width="700"]
Source: IRI E-Market Insights™/Coresight Research[/caption]
Homecare Posted the Highest Online Growth Among Nonfood Departments
The homecare department saw 36.1% growth in online sales for the four weeks ended July 11—the highest growth relative to other nonfood departments. Growth was driven by online sales of home cleaning equipment, including mops and brooms (up 46.8%), household cleaners (up 42.7%) and laundry care (up 34.9%). Homecare online sales also outperformed other departments on two-year growth, surging by 117.4%.
Over the past year, homecare products have seen strong e-commerce growth as the pandemic has increased consumer emphasis on hygiene in the home. The department is likely to see a renewed surge in consumption as concerns over Covid-19 rise in the US again. According to Coresight Research’s US Consumer Tracker survey conducted on July 19, 2021, only 4.8% of respondents reported buying fewer hygiene products than before the pandemic—the lowest proportion recorded in our weekly surveys since May 31.
Figure 7. Nonfood Departments: E-Commerce and Total Sales Growth, Four Weeks Ended July 11, 2021 (YoY and Yo2Y % Change)
[caption id="attachment_131052" align="aligncenter" width="700"] Source: IRI E-Market Insights™/Coresight Research[/caption]
What We Think
CPG e-commerce is showing impressive staying power: Despite a gradual return to in-store shopping, consumers are not abandoning online channels. Even against demanding comparatives, CPG e-commerce year-over-year growth has not yet turned negative. However, we expect that online food & beverage sales will show a greater year-over-year growth erosion through the year relative to nonfood categories, due to a potential rebound in restaurant spending and consumers’ increased willingness to purchase non-edibles online.
As fears of a Covid-19 resurgence and the potential reintroduction of pandemic restrictions mount, retailers must be ready for a possible further acceleration in online growth. They should be agile enough to rapidly increase capacity in a short period through various means, such as turning to additional physical stores to fulfill online orders and extending capacity for collection services including curbside pickup. CPG firms should also step up their digital game by diversifying to online channels, including selling directly to consumers through standalone e-commerce websites and partnering with online retailers.
IRI Disclaimer: The information contained herein is based in part on data reported by the IRI E-Market Insights™ solution and as interpreted solely by Coresight Research. The information is believed to be reliable at the time supplied by IRI but is neither all-inclusive nor guaranteed by IRI or Coresight Research, Inc. Without limiting the generality of the foregoing, specific data points may vary considerably from other information sources. Any opinion expressed herein reflect the judgement of Coresight Research, Inc. and are subject to change. IRI disclaims liability of any kind arising from the use of this information.