Nitheesh NH
The Coresight Research and IRI monthly US CPG Sales Tracker provides our data-driven insights into online sales trends in the US CPG industry—covering the product categories of food & beverage; health & beauty; and general merchandise & homecare. In this report, we present five key insights into the four weeks ended February 21, 2021.
1. Online CPG Growth Continues to Decelerate
CPG e-commerce growth has decelerated for the fourth consecutive period. Online growth fell to 53.1% for the weeks ended February 21, compared to 55.4% in the prior period. Total CPG sales growth also slipped, from 15.4% to 12.4%.
The steady online deceleration, seen November, suggests that people are becoming more comfortable returning to brick-and-mortar stores for CPG shopping: According to our US Consumer Tracker, online purchasing of CPG products has fluctuated since December 2020, and the avoidance rate of any public area (including retail outlets) has been declining in recent weeks.
Figure 1. CPG E-Commerce and Total Sales Growth (YoY % Change) [caption id="attachment_125470" align="aligncenter" width="710"]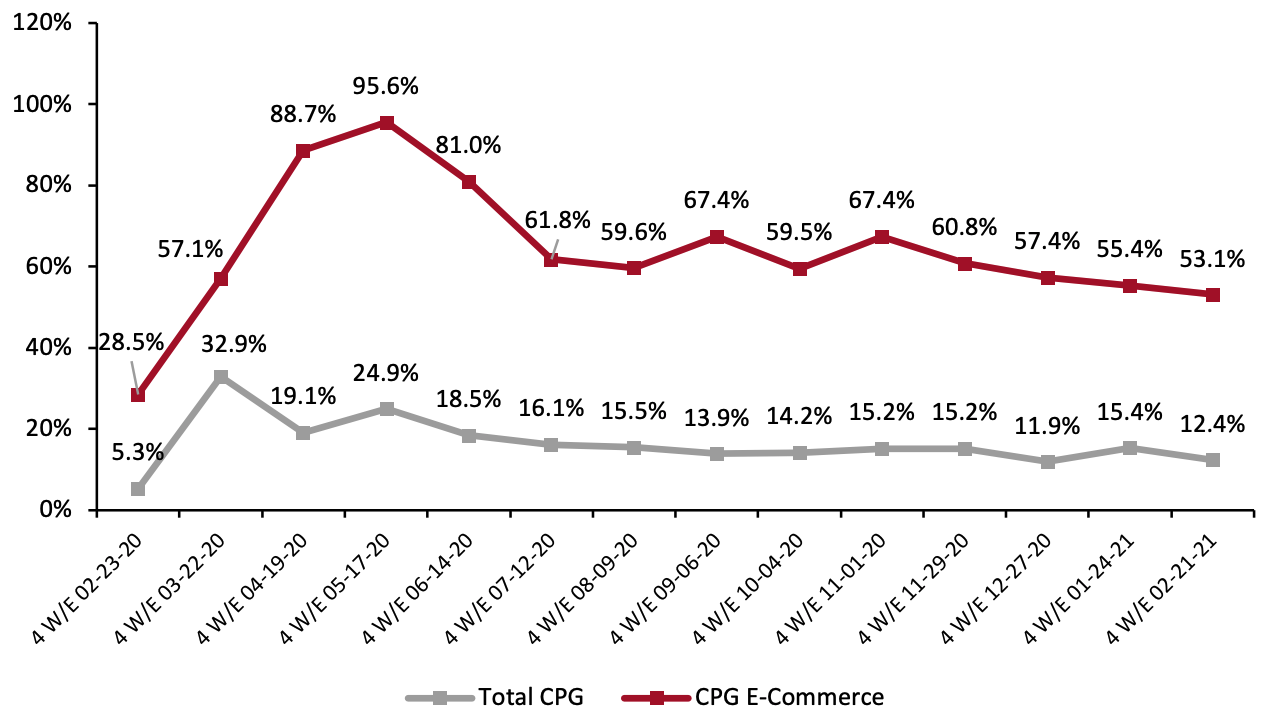 Historical data have been revised for the latest period
Source: IRI-E-Market Insights™/Coresight Research[/caption] 2. Food & Beverage Reports the Highest Growth in Online Sales The food & beverage category continues to experience high online growth relative to other categories, reaching 71.0% for the four weeks ended February. However, this is slower growth than the 75.4% reported in the period ended January 24. Food & beverage, health & beauty and general merchandise & homecare have all witnessed declines in online growth during the latest period (see Figure 2).
Figure 2. E-Commerce CPG Sales Growth, by Category Type (YoY % Change) [caption id="attachment_125471" align="aligncenter" width="710"]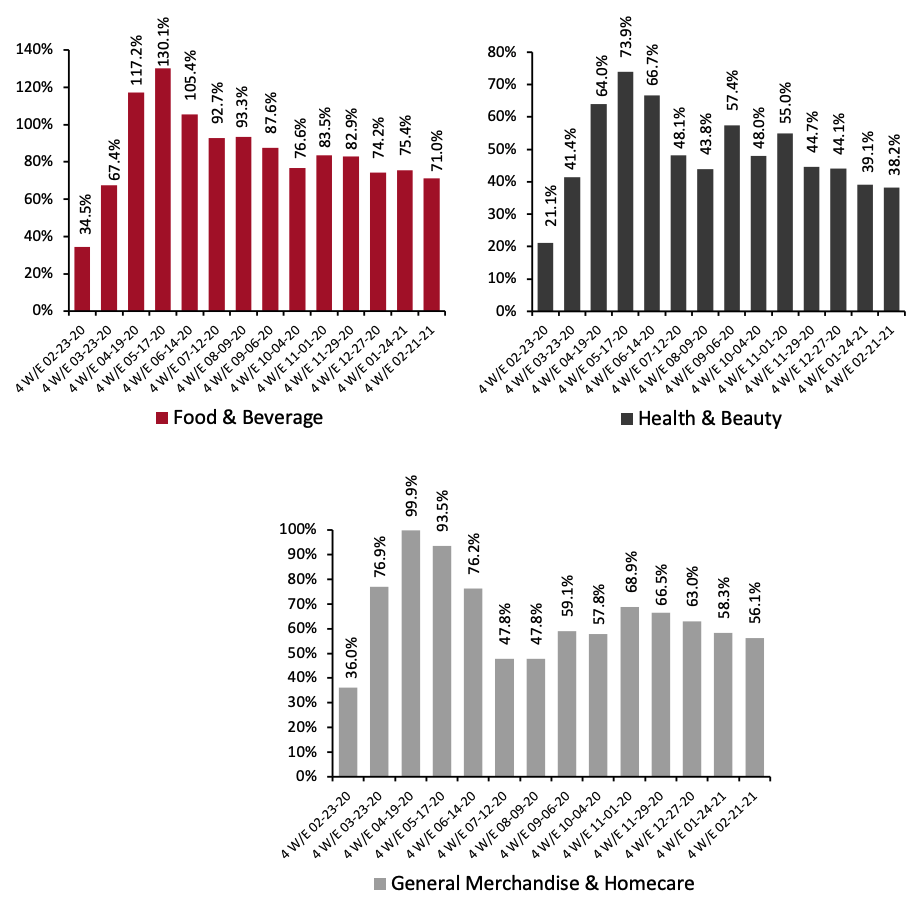 Historical data have been revised in the latest period
Source: IRI E-Market Insights™/Coresight Research[/caption] 3. Breakdown of Online CPG Sales: General Merchandise & Homecare Sees a Marginal Increase in Sales Share The chart below shows the breakdown of online sales by type of CPG category. The general merchandise & homecare category saw a marginal increase in sales share, at 23.1% in the latest period from 22.6% in January. Although its share remains high, the food & beverage category saw a slight decline in the four weeks ended February 21, from 37.3% to 36.8%. This aligns with Coresight Research’s US consumer survey from February 22, which found that online food and beverage purchases during the prior two weeks dropped sharply, by almost nine percentage points, to the lowest level since we started asking this question on November 24, 2020. Roughly one-fifth of respondents reported that they bought food and beverages online, from 28.2% in the February 15 survey.
Figure 3. CPG E-Commerce: Breakdown of Sales Share by Category (%) [caption id="attachment_125472" align="aligncenter" width="710"]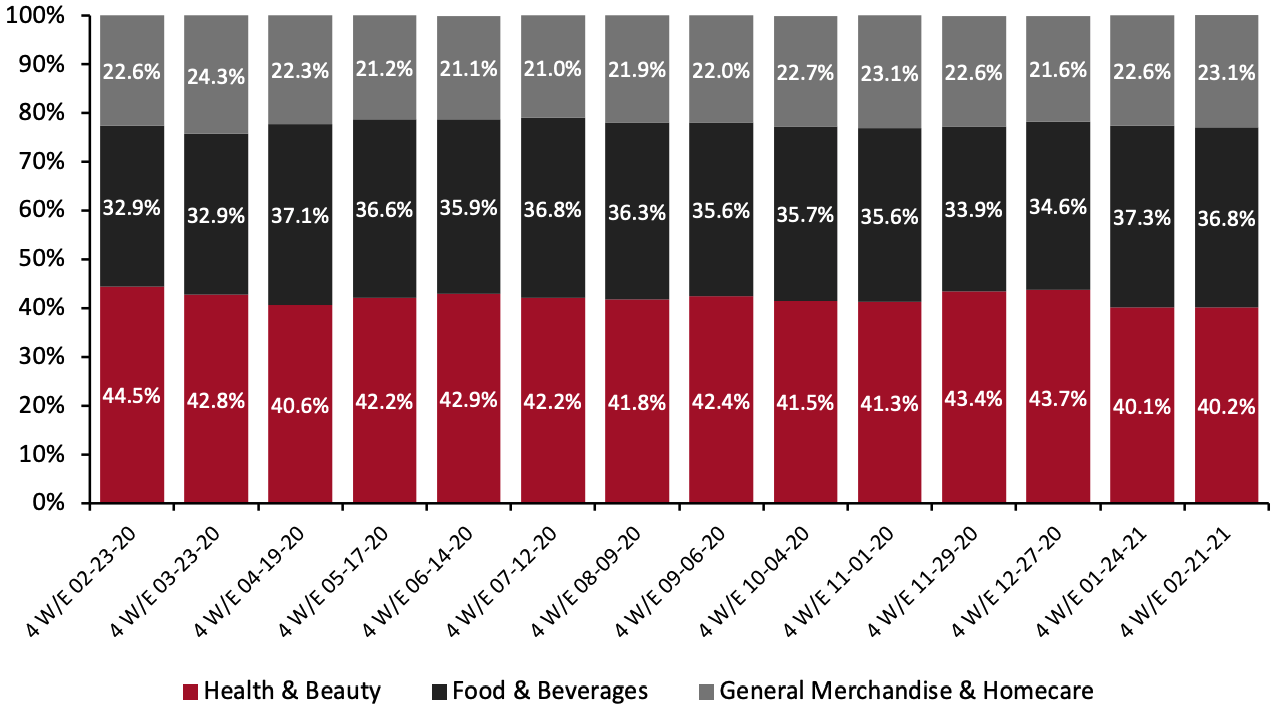 Source: IRI E-Market Insights™/Coresight Research [/caption]
4. Online Sales of Refrigerated Foods Continue to Gain Momentum
Among the major food & beverage departments charted below, refrigerated foods saw the biggest online gains for the four weeks ended February 21, with growth of 94.4% year over year, primarily driven by sour cream (up 179.4%), creams (up 178.0%) and refrigerated tea/coffee (176.8%).
Since the onset of the pandemic, frozen food has been one of the most popular departments purchased online, with more consumers preparing their own meals at home rather than dining out. In February 2021, Alison Bodor, President and CEO of the American Frozen Food Institute (AFFI), stated, “7% of consumers who rarely or never purchased frozen foods pre-pandemic are now doing so.” For the latest period, online sales growth of frozen food was driven by processed poultry (up 138.5%), prepared vegetables (up 135.8%), and frozen pies (up 113.8%).
Source: IRI E-Market Insights™/Coresight Research [/caption]
4. Online Sales of Refrigerated Foods Continue to Gain Momentum
Among the major food & beverage departments charted below, refrigerated foods saw the biggest online gains for the four weeks ended February 21, with growth of 94.4% year over year, primarily driven by sour cream (up 179.4%), creams (up 178.0%) and refrigerated tea/coffee (176.8%).
Since the onset of the pandemic, frozen food has been one of the most popular departments purchased online, with more consumers preparing their own meals at home rather than dining out. In February 2021, Alison Bodor, President and CEO of the American Frozen Food Institute (AFFI), stated, “7% of consumers who rarely or never purchased frozen foods pre-pandemic are now doing so.” For the latest period, online sales growth of frozen food was driven by processed poultry (up 138.5%), prepared vegetables (up 135.8%), and frozen pies (up 113.8%).
Figure 4. Food & Beverage Departments: E-Commerce and Total Sales Growth, Four Weeks Ended February 21, 2021 (YoY % Change) [caption id="attachment_125473" align="aligncenter" width="710"]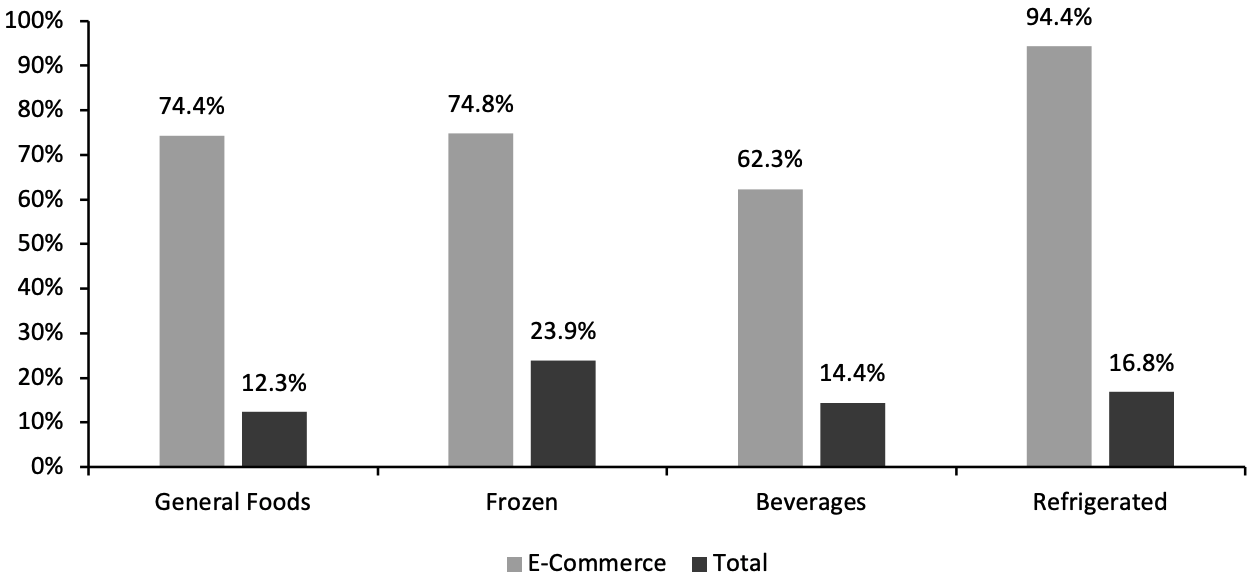 Source: IRI E-Market Insights™/Coresight Research[/caption]
5. Homecare Posts the Strongest Online and Total Growth Among Nonfood Departments
The homecare department saw 62.5% growth in online sales for the period ended February 21—the highest growth relative to other nonfood departments. This was driven online sales of fabric or rug cleaners (up 166.9%), cleaning tools (up 95.5%) and laundry care (up 73.3%).
Over the past year, we have witnessed strong e-commerce growth in homecare products as the pandemic has increased consumer emphasis on maintaining hygiene in the home.
Source: IRI E-Market Insights™/Coresight Research[/caption]
5. Homecare Posts the Strongest Online and Total Growth Among Nonfood Departments
The homecare department saw 62.5% growth in online sales for the period ended February 21—the highest growth relative to other nonfood departments. This was driven online sales of fabric or rug cleaners (up 166.9%), cleaning tools (up 95.5%) and laundry care (up 73.3%).
Over the past year, we have witnessed strong e-commerce growth in homecare products as the pandemic has increased consumer emphasis on maintaining hygiene in the home.
Figure 5. Nonfood Departments: E-Commerce and Total Sales Growth, Four Weeks Ended February 21, 2021 (YoY % Change) [caption id="attachment_125474" align="aligncenter" width="710"]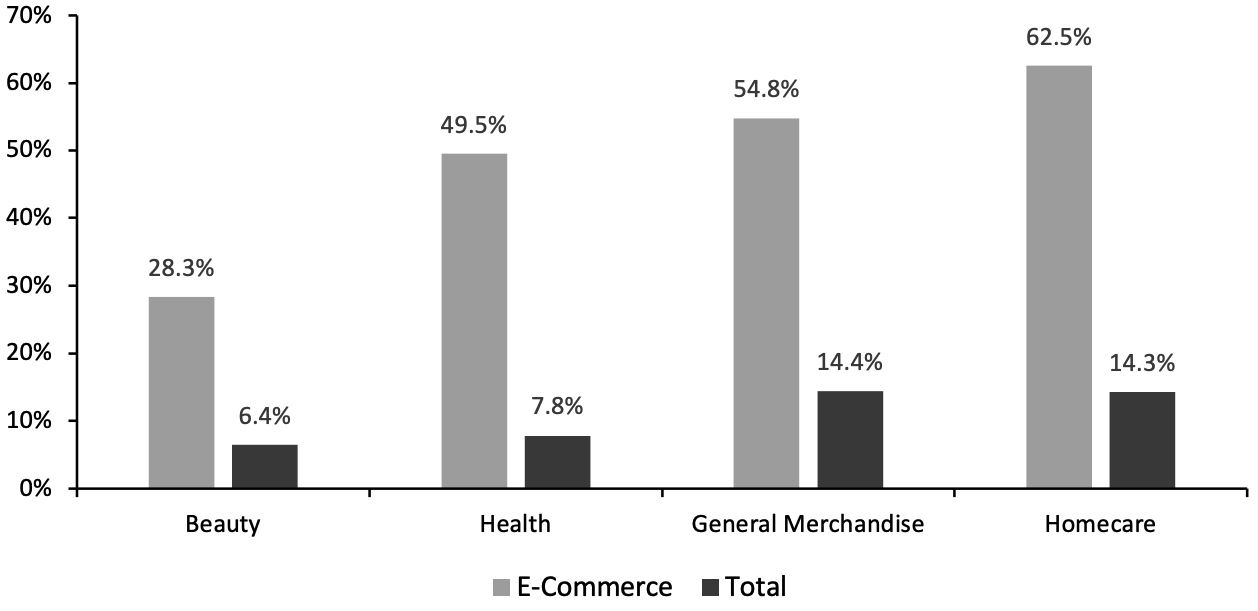 Source: IRI E-Market Insights™/Coresight Research[/caption]
Figure 1. CPG E-Commerce and Total Sales Growth (YoY % Change) [caption id="attachment_125470" align="aligncenter" width="710"]
Historical data have been revised for the latest periodSource: IRI-E-Market Insights™/Coresight Research[/caption] 2. Food & Beverage Reports the Highest Growth in Online Sales The food & beverage category continues to experience high online growth relative to other categories, reaching 71.0% for the four weeks ended February. However, this is slower growth than the 75.4% reported in the period ended January 24. Food & beverage, health & beauty and general merchandise & homecare have all witnessed declines in online growth during the latest period (see Figure 2).
Figure 2. E-Commerce CPG Sales Growth, by Category Type (YoY % Change) [caption id="attachment_125471" align="aligncenter" width="710"]
Historical data have been revised in the latest periodSource: IRI E-Market Insights™/Coresight Research[/caption] 3. Breakdown of Online CPG Sales: General Merchandise & Homecare Sees a Marginal Increase in Sales Share The chart below shows the breakdown of online sales by type of CPG category. The general merchandise & homecare category saw a marginal increase in sales share, at 23.1% in the latest period from 22.6% in January. Although its share remains high, the food & beverage category saw a slight decline in the four weeks ended February 21, from 37.3% to 36.8%. This aligns with Coresight Research’s US consumer survey from February 22, which found that online food and beverage purchases during the prior two weeks dropped sharply, by almost nine percentage points, to the lowest level since we started asking this question on November 24, 2020. Roughly one-fifth of respondents reported that they bought food and beverages online, from 28.2% in the February 15 survey.
Figure 3. CPG E-Commerce: Breakdown of Sales Share by Category (%) [caption id="attachment_125472" align="aligncenter" width="710"]
Source: IRI E-Market Insights™/Coresight Research [/caption]
4. Online Sales of Refrigerated Foods Continue to Gain Momentum
Among the major food & beverage departments charted below, refrigerated foods saw the biggest online gains for the four weeks ended February 21, with growth of 94.4% year over year, primarily driven by sour cream (up 179.4%), creams (up 178.0%) and refrigerated tea/coffee (176.8%).
Since the onset of the pandemic, frozen food has been one of the most popular departments purchased online, with more consumers preparing their own meals at home rather than dining out. In February 2021, Alison Bodor, President and CEO of the American Frozen Food Institute (AFFI), stated, “7% of consumers who rarely or never purchased frozen foods pre-pandemic are now doing so.” For the latest period, online sales growth of frozen food was driven by processed poultry (up 138.5%), prepared vegetables (up 135.8%), and frozen pies (up 113.8%).
Figure 4. Food & Beverage Departments: E-Commerce and Total Sales Growth, Four Weeks Ended February 21, 2021 (YoY % Change) [caption id="attachment_125473" align="aligncenter" width="710"]
Source: IRI E-Market Insights™/Coresight Research[/caption]
5. Homecare Posts the Strongest Online and Total Growth Among Nonfood Departments
The homecare department saw 62.5% growth in online sales for the period ended February 21—the highest growth relative to other nonfood departments. This was driven online sales of fabric or rug cleaners (up 166.9%), cleaning tools (up 95.5%) and laundry care (up 73.3%).
Over the past year, we have witnessed strong e-commerce growth in homecare products as the pandemic has increased consumer emphasis on maintaining hygiene in the home.
Figure 5. Nonfood Departments: E-Commerce and Total Sales Growth, Four Weeks Ended February 21, 2021 (YoY % Change) [caption id="attachment_125474" align="aligncenter" width="710"]
Source: IRI E-Market Insights™/Coresight Research[/caption]
What We Think
Covid-19 cases in the US have been declining for more than five consecutive weeks, as have the number of new hospitalizations. In light of vaccination rollouts, US consumers are beginning to return to stores, reflected in the marginal decline in the growth of online CPG sales observed in the latest period. However, CPG e-commerce growth remains high (over 50.0%), and many retailers expect the pandemic-led shift to the online channel to at least partially stick moving forward. In February 2021, Walmart announced plans to invest $14 billion in fiscal 2022 in automation, supply chain and improvements to the customer experience—including building its e-commerce capabilities, following its huge online sales growth of 79.0% in fiscal 2021 (ended January 31, 2020). In addition, as the DTC (direct-to-consumer) trend becomes more embedded in the CPG industry, we expect more players to focus on enhancing their e-commerce capabilities. PepsiCo has begun to do this: According to Ramon Laguarta, Chairman and CEO of PepsiCo, the company has been “making the necessary investments in [its] manufacturing capacity, go-to-market systems and digital initiatives such as improving [its] presence and scale in the e-commerce business, which nearly doubled during the third quarter.” We expect CPG players to capitalize on the e-commerce trend even after the pandemic comes to an end.IRI Disclaimer: The information contained herein is based in part on data reported by the IRI E-Market Insights™ solution and as interpreted solely by Coresight Research. The information is believed to be reliable at the time supplied by IRI but is neither all-inclusive nor guaranteed by IRI or Coresight Research, Inc. Without limiting the generality of the foregoing, specific data points may vary considerably from other information sources. Any opinion expressed herein reflect the judgement of Coresight Research, Inc. and are subject to change. IRI disclaims liability of any kind arising from the use of this information.