Nitheesh NH
The Coresight Research and IRI monthly US CPG Sales Tracker provides our data-driven insights into online sales trends in the US CPG industry—covering the product categories of food & beverage; health & beauty; and general merchandise & homecare. In this report, we present five key insights into the four weeks ended November 29, 2020.
1. Online CPG Growth Stays Strong
CPG e-commerce continues to put up a strong performance, soaring by 63% for the four weeks ended November 29. The growth was supported by consumers turning to online channels for the holiday season, given the recent escalation of coronavirus cases in many US states.
Typical celebratory on-premise consumption, which tends to spike in the last quarter of every year, will suffer due to socializing restrictions. According to the Coresight Research consumer survey undertaken on December 8, almost half of respondents who expect to spend less this holiday season said that they plan to spend less or have spent less on dining out or going to a bar/nightclub.
As December holiday celebrations shift to at-home consumption, with small get-togethers or household activities rather than dining out or attending social events, we believe that CPG firms and grocery retailers will be the major beneficiaries of holiday spending.
Figure 1. CPG E-Commerce and Total Sales Growth (YoY % Change)
[caption id="attachment_121226" align="aligncenter" width="700"]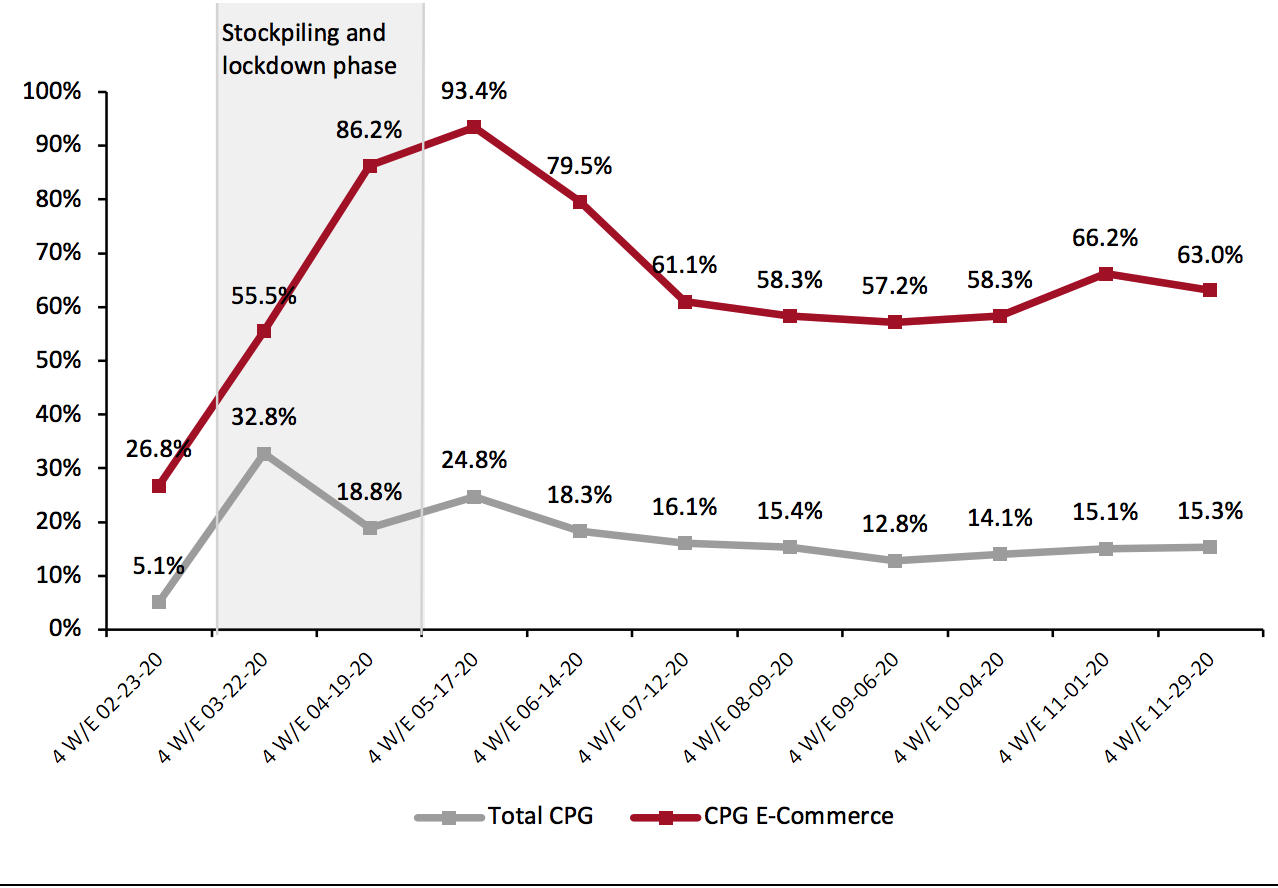 Historical data have been revised for the latest period
Source: IRI E-Market Insights™/Coresight Research[/caption] 2. Food & Beverage Continues To Experience Online Surge Food & beverage continues to experience high online growth relative to other categories, soaring by 84.2% for the four weeks ended November 29. Several grocery retailers are benefiting from the strong grocery e-commerce trend. For example, Kroger’s digital sales surged by 108% for the third fiscal quarter ended November 7, 2020, buoyed by sustained at-home consumption trends. As consumers continue to stay in and cook at home, the company said that it has secured an additional 5,000 truckloads of inventory and increased its distribution capacity reserves by 20% to avoid any potential supply chain disruptions over the holiday season. General merchandise & homecare maintained its upward growth trend, strengthening for four periods in a row. Health & beauty saw a softening of growth in the latest period, decreasing from 54.6% for the four weeks ended November 1 to 48.3% for the four weeks ended November 29 (slowing by 6.3 percentage points). Figure 2. E-Commerce CPG Sales Growth, by Category Type (YoY % Change) [caption id="attachment_121227" align="aligncenter" width="700"]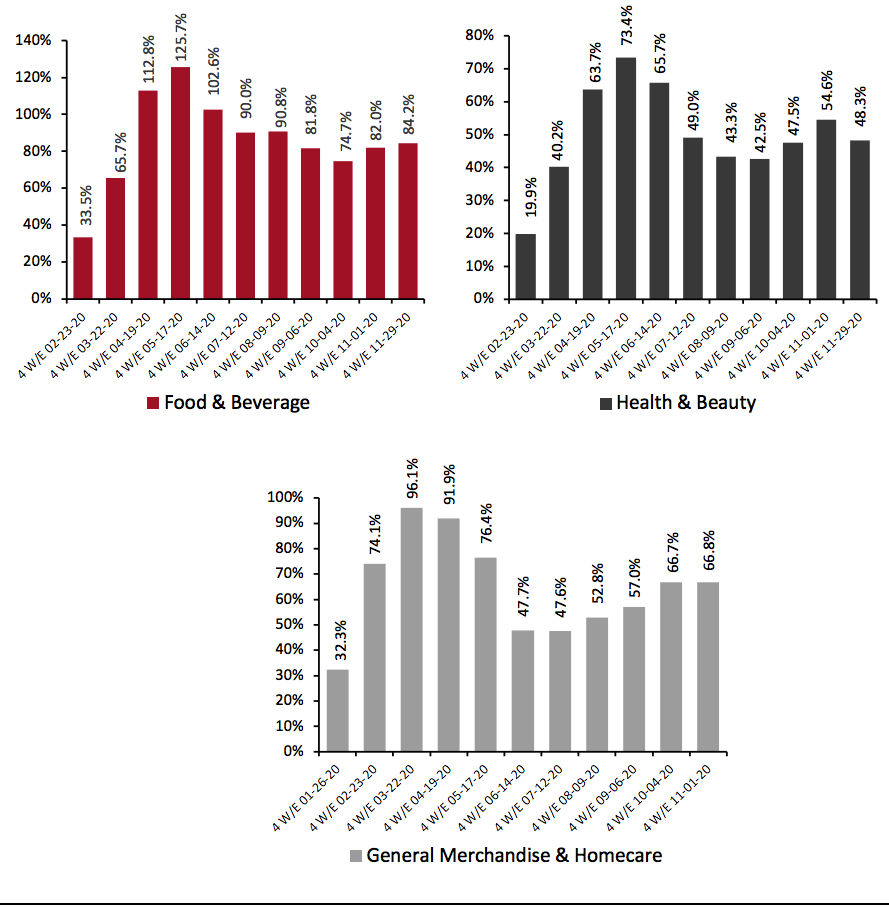 Historical data have been revised in the latest period
Source: IRI E-Market Insights™/Coresight Research[/caption] 3. Breakdown of Online CPG Sales: General Merchandise & Homecare Trending Up The chart below shows the breakdown of online sales by type of CPG category. General merchandise & homecare, which contributes nearly half of online CPG dollar sales, picked up again to reach 43.5% for the four weeks ended November 29, 2020. Meanwhile, health & beauty’s online share stayed flat relative to the last period, at around 23%. Figure 3. CPG E-Commerce: Breakdown of Sales Share by Category (%) [caption id="attachment_121229" align="aligncenter" width="700"]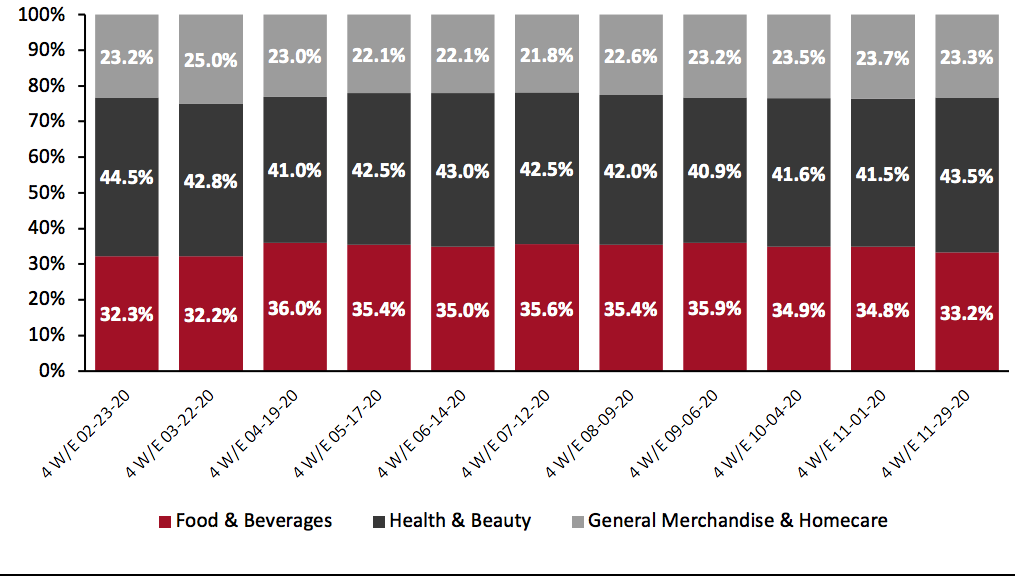 Historical data have been revised in the latest period
Source: IRI E-Market Insights™/Coresight Research [/caption] 4. Refrigerated Foods Outpaces Other Food Departments in Online Sales Total food & beverage sales stayed healthy, growing by 15.1% for the latest period compared to a 15.0% increase in the prior period. Several retailers said that they are holding more inventory than normal this holiday season to counter any potential hoarding. Among the major groupings charted below, refrigerated foods saw the biggest online gains in the four weeks ended November 29, with growth of 92.4% versus last year, driven by creams (up 184%), juices (up 152%) and tea/coffee (up 144%). Frozen foods’ popularity swelled early in the pandemic and is still not showing any signs of abatement. Frozen food sales continue to outperform other food departments in total sales, climbing by 23.1% for the latest period, driven by seafood (up 38%), meat (up 37%) and processed poultry (up 32%). In a “Albertsons Insights” analyst call held on December 7, Albertsons said that as consumers are not going out to restaurants to eat seafood—which is how it is typically consumed—they are buying frozen seafood to eat at home, instead leading to a spike in purchases. Figure 4. Food & Beverage Departments: E-Commerce and Total Sales Growth, Four Weeks Ended November 29, 2020 (YoY %) [caption id="attachment_121230" align="aligncenter" width="700"]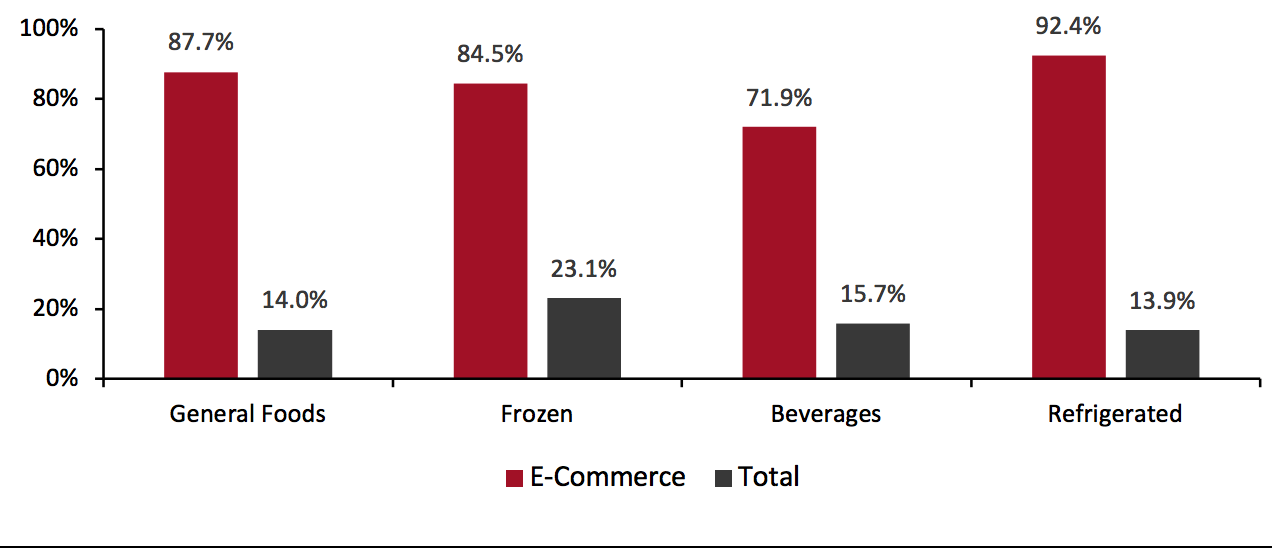 Source: IRI E-Market Insights™/Coresight Research[/caption]
1. General Merchandise Posted the Strongest Online Growth Among Nonfood Departments
General merchandise—which consists of a wide range of nonfood items, such as batteries, culinary items, pet food, paper napkins and towels, and pest control items—observed the highest online growth of 66.9% for four weeks ended November 29, 2020. The growth was driven by cups and plates (up 139%), pet supplies (up 128%) and toilet tissues (up 117.8%).
Homecare products saw the highest total growth among the nonfood departments at 28.8%, driven by household cleaning essentials such as household cleaners (up 60%), bleach (52%) and cleaning tools (up 38%).
Household cleaning products remain at the top of consumers’ shopping lists. In its analyst call held on November 18, Clorox reported that it continues to run its plants 24 hours a day, seven days a week, to meet the ongoing elevated demand for disinfecting products. This trend is also supported by the Coresight Research consumer survey conducted on December 8, which found that a substantial 40.2% of US consumers are currently buying more household items, such as cleaning or laundry products, than pre-crisis.
Figure 5. Nonfood Departments: E-Commerce and Total Sales Growth, Four Weeks Ended November 29, 2020 (YoY %)
[caption id="attachment_121231" align="aligncenter" width="700"]
Source: IRI E-Market Insights™/Coresight Research[/caption]
1. General Merchandise Posted the Strongest Online Growth Among Nonfood Departments
General merchandise—which consists of a wide range of nonfood items, such as batteries, culinary items, pet food, paper napkins and towels, and pest control items—observed the highest online growth of 66.9% for four weeks ended November 29, 2020. The growth was driven by cups and plates (up 139%), pet supplies (up 128%) and toilet tissues (up 117.8%).
Homecare products saw the highest total growth among the nonfood departments at 28.8%, driven by household cleaning essentials such as household cleaners (up 60%), bleach (52%) and cleaning tools (up 38%).
Household cleaning products remain at the top of consumers’ shopping lists. In its analyst call held on November 18, Clorox reported that it continues to run its plants 24 hours a day, seven days a week, to meet the ongoing elevated demand for disinfecting products. This trend is also supported by the Coresight Research consumer survey conducted on December 8, which found that a substantial 40.2% of US consumers are currently buying more household items, such as cleaning or laundry products, than pre-crisis.
Figure 5. Nonfood Departments: E-Commerce and Total Sales Growth, Four Weeks Ended November 29, 2020 (YoY %)
[caption id="attachment_121231" align="aligncenter" width="700"]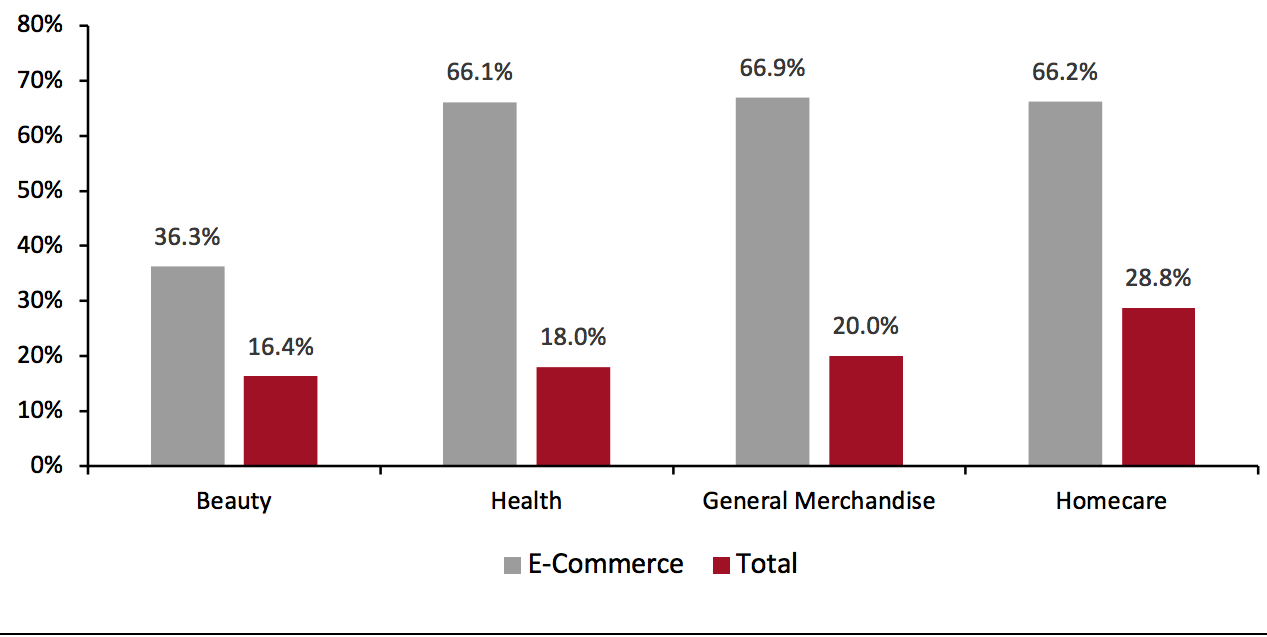 Source: IRI E-Market Insights™/Coresight Research[/caption]
What We Think
The Covid-19 upheaval has further strengthened the prospect of CPG e-commerce in 2020, with the online channel’s period-wise growth staying considerably higher than the pre-pandemic growth figures. Given the current high rate of new coronavirus cases in some states in the US and that the government is in the early stages of the vaccine roll-out, we expect the health crisis to last past March 2021, sustaining at-home food consumption trends. This period will continue to create and reinforce online purchasing behavior, and e-commerce will likely become more deeply embedded into shoppers’ shopping habits well beyond the pandemic. CPG firms must therefore place a bigger focus on diversifying their channels, including selling directly to consumers through standalone e-commerce websites and partnering with online retailers.
Source: IRI E-Market Insights™/Coresight Research[/caption]
What We Think
The Covid-19 upheaval has further strengthened the prospect of CPG e-commerce in 2020, with the online channel’s period-wise growth staying considerably higher than the pre-pandemic growth figures. Given the current high rate of new coronavirus cases in some states in the US and that the government is in the early stages of the vaccine roll-out, we expect the health crisis to last past March 2021, sustaining at-home food consumption trends. This period will continue to create and reinforce online purchasing behavior, and e-commerce will likely become more deeply embedded into shoppers’ shopping habits well beyond the pandemic. CPG firms must therefore place a bigger focus on diversifying their channels, including selling directly to consumers through standalone e-commerce websites and partnering with online retailers.
Historical data have been revised for the latest periodSource: IRI E-Market Insights™/Coresight Research[/caption] 2. Food & Beverage Continues To Experience Online Surge Food & beverage continues to experience high online growth relative to other categories, soaring by 84.2% for the four weeks ended November 29. Several grocery retailers are benefiting from the strong grocery e-commerce trend. For example, Kroger’s digital sales surged by 108% for the third fiscal quarter ended November 7, 2020, buoyed by sustained at-home consumption trends. As consumers continue to stay in and cook at home, the company said that it has secured an additional 5,000 truckloads of inventory and increased its distribution capacity reserves by 20% to avoid any potential supply chain disruptions over the holiday season. General merchandise & homecare maintained its upward growth trend, strengthening for four periods in a row. Health & beauty saw a softening of growth in the latest period, decreasing from 54.6% for the four weeks ended November 1 to 48.3% for the four weeks ended November 29 (slowing by 6.3 percentage points). Figure 2. E-Commerce CPG Sales Growth, by Category Type (YoY % Change) [caption id="attachment_121227" align="aligncenter" width="700"]
Historical data have been revised in the latest periodSource: IRI E-Market Insights™/Coresight Research[/caption] 3. Breakdown of Online CPG Sales: General Merchandise & Homecare Trending Up The chart below shows the breakdown of online sales by type of CPG category. General merchandise & homecare, which contributes nearly half of online CPG dollar sales, picked up again to reach 43.5% for the four weeks ended November 29, 2020. Meanwhile, health & beauty’s online share stayed flat relative to the last period, at around 23%. Figure 3. CPG E-Commerce: Breakdown of Sales Share by Category (%) [caption id="attachment_121229" align="aligncenter" width="700"]
Historical data have been revised in the latest periodSource: IRI E-Market Insights™/Coresight Research [/caption] 4. Refrigerated Foods Outpaces Other Food Departments in Online Sales Total food & beverage sales stayed healthy, growing by 15.1% for the latest period compared to a 15.0% increase in the prior period. Several retailers said that they are holding more inventory than normal this holiday season to counter any potential hoarding. Among the major groupings charted below, refrigerated foods saw the biggest online gains in the four weeks ended November 29, with growth of 92.4% versus last year, driven by creams (up 184%), juices (up 152%) and tea/coffee (up 144%). Frozen foods’ popularity swelled early in the pandemic and is still not showing any signs of abatement. Frozen food sales continue to outperform other food departments in total sales, climbing by 23.1% for the latest period, driven by seafood (up 38%), meat (up 37%) and processed poultry (up 32%). In a “Albertsons Insights” analyst call held on December 7, Albertsons said that as consumers are not going out to restaurants to eat seafood—which is how it is typically consumed—they are buying frozen seafood to eat at home, instead leading to a spike in purchases. Figure 4. Food & Beverage Departments: E-Commerce and Total Sales Growth, Four Weeks Ended November 29, 2020 (YoY %) [caption id="attachment_121230" align="aligncenter" width="700"]
Source: IRI E-Market Insights™/Coresight Research[/caption]
1. General Merchandise Posted the Strongest Online Growth Among Nonfood Departments
General merchandise—which consists of a wide range of nonfood items, such as batteries, culinary items, pet food, paper napkins and towels, and pest control items—observed the highest online growth of 66.9% for four weeks ended November 29, 2020. The growth was driven by cups and plates (up 139%), pet supplies (up 128%) and toilet tissues (up 117.8%).
Homecare products saw the highest total growth among the nonfood departments at 28.8%, driven by household cleaning essentials such as household cleaners (up 60%), bleach (52%) and cleaning tools (up 38%).
Household cleaning products remain at the top of consumers’ shopping lists. In its analyst call held on November 18, Clorox reported that it continues to run its plants 24 hours a day, seven days a week, to meet the ongoing elevated demand for disinfecting products. This trend is also supported by the Coresight Research consumer survey conducted on December 8, which found that a substantial 40.2% of US consumers are currently buying more household items, such as cleaning or laundry products, than pre-crisis.
Figure 5. Nonfood Departments: E-Commerce and Total Sales Growth, Four Weeks Ended November 29, 2020 (YoY %)
[caption id="attachment_121231" align="aligncenter" width="700"] Source: IRI E-Market Insights™/Coresight Research[/caption]
What We Think
The Covid-19 upheaval has further strengthened the prospect of CPG e-commerce in 2020, with the online channel’s period-wise growth staying considerably higher than the pre-pandemic growth figures. Given the current high rate of new coronavirus cases in some states in the US and that the government is in the early stages of the vaccine roll-out, we expect the health crisis to last past March 2021, sustaining at-home food consumption trends. This period will continue to create and reinforce online purchasing behavior, and e-commerce will likely become more deeply embedded into shoppers’ shopping habits well beyond the pandemic. CPG firms must therefore place a bigger focus on diversifying their channels, including selling directly to consumers through standalone e-commerce websites and partnering with online retailers.
IRI Disclaimer: The information contained herein is based in part on data reported by the IRI E-Market Insights™ solution and as interpreted solely by Coresight Research. The information is believed to be reliable at the time supplied by IRI but is neither all-inclusive nor guaranteed by IRI or Coresight Research, Inc. Without limiting the generality of the foregoing, specific data points may vary considerably from other information sources. Any opinion expressed herein reflect the judgement of Coresight Research, Inc. and are subject to change. IRI disclaims liability of any kind arising from the use of this information.