DIpil Das
The Coresight Research and IRI monthly US CPG Sales Tracker provides our data-driven insights into online sales trends in the US CPG industry—covering the product categories of food & beverage; health & beauty; and general merchandise & homecare. In this report, we present five key insights into the four weeks ended January 24, 2021.
1. Online CPG Growth Continues to Decelerate
CPG e-commerce growth has decelerated for three consecutive periods. Online growth slipped to 55.9% for the four weeks ended January 24, 2021, compared to 57.4% for the four weeks ended December 27, 2020. However, total CPG sales growth regained its momentum in the latest period, reaching 15.5% from previous growth of 11.9%. This may reflect that consumers have returned to stores in more significant numbers since the beginning of the year to do their CPG shopping.
Figure 1. CPG E-Commerce and Total Sales Growth (YoY % Change) [caption id="attachment_124511" align="aligncenter" width="725"]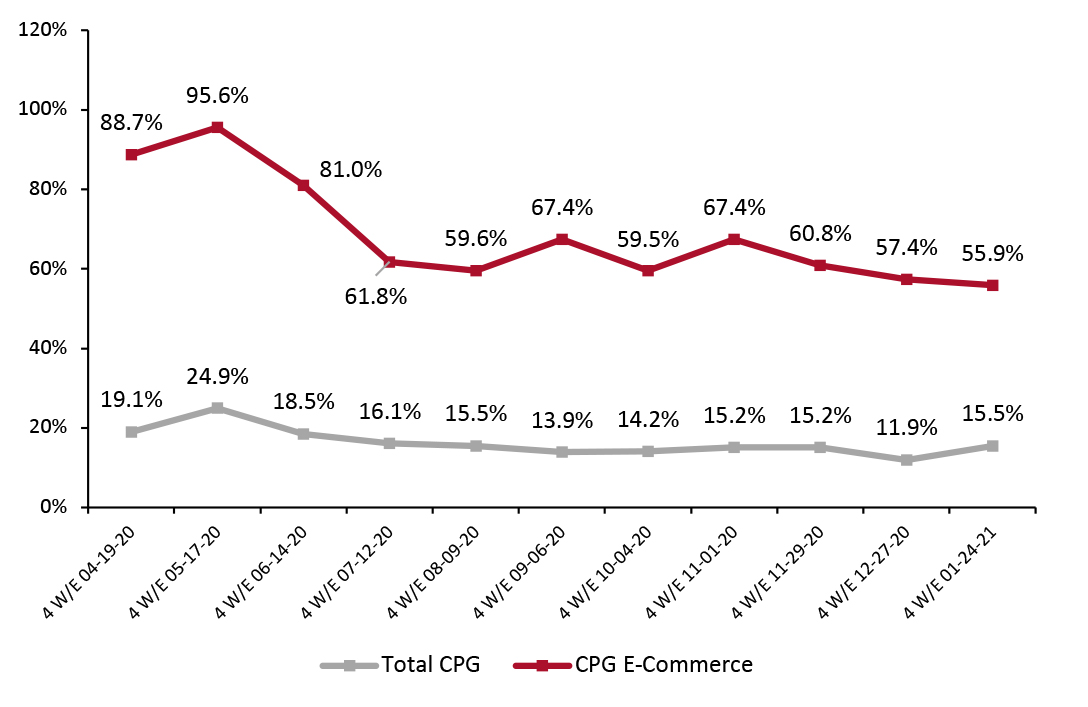 Historical data have been revised for the latest period
Source: IRI E-Market Insights™/Coresight Research [/caption] 2. Food & Beverage Picks Up Again Online food & beverage growth is up again after decelerating for two consecutive periods. The category saw growth of 77.1% for the period ended January 24, 2021, compared to 74.2% in the prior period. Food & beverage continues to see high online growth relative to other categories. According to Coresight Research’s US Consumer Tracker, almost one-quarter of US consumers had bought food and beverages online in the two weeks prior to the February 8 survey. Online growth is on a downward trend in the health & beauty and general merchandise & homecare categories, having slowed for three periods in a row. Both categories saw growth fall by around five percentage points in the latest period.
Figure 2. E-Commerce CPG Sales Growth, by Category Type (YoY % Change) [caption id="attachment_124512" align="aligncenter" width="725"]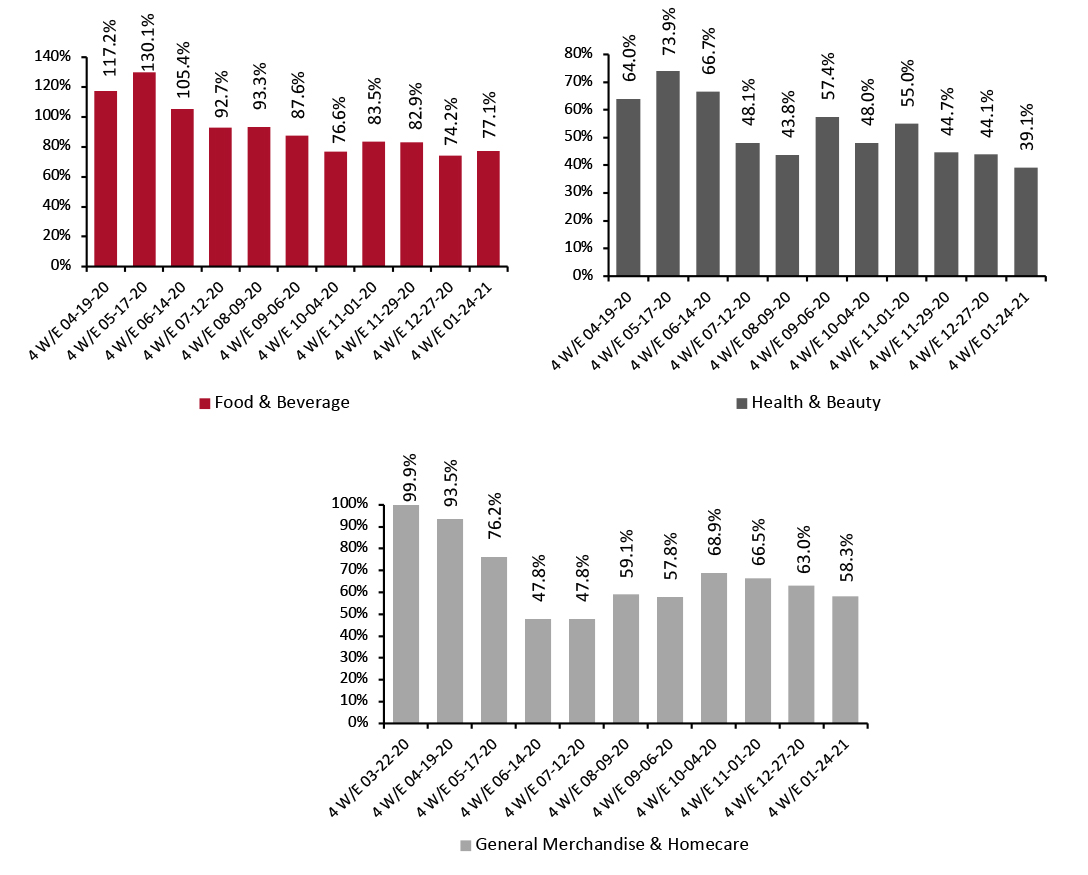 Historical data have been revised in the latest period
Source: IRI E-Market Insights™/Coresight Research [/caption] 3. Breakdown of Online CPG Sales: Food & Beverage Trending Up The chart below shows the breakdown of online sales by type of CPG category. The food & beverage category’s share is on an upward trajectory, exceeding 35% for the first time since October 2020 to reach 37.5% in the latest period. General merchandise & homecare picked up again to reach 22.5%, while health & beauty’s online share dropped by 3.7 percentage points to 40%.
Figure 3. CPG E-Commerce: Breakdown of Sales Share by Category (%) [caption id="attachment_124513" align="aligncenter" width="725"]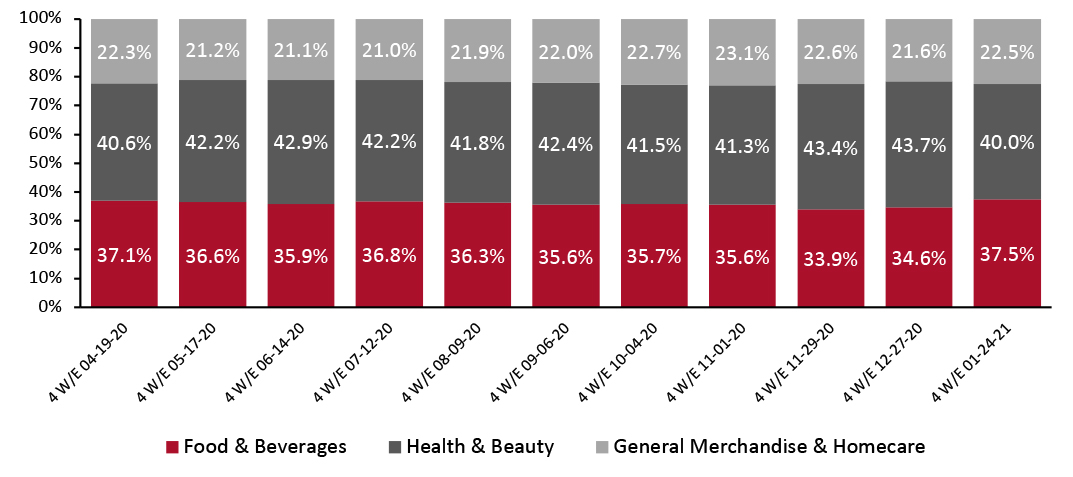 Historical data have been revised in the latest period
Source: IRI E-Market Insights™/Coresight Research [/caption] 4. The Refrigerated Foods Department Outpaces Other Food Departments in Online Sales Total food & beverage sales regained momentum in the latest period, growing 16.5% following a modest slowdown of 13.1% growth in the prior period. Costco witnessed this trend, with sales growth of food and sundries moderating to low double digits in December 2020 but picking up again to positive high-teen percentages for January 2021, driven by strong sales of frozen and fresh foods, according to the company. Among the major groupings charted below, refrigerated foods saw the biggest online gains for four weeks ended January 24, with growth of 88.4% year over year, driven by juices (up 137%), processed cheese (up 121%) and milk (up 115%). Frozen food has been a popular department throughout the crisis and continues to hold firm. Frozen food sales continue to outperform other food departments in total sales, climbing 23.4% for the latest period, driven by seafood (up 43%), meat (up 40%) and frozen potatoes and onions (up 32%).
Figure 4. Food & Beverage Departments: E-Commerce and Total Sales Growth, Four Weeks Ended January 24, 2021 (YoY %) [caption id="attachment_124514" align="aligncenter" width="725"]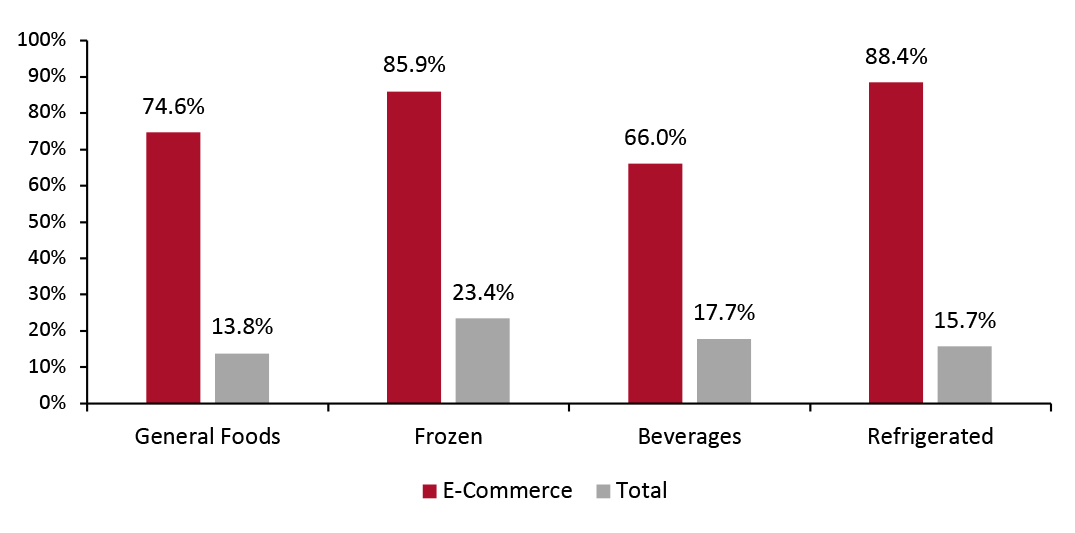 Source: IRI E-Market Insights™/Coresight Research [/caption]
5. Homecare Posted the Highest Online and Total Growth Among Nonfood Departments
The homecare department maintained its growth momentum in the latest period: Its online sales saw the highest growth relative to other nonfood departments, at 79.4%, driven by household cleaning tools (up 112%), household cleaners (up 87%) and air fresheners (up 90%).
Demand for homecare products remains exceptionally high due to consumers’ continued heightened focus on hygiene. In the earnings call for its second quarter ended December 31, 2020, Clorox reported double-digit sales growth for its Cleaning business, driven by sustained high demand for its cleaning and disinfecting products. This trend is also clear in Coresight Research’s findings from the survey of US consumers on February 8, 2021, with a substantial 40% of respondents reporting that they are currently buying more household items, such as cleaning or laundry products, than they did before the pandemic.
Figure 5. Nonfood Departments: E-Commerce and Total Sales Growth, Four Weeks Ended January 24, 2021 (YoY %) [caption id="attachment_124515" align="aligncenter" width="725"]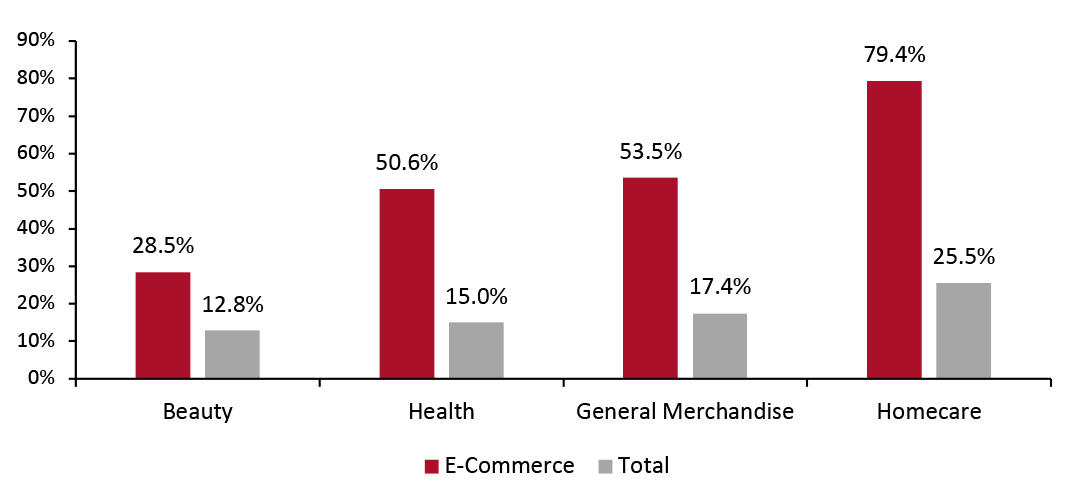 Source: IRI E-Market Insights™/Coresight Research [/caption]
What We Think
As Covid-19 cases in the US have edged downward since the beginning of the year, consumers are beginning to feel more confident about returning to in-store shopping, reflected in the softening of CPG e-commerce growth in the last few periods. However, a sustained shift back to physical shopping will depend largely on the speed at which vaccines are rolled out and the ability of the US to avoid further waves of infection.
In their recent earnings calls, many retailers noted that consumers’ pandemic-influenced shopping behaviors will outlast the crisis, leading to e-commerce being more ingrained in shoppers’ purchasing habits. As such, many retailers are planning to significantly ramp up their e-commerce infrastructure and aggressively push forward with their omnichannel initiatives, including expanding BOPIS (buy online, pick up in store) and curbside-pickup services. CPG manufacturers must also piggyback on the e-commerce wave and make concerted efforts to build out their digital capabilities and move deeper into offering online services to thrive in a post-crisis future.
IRI Disclaimer: The information contained herein is based in part on data reported by the IRI E-Market Insights™ solution and as interpreted solely by Coresight Research. The information is believed to be reliable at the time supplied by IRI but is neither all-inclusive nor guaranteed by IRI or Coresight Research, Inc. Without limiting the generality of the foregoing, specific data points may vary considerably from other information sources. Any opinion expressed herein reflect the judgement of Coresight Research, Inc. and are subject to change. IRI disclaims liability of any kind arising from the use of this information.
Figure 1. CPG E-Commerce and Total Sales Growth (YoY % Change) [caption id="attachment_124511" align="aligncenter" width="725"]
 Historical data have been revised for the latest period
 Source: IRI E-Market Insights™/Coresight Research [/caption] 2. Food & Beverage Picks Up Again Online food & beverage growth is up again after decelerating for two consecutive periods. The category saw growth of 77.1% for the period ended January 24, 2021, compared to 74.2% in the prior period. Food & beverage continues to see high online growth relative to other categories. According to Coresight Research’s US Consumer Tracker, almost one-quarter of US consumers had bought food and beverages online in the two weeks prior to the February 8 survey. Online growth is on a downward trend in the health & beauty and general merchandise & homecare categories, having slowed for three periods in a row. Both categories saw growth fall by around five percentage points in the latest period.
Figure 2. E-Commerce CPG Sales Growth, by Category Type (YoY % Change) [caption id="attachment_124512" align="aligncenter" width="725"]
 Historical data have been revised in the latest period
 Source: IRI E-Market Insights™/Coresight Research [/caption] 3. Breakdown of Online CPG Sales: Food & Beverage Trending Up The chart below shows the breakdown of online sales by type of CPG category. The food & beverage category’s share is on an upward trajectory, exceeding 35% for the first time since October 2020 to reach 37.5% in the latest period. General merchandise & homecare picked up again to reach 22.5%, while health & beauty’s online share dropped by 3.7 percentage points to 40%.
Figure 3. CPG E-Commerce: Breakdown of Sales Share by Category (%) [caption id="attachment_124513" align="aligncenter" width="725"]
 Historical data have been revised in the latest period
 Source: IRI E-Market Insights™/Coresight Research [/caption] 4. The Refrigerated Foods Department Outpaces Other Food Departments in Online Sales Total food & beverage sales regained momentum in the latest period, growing 16.5% following a modest slowdown of 13.1% growth in the prior period. Costco witnessed this trend, with sales growth of food and sundries moderating to low double digits in December 2020 but picking up again to positive high-teen percentages for January 2021, driven by strong sales of frozen and fresh foods, according to the company. Among the major groupings charted below, refrigerated foods saw the biggest online gains for four weeks ended January 24, with growth of 88.4% year over year, driven by juices (up 137%), processed cheese (up 121%) and milk (up 115%). Frozen food has been a popular department throughout the crisis and continues to hold firm. Frozen food sales continue to outperform other food departments in total sales, climbing 23.4% for the latest period, driven by seafood (up 43%), meat (up 40%) and frozen potatoes and onions (up 32%).
Figure 4. Food & Beverage Departments: E-Commerce and Total Sales Growth, Four Weeks Ended January 24, 2021 (YoY %) [caption id="attachment_124514" align="aligncenter" width="725"]
 Source: IRI E-Market Insights™/Coresight Research [/caption]
5. Homecare Posted the Highest Online and Total Growth Among Nonfood Departments
The homecare department maintained its growth momentum in the latest period: Its online sales saw the highest growth relative to other nonfood departments, at 79.4%, driven by household cleaning tools (up 112%), household cleaners (up 87%) and air fresheners (up 90%).
Demand for homecare products remains exceptionally high due to consumers’ continued heightened focus on hygiene. In the earnings call for its second quarter ended December 31, 2020, Clorox reported double-digit sales growth for its Cleaning business, driven by sustained high demand for its cleaning and disinfecting products. This trend is also clear in Coresight Research’s findings from the survey of US consumers on February 8, 2021, with a substantial 40% of respondents reporting that they are currently buying more household items, such as cleaning or laundry products, than they did before the pandemic.
Figure 5. Nonfood Departments: E-Commerce and Total Sales Growth, Four Weeks Ended January 24, 2021 (YoY %) [caption id="attachment_124515" align="aligncenter" width="725"]
 Source: IRI E-Market Insights™/Coresight Research [/caption]
What We Think
As Covid-19 cases in the US have edged downward since the beginning of the year, consumers are beginning to feel more confident about returning to in-store shopping, reflected in the softening of CPG e-commerce growth in the last few periods. However, a sustained shift back to physical shopping will depend largely on the speed at which vaccines are rolled out and the ability of the US to avoid further waves of infection.
In their recent earnings calls, many retailers noted that consumers’ pandemic-influenced shopping behaviors will outlast the crisis, leading to e-commerce being more ingrained in shoppers’ purchasing habits. As such, many retailers are planning to significantly ramp up their e-commerce infrastructure and aggressively push forward with their omnichannel initiatives, including expanding BOPIS (buy online, pick up in store) and curbside-pickup services. CPG manufacturers must also piggyback on the e-commerce wave and make concerted efforts to build out their digital capabilities and move deeper into offering online services to thrive in a post-crisis future.
IRI Disclaimer: The information contained herein is based in part on data reported by the IRI E-Market Insights™ solution and as interpreted solely by Coresight Research. The information is believed to be reliable at the time supplied by IRI but is neither all-inclusive nor guaranteed by IRI or Coresight Research, Inc. Without limiting the generality of the foregoing, specific data points may vary considerably from other information sources. Any opinion expressed herein reflect the judgement of Coresight Research, Inc. and are subject to change. IRI disclaims liability of any kind arising from the use of this information.