DIpil Das
The Coresight Research and IRI monthly US CPG Sales Tracker provides our data-driven insights into online sales trends in the US CPG industry—covering the product categories of food & beverage; health & beauty; and general merchandise & homecare. In this report, we present five key insights into the four weeks ended May 16, 2021.
1. Online CPG Growth Continues To Decline Against Strong Comparatives
CPG e-commerce grew by 3.1% for the four weeks ended May 16, 2021, versus 5.8% in the prior period. The continued slowdown in growth can be partly attributed to the annualization of pandemic spending patterns. After the outbreak of Covid-19 in the US in March 2020, the CPG industry witnessed accelerated growth in online spending as consumers stockpiled essentials and other consumer products. Additionally, lockdown measures undertaken by state and local governments fuelled online growth.
Last year, during the four weeks ended May 17, CPG e-commerce sales growth was 92.0% year over year, slowing slightly to 77.7% in the four weeks ended June 14, 2020. As we annualize this pandemic-led very strong growth, we are seeing a major slowdown in year-over-year growth, to low, single digits. We expect this trend to continue in June 2021 due to strong comparatives.
Figure 1. CPG E-Commerce and Total Sales Growth (YoY % Change) [caption id="attachment_128792" align="aligncenter" width="725"]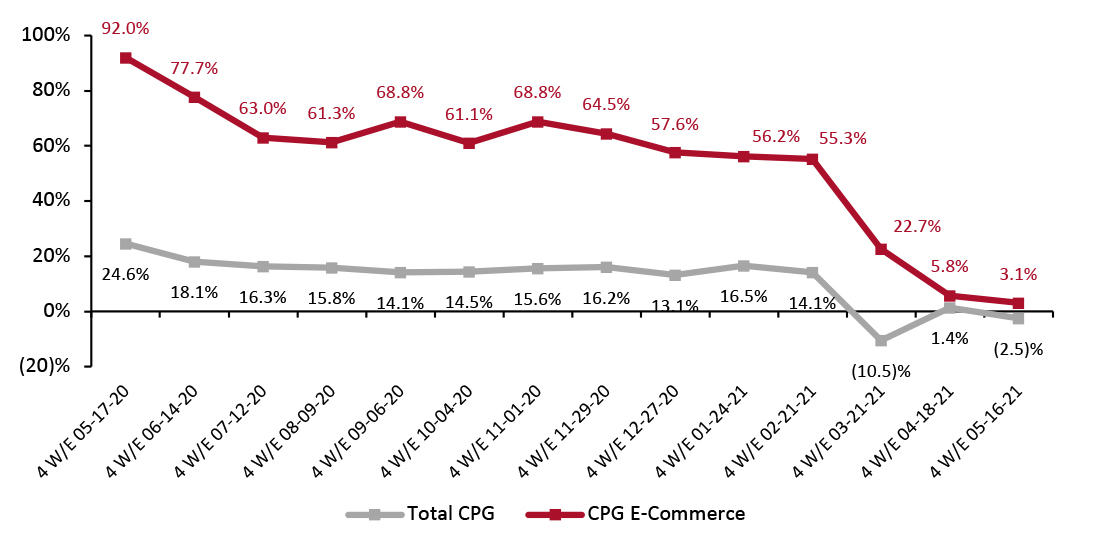 Historical data have been revised for the latest period
Source: IRI E-Market Insights™/Coresight Research [/caption] However, comparing CPG e-commerce sales to the period two years prior shows strong positive growth for the four weeks ended May 16, 2021, of 98.0%—indicating that online CPG sales remain high versus pre-pandemic values.
Figure 2. CPG E-Commerce and Total Sales Growth (% Change from Two Years Prior) [caption id="attachment_128793" align="aligncenter" width="725"]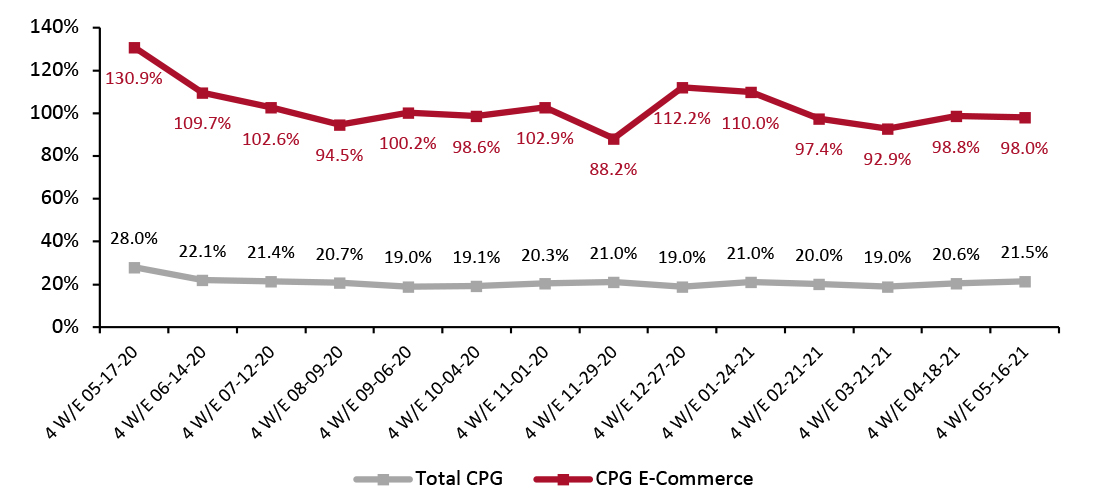 Historical data have been revised for the latest period
Source: IRI E-Market Insights™/Coresight Research [/caption] 2. Food & Beverage Sees Significant Deceleration in E-Commerce Sales Growth The online food & beverage category grew by 123.6% on a two-year basis but growth decelerated to 1.9% from 2020 due to strong comparatives. With US vaccination efforts in full swing, consumers are becoming less fearful of contracting Covid-19 and are increasingly leaving their homes to shop, dine and socialize. According to Coresight Research’s US Consumer Tracker survey conducted on May 31, 2021, only 20.4% of respondents purchased food or beverages from online channels in the past two weeks. However, 83.0% of US consumers purchased food or beverages from physical stores in the same period. General merchandise & homecare saw slight improvement in year-over-year growth, reaching 11.0%. However, on a two-year basis, the category saw significant growth of 109.7%. The health & beauty category witnessed a steep year-over-year growth decline of 0.8% but an increase of 75.3% compared to 2019.
Figure 3. E-Commerce CPG Sales Growth, by Category Type (YoY % Change) [caption id="attachment_128794" align="aligncenter" width="725"]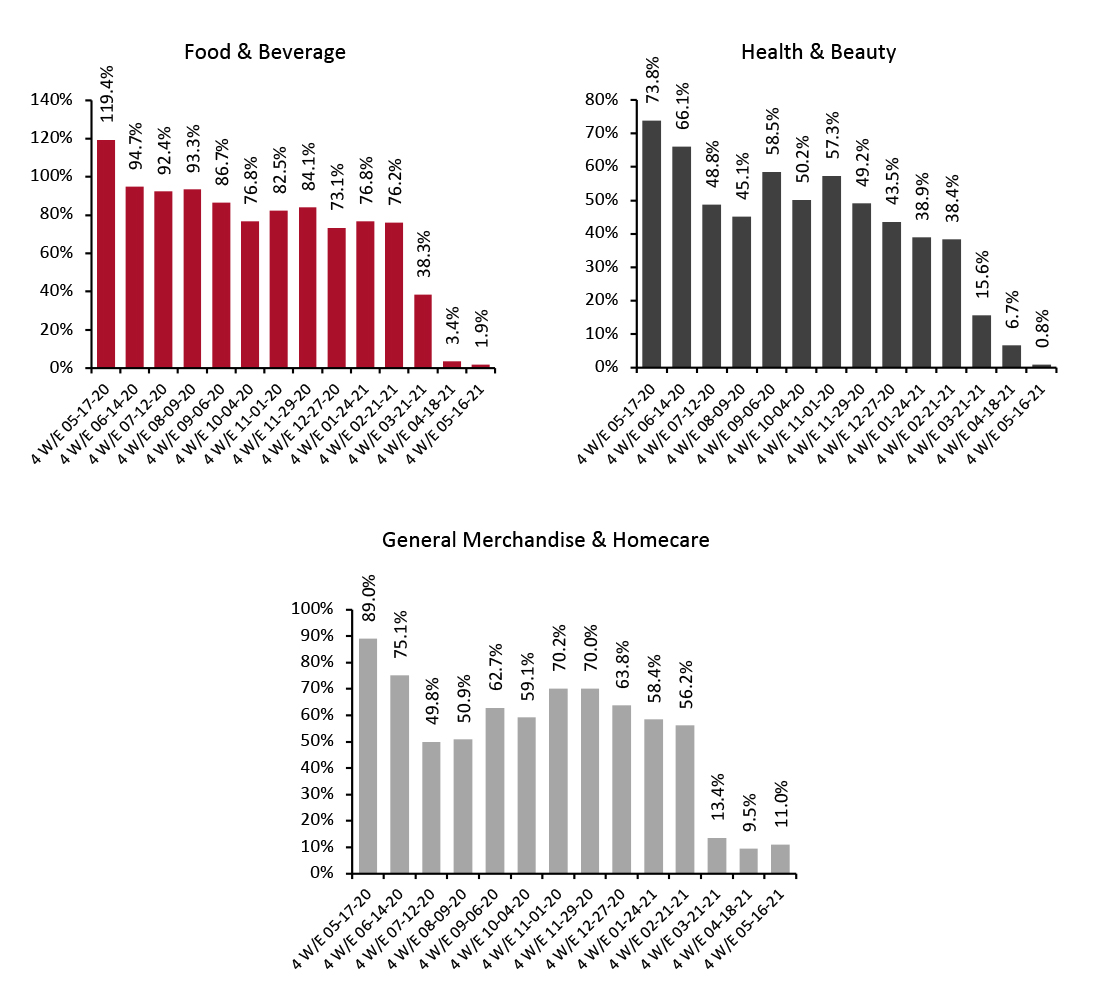 Historical data have been revised in the latest period
Source: IRI E-Market Insights™/Coresight Research [/caption]
Figure 4. E-Commerce CPG Sales Growth, by Category Type (% Change from Two Years Prior) [caption id="attachment_128795" align="aligncenter" width="725"]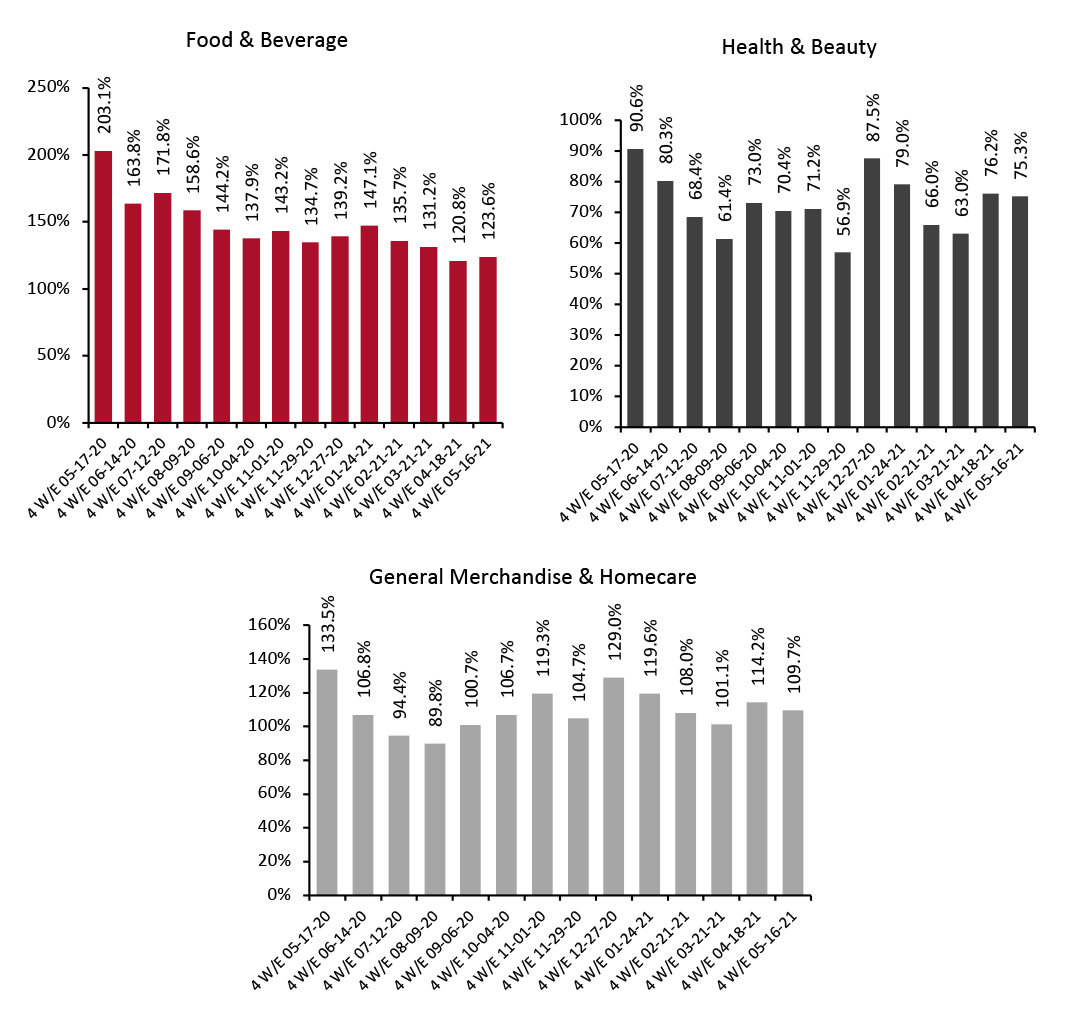 Historical data have been revised in the latest period
Source: IRI E-Market Insights™/Coresight [/caption] 3. Breakdown of Online CPG Sales: Food & Beverage Share Declines The chart below shows the breakdown of online sales by type of CPG category. Food & beverage’s share is trending downward, declining to 34.4% during the four weeks ended May 16, 2021. Health & beauty’s online share improved slightly by 0.6 percentage points, to 42.1%, whereas general merchandise & homecare remained constant at 22.7% during the latest period.
Figure 5. CPG E-Commerce: Breakdown of Sales Share by Category (%) [caption id="attachment_128796" align="aligncenter" width="725"]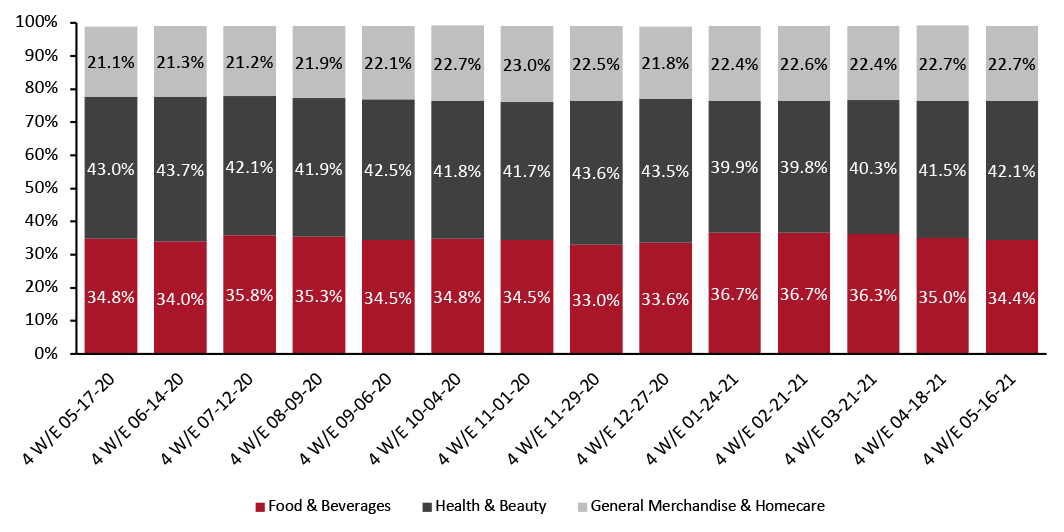 Source: IRI E-Market Insights™/Coresight Research [/caption]
4. The Beverages Department Outperforms Other Food Departments in Online Sales
Compared to other departments, beverages continues to report strong year-over-year online growth—total online sales increased by 4.5% from the comparable period in 2020 and by 99.0% from 2019. Growth was driven by nonfruit drinks (up 197.5% from 2020), sports drinks (up 63.3% from 2020) and aseptic juices (up 47.2% from 2020).
Sales of frozen food, which increased significantly during the pandemic, grew by just 1.4% compared to 2020—partly due to the annualization of lockdown restrictions in the US. The category’s online sales grew by 127.4% compared to 2019.
Source: IRI E-Market Insights™/Coresight Research [/caption]
4. The Beverages Department Outperforms Other Food Departments in Online Sales
Compared to other departments, beverages continues to report strong year-over-year online growth—total online sales increased by 4.5% from the comparable period in 2020 and by 99.0% from 2019. Growth was driven by nonfruit drinks (up 197.5% from 2020), sports drinks (up 63.3% from 2020) and aseptic juices (up 47.2% from 2020).
Sales of frozen food, which increased significantly during the pandemic, grew by just 1.4% compared to 2020—partly due to the annualization of lockdown restrictions in the US. The category’s online sales grew by 127.4% compared to 2019.
Figure 6. Food & Beverage Departments: E-Commerce and Total Sales Growth, Four Weeks Ended May 16, 2021 (YoY and Yo2Y % Change) [caption id="attachment_128797" align="aligncenter" width="725"]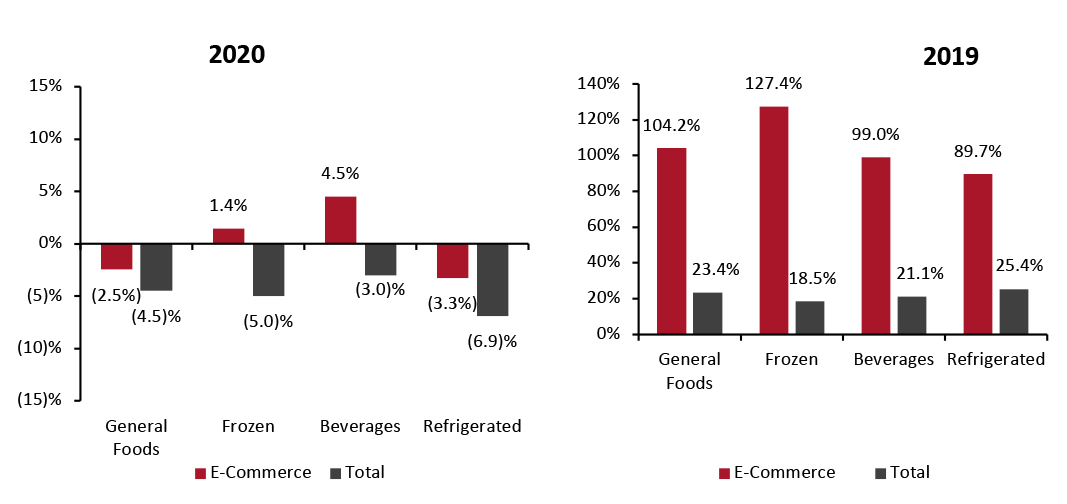 Source: IRI E-Market Insights™/Coresight Research [/caption]
5. Health Continues To Report Highest Online and Total Growth Among Nonfood Departments
Health products saw the highest year-over-year sales growth in the latest period—relative to other nonfood departments—growing by 12.6% online. Health e-commerce sales were driven by anti-smoking products (up 39.8% from 2020), sexual health (up 31.8%) and eye/contact lens care products (up 34.7%).
Online sales of homecare products grew by only 6.7% year over year. However, compared to 2019, online sales grew significantly by 132.5% and total sales were up by 18.7%.
Source: IRI E-Market Insights™/Coresight Research [/caption]
5. Health Continues To Report Highest Online and Total Growth Among Nonfood Departments
Health products saw the highest year-over-year sales growth in the latest period—relative to other nonfood departments—growing by 12.6% online. Health e-commerce sales were driven by anti-smoking products (up 39.8% from 2020), sexual health (up 31.8%) and eye/contact lens care products (up 34.7%).
Online sales of homecare products grew by only 6.7% year over year. However, compared to 2019, online sales grew significantly by 132.5% and total sales were up by 18.7%.
Figure 7. Nonfood Departments: E-Commerce and Total Sales Growth, Four Weeks Ended May 16, 2021 (YoY and Yo2Y % Change) [caption id="attachment_128798" align="aligncenter" width="725"]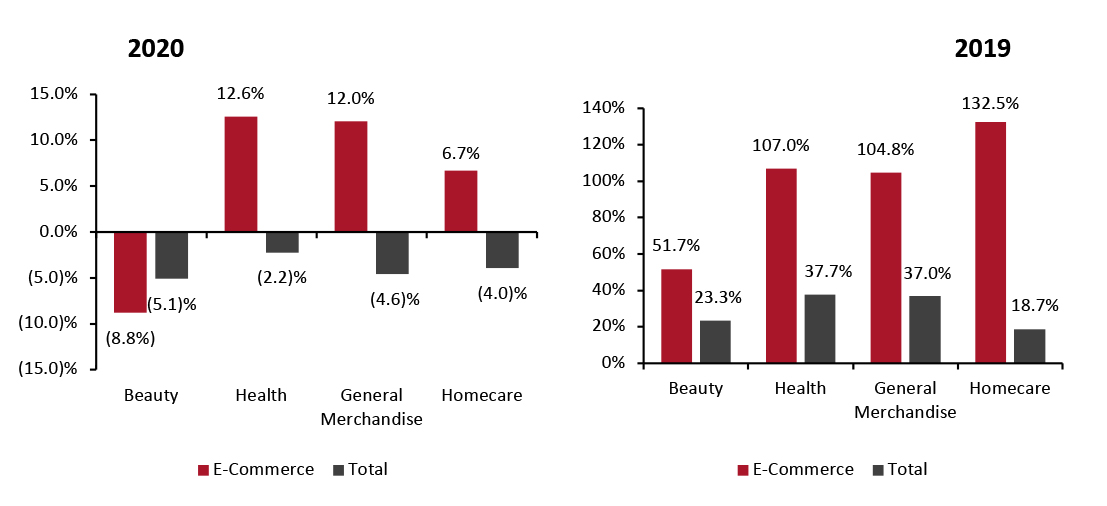 Source: IRI E-Market Insights™/Coresight Research [/caption]
What We Think
As expected, CPG e-commerce is facing a sharp slowdown in 2021 due to tough year-over-year comparatives. However, even against those comparatives, growth has not (or not yet) turned negative, reflecting the retention of online shopping behaviors in grocery.
We expect pandemic-driven shopping behaviors to outlast the crisis: consumers will likely still extensively use e-commerce sales channels to shop for CPG products. Retailers such as Kroger, Target and Walmart have witnessed staggering online sales growth during the most recent fiscal year. Due to online channels’ rising profit share, many retailers have announced plans to enhance their e-commerce infrastructure, including in omnichannel fulfillment, supply chain and automation.
To remain successful, it will be imperative for CPG manufacturers to capitalize on the e-commerce wave and build their online sales channels.
Source: IRI E-Market Insights™/Coresight Research [/caption]
What We Think
As expected, CPG e-commerce is facing a sharp slowdown in 2021 due to tough year-over-year comparatives. However, even against those comparatives, growth has not (or not yet) turned negative, reflecting the retention of online shopping behaviors in grocery.
We expect pandemic-driven shopping behaviors to outlast the crisis: consumers will likely still extensively use e-commerce sales channels to shop for CPG products. Retailers such as Kroger, Target and Walmart have witnessed staggering online sales growth during the most recent fiscal year. Due to online channels’ rising profit share, many retailers have announced plans to enhance their e-commerce infrastructure, including in omnichannel fulfillment, supply chain and automation.
To remain successful, it will be imperative for CPG manufacturers to capitalize on the e-commerce wave and build their online sales channels.
IRI Disclaimer: The information contained herein is based in part on data reported by the IRI E-Market Insights™ solution and as interpreted solely by Coresight Research. The information is believed to be reliable at the time supplied by IRI but is neither all-inclusive nor guaranteed by IRI or Coresight Research, Inc. Without limiting the generality of the foregoing, specific data points may vary considerably from other information sources. Any opinion expressed herein reflect the judgement of Coresight Research, Inc. and are subject to change. IRI disclaims liability of any kind arising from the use of this information.
Figure 1. CPG E-Commerce and Total Sales Growth (YoY % Change) [caption id="attachment_128792" align="aligncenter" width="725"]
Historical data have been revised for the latest period Source: IRI E-Market Insights™/Coresight Research [/caption] However, comparing CPG e-commerce sales to the period two years prior shows strong positive growth for the four weeks ended May 16, 2021, of 98.0%—indicating that online CPG sales remain high versus pre-pandemic values.
Figure 2. CPG E-Commerce and Total Sales Growth (% Change from Two Years Prior) [caption id="attachment_128793" align="aligncenter" width="725"]
Historical data have been revised for the latest period Source: IRI E-Market Insights™/Coresight Research [/caption] 2. Food & Beverage Sees Significant Deceleration in E-Commerce Sales Growth The online food & beverage category grew by 123.6% on a two-year basis but growth decelerated to 1.9% from 2020 due to strong comparatives. With US vaccination efforts in full swing, consumers are becoming less fearful of contracting Covid-19 and are increasingly leaving their homes to shop, dine and socialize. According to Coresight Research’s US Consumer Tracker survey conducted on May 31, 2021, only 20.4% of respondents purchased food or beverages from online channels in the past two weeks. However, 83.0% of US consumers purchased food or beverages from physical stores in the same period. General merchandise & homecare saw slight improvement in year-over-year growth, reaching 11.0%. However, on a two-year basis, the category saw significant growth of 109.7%. The health & beauty category witnessed a steep year-over-year growth decline of 0.8% but an increase of 75.3% compared to 2019.
Figure 3. E-Commerce CPG Sales Growth, by Category Type (YoY % Change) [caption id="attachment_128794" align="aligncenter" width="725"]
Historical data have been revised in the latest period Source: IRI E-Market Insights™/Coresight Research [/caption]
Figure 4. E-Commerce CPG Sales Growth, by Category Type (% Change from Two Years Prior) [caption id="attachment_128795" align="aligncenter" width="725"]
Historical data have been revised in the latest period Source: IRI E-Market Insights™/Coresight [/caption] 3. Breakdown of Online CPG Sales: Food & Beverage Share Declines The chart below shows the breakdown of online sales by type of CPG category. Food & beverage’s share is trending downward, declining to 34.4% during the four weeks ended May 16, 2021. Health & beauty’s online share improved slightly by 0.6 percentage points, to 42.1%, whereas general merchandise & homecare remained constant at 22.7% during the latest period.
Figure 5. CPG E-Commerce: Breakdown of Sales Share by Category (%) [caption id="attachment_128796" align="aligncenter" width="725"]
Source: IRI E-Market Insights™/Coresight Research [/caption]
4. The Beverages Department Outperforms Other Food Departments in Online Sales
Compared to other departments, beverages continues to report strong year-over-year online growth—total online sales increased by 4.5% from the comparable period in 2020 and by 99.0% from 2019. Growth was driven by nonfruit drinks (up 197.5% from 2020), sports drinks (up 63.3% from 2020) and aseptic juices (up 47.2% from 2020).
Sales of frozen food, which increased significantly during the pandemic, grew by just 1.4% compared to 2020—partly due to the annualization of lockdown restrictions in the US. The category’s online sales grew by 127.4% compared to 2019.
Figure 6. Food & Beverage Departments: E-Commerce and Total Sales Growth, Four Weeks Ended May 16, 2021 (YoY and Yo2Y % Change) [caption id="attachment_128797" align="aligncenter" width="725"]
Source: IRI E-Market Insights™/Coresight Research [/caption]
5. Health Continues To Report Highest Online and Total Growth Among Nonfood Departments
Health products saw the highest year-over-year sales growth in the latest period—relative to other nonfood departments—growing by 12.6% online. Health e-commerce sales were driven by anti-smoking products (up 39.8% from 2020), sexual health (up 31.8%) and eye/contact lens care products (up 34.7%).
Online sales of homecare products grew by only 6.7% year over year. However, compared to 2019, online sales grew significantly by 132.5% and total sales were up by 18.7%.
Figure 7. Nonfood Departments: E-Commerce and Total Sales Growth, Four Weeks Ended May 16, 2021 (YoY and Yo2Y % Change) [caption id="attachment_128798" align="aligncenter" width="725"]
Source: IRI E-Market Insights™/Coresight Research [/caption]
What We Think
As expected, CPG e-commerce is facing a sharp slowdown in 2021 due to tough year-over-year comparatives. However, even against those comparatives, growth has not (or not yet) turned negative, reflecting the retention of online shopping behaviors in grocery.
We expect pandemic-driven shopping behaviors to outlast the crisis: consumers will likely still extensively use e-commerce sales channels to shop for CPG products. Retailers such as Kroger, Target and Walmart have witnessed staggering online sales growth during the most recent fiscal year. Due to online channels’ rising profit share, many retailers have announced plans to enhance their e-commerce infrastructure, including in omnichannel fulfillment, supply chain and automation.
To remain successful, it will be imperative for CPG manufacturers to capitalize on the e-commerce wave and build their online sales channels.
IRI Disclaimer: The information contained herein is based in part on data reported by the IRI E-Market Insights™ solution and as interpreted solely by Coresight Research. The information is believed to be reliable at the time supplied by IRI but is neither all-inclusive nor guaranteed by IRI or Coresight Research, Inc. Without limiting the generality of the foregoing, specific data points may vary considerably from other information sources. Any opinion expressed herein reflect the judgement of Coresight Research, Inc. and are subject to change. IRI disclaims liability of any kind arising from the use of this information.