Nitheesh NH
The Coresight Research and IRI monthly US CPG Sales Tracker provides our data-driven insights into online sales trends in the US CPG industry—covering the product categories of food & beverage; health & beauty; and general merchandise & homecare. In this report, we present five key insights into the four weeks ended December 26, 2021.
1. Online CPG Growth Remains Strong During the Holiday Season
CPG e-commerce saw double-digit year-over-year growth at 15.2% for the four weeks ended December 26, 2021, falling slightly from 16.2% in the prior period. The second month of mid-teens growth is likely due to the pandemic’s role in changing shopping habits, encouraging more holiday shoppers to switch from offline to online during the holiday season. This period, sales growth still favored online shopping—while total CPG sales growth accelerated, by 2.9 percentages points from the previous period.
Figure 1. CPG E-Commerce and Total Sales Growth (YoY % Change) [caption id="attachment_141712" align="aligncenter" width="700"]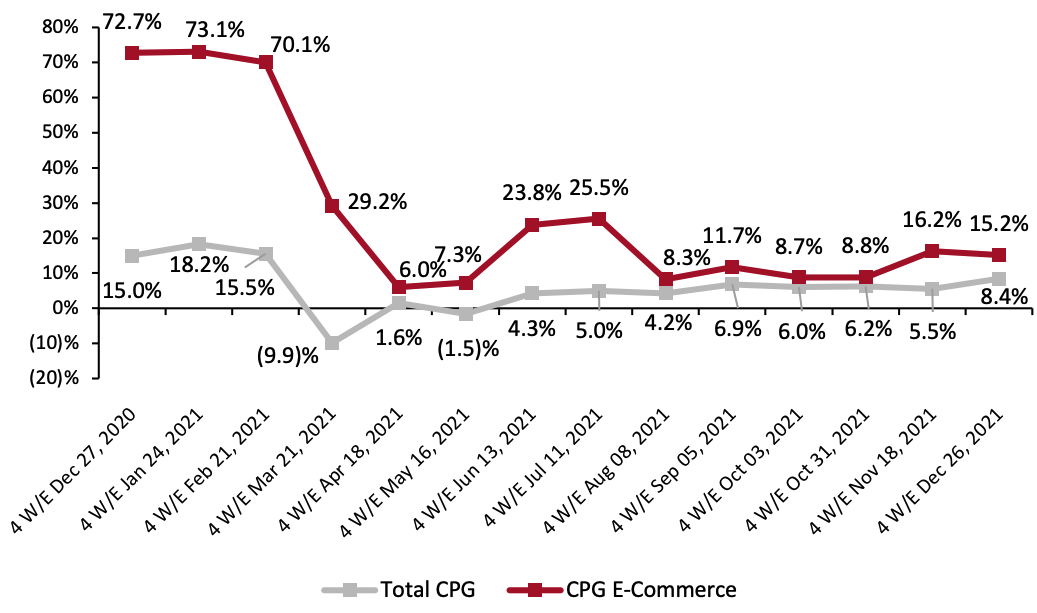 Historical data have been revised for the latest period
Source: IRI E-Market Insights™/Coresight Research[/caption] Two-year growth remains substantially stronger, and sales both online and in store remain well above pre-pandemic levels. E-commerce saw its second consecutive period of 98.9% two-year growth in the four weeks ended December 26, 2021, far above pre-pandemic levels.
Figure 2. CPG E-Commerce and Total Sales Growth (% Change From Two Years Prior) [caption id="attachment_141713" align="aligncenter" width="700"]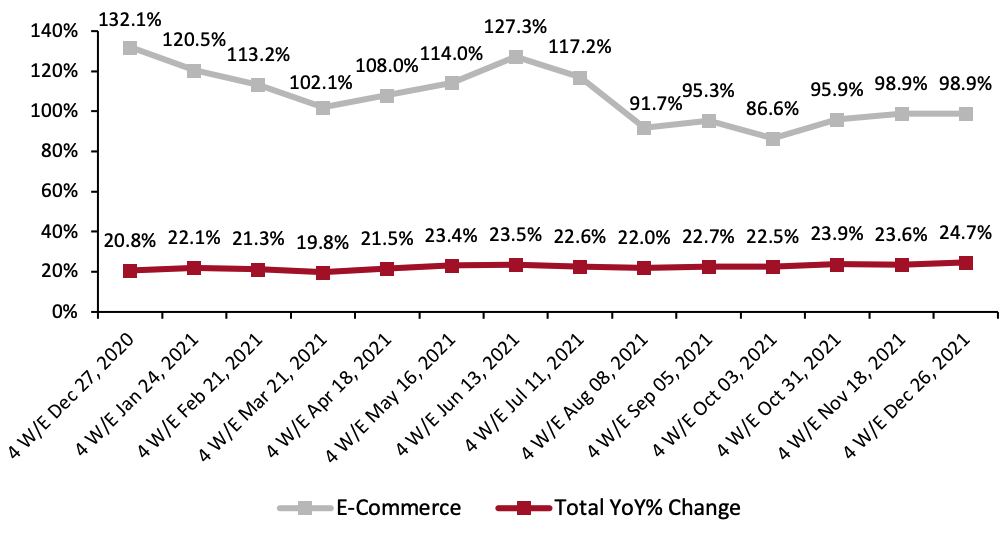 Historical data have been revised for the latest period
Source: IRI E-Market Insights™/Coresight Research[/caption] 2. Food & Beverage Online Sales Remains Volatile Online food & beverage sales growth dropped to 6.8% in the four weeks ended December 26, 2021, from 11.2% in the previous period—likely caused by frequent product outages as the supply chain continued to struggle. The skyrocketing number of Omicron variant cases resulted in many workers at CPG and logistics companies contracting Covid-19, leading to additional strain on manufacturing and delivery of goods. We believe that food & beverage was hit hardest due to the perishable nature of these products—which puts constraints on inventory size, and makes it more difficult for producers and retailers to adapt to supply chain disruptions. Online health & beauty year-over-year growth remained over 20.0%, but dipped slightly below the previous period’s values. General merchandise & homecare rose above the previous period’s levels. Compared to pre-pandemic 2019, food & beverage sales have seen massive amounts of growth in 2021—although this growth does not appear to be stable and has been slowing, and has dipped notably since June. In contrast, both health & beauty and general merchandise & homecare recorded slightly lower two-year growth over the course of the year, but increased in the most recent period.
Figure 3. E-Commerce CPG Sales Growth, by Category Type (YoY % Change) [caption id="attachment_141714" align="aligncenter" width="700"]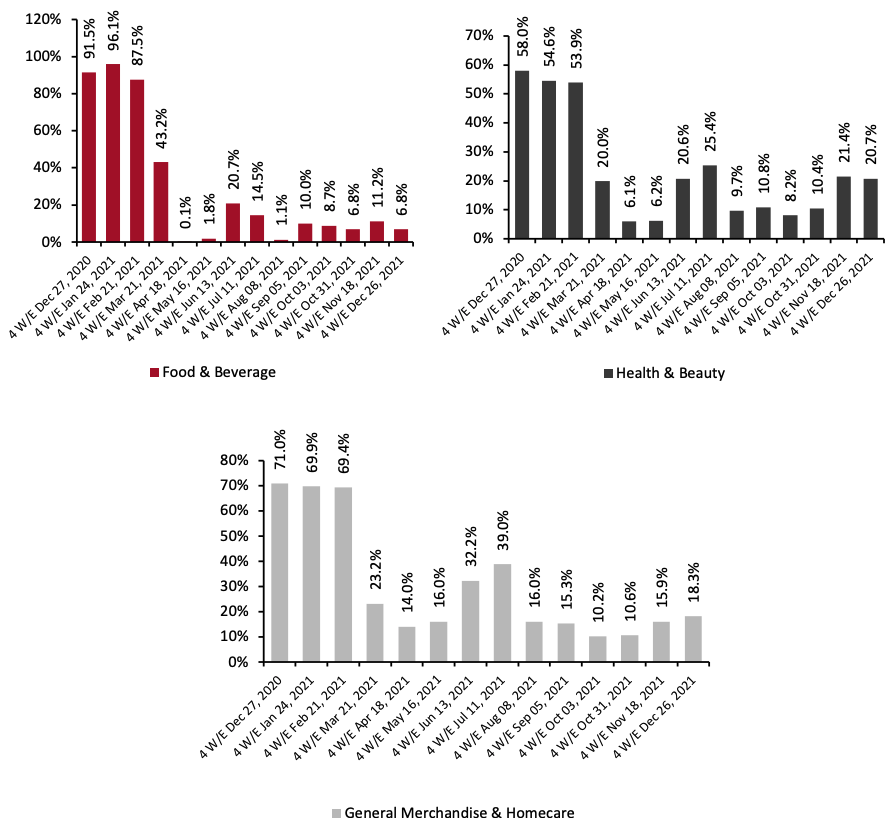 Historical data have been revised for the latest period
Source: IRI E-Market Insights™/Coresight Research[/caption]
Figure 4. E-Commerce CPG Sales Growth, by Category Type (% Change from Two Years Prior) [caption id="attachment_141715" align="aligncenter" width="700"]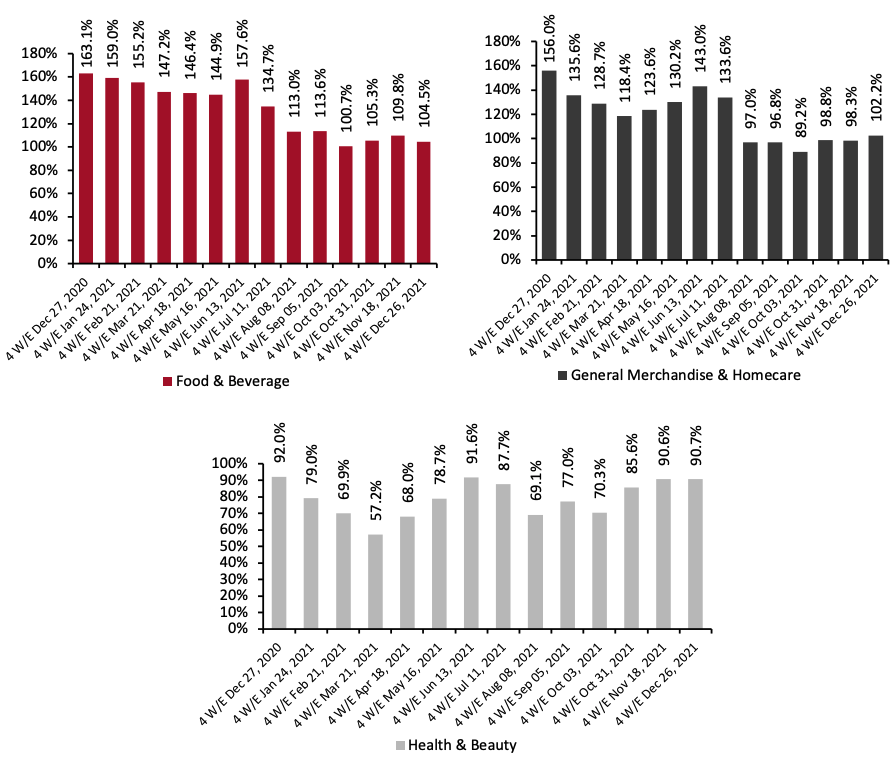 Historical data have been revised for the latest period
Source: IRI E-Market Insights™/Coresight Research[/caption] 3. Breakdown of Online CPG Sales: General Merchandise & Homecare Slightly Increases Share The chart below shows the breakdown of online sales by CPG category. Merchandise & homecare’s share of overall online sales increased from 31.9% to 33.6%. Food & beverage and health & beauty slowed by 1.0 and 0.8 percentage points, respectively.
Figure 5. CPG E-Commerce: Breakdown of Sales Share by Category (%) [caption id="attachment_141716" align="aligncenter" width="700"]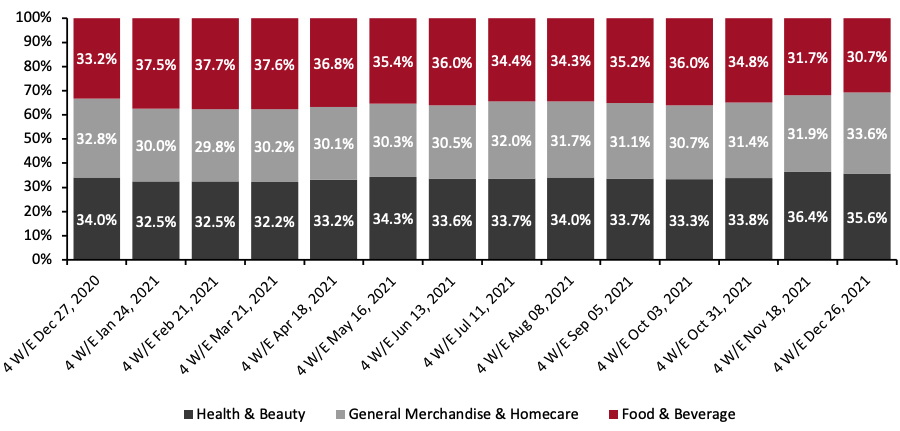 Historical data have been revised for the latest period
Source: IRI E-Market Insights™/Coresight Research[/caption] 4. Frozen Outperforms Other Food & Beverage Departments in Online Sales Frozen recorded the highest year-over-year growth of all food departments at 18.0%, while refrigerated was second highest, registering 4.5%. Growth in frozen was driven by sides/other (up 536.9%), novelties (up 15.6%) and pies (up 10.5%). Meanwhile, general foods and beverage decreased by 4.0% and 5.9% year over year, respectively. However, the largest contributor to year-over-year growth is likely the extremely strong growth rates seen in 2020, rather than any substantial change. This is reflected in the growth on a two-year basis seen across all five categories, which either reached high double digits or triple digits—most notably, the frozen category saw the lowest two-year growth, making the category’s year-over-year growth appear stronger.
Figure 6. Food & Beverage Departments: E-Commerce and Total Sales Growth, Four Weeks Ended December 26, 2021 (YoY and Yo2Y % Change) [caption id="attachment_141717" align="aligncenter" width="700"]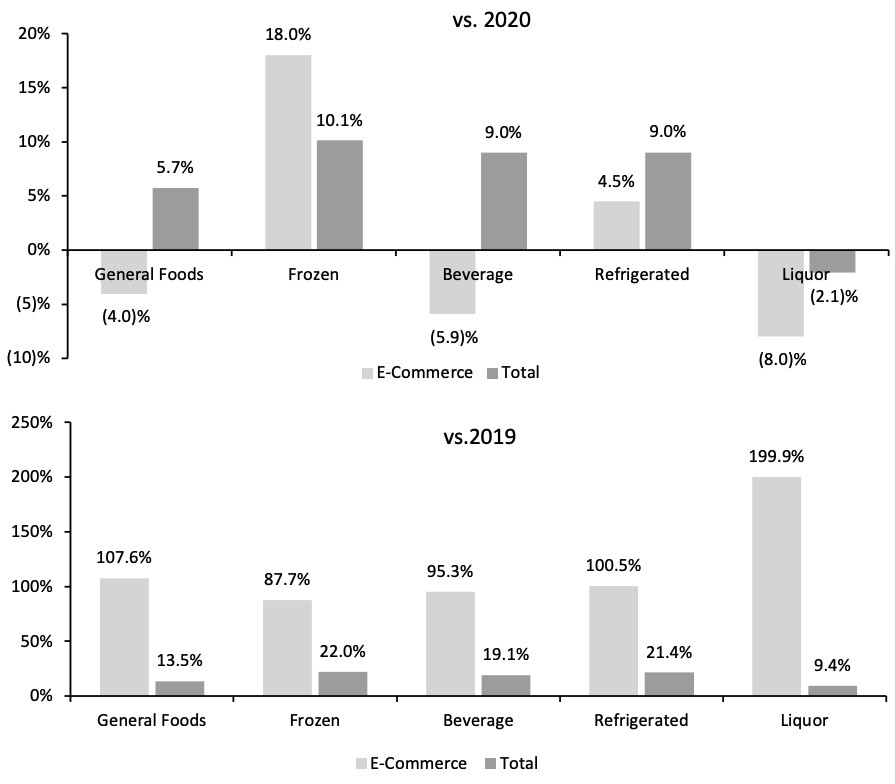 Historical data have been revised for the latest period
Source: IRI E-Market Insights™/Coresight Research[/caption] 5. Health Continues to Lead Growth in Nonfood Departments The health department continued to observe the highest year-over-year growth among nonfood CPG departments at 29.4% in e-commerce and 18.5% growth in total category sales. Online growth was driven by home health care/kits (up 66.8%), denture products (59.4%) and family planning (56.0%). Homecare reported the second highest e-commerce growth, at 22.0% year over year, which is substantial given its strong comparative from 2019, which stood at 161.2%—compared to health’s slightly lower 128.0%. Unlike food departments, all nonfood departments retained strong positive growth in the mid-teens or above.
Figure 7. Nonfood Departments: E-Commerce and Total Sales Growth, Four Weeks Ended December 26, 2021 (YoY and Yo2Y % Change) [caption id="attachment_141718" align="aligncenter" width="700"]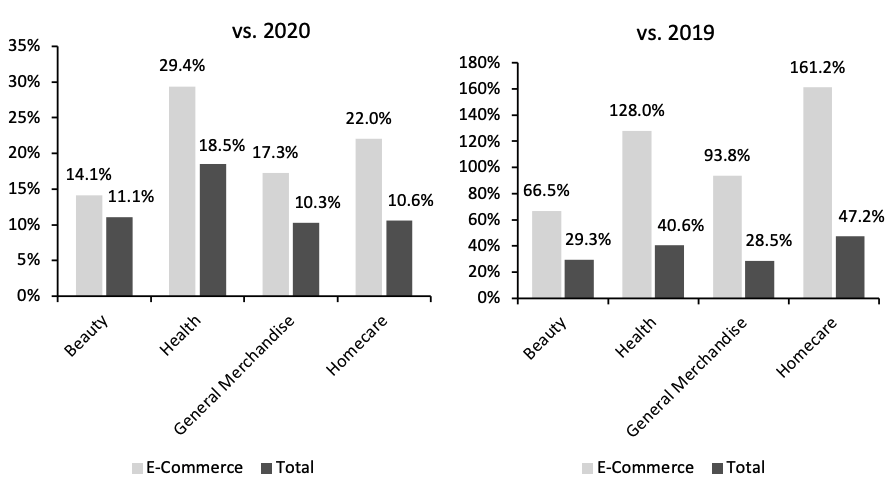 Historical data have been revised for the latest period
Source: IRI E-Market Insights™/Coresight Research[/caption]
Figure 1. CPG E-Commerce and Total Sales Growth (YoY % Change) [caption id="attachment_141712" align="aligncenter" width="700"]
Historical data have been revised for the latest periodSource: IRI E-Market Insights™/Coresight Research[/caption] Two-year growth remains substantially stronger, and sales both online and in store remain well above pre-pandemic levels. E-commerce saw its second consecutive period of 98.9% two-year growth in the four weeks ended December 26, 2021, far above pre-pandemic levels.
Figure 2. CPG E-Commerce and Total Sales Growth (% Change From Two Years Prior) [caption id="attachment_141713" align="aligncenter" width="700"]
Historical data have been revised for the latest periodSource: IRI E-Market Insights™/Coresight Research[/caption] 2. Food & Beverage Online Sales Remains Volatile Online food & beverage sales growth dropped to 6.8% in the four weeks ended December 26, 2021, from 11.2% in the previous period—likely caused by frequent product outages as the supply chain continued to struggle. The skyrocketing number of Omicron variant cases resulted in many workers at CPG and logistics companies contracting Covid-19, leading to additional strain on manufacturing and delivery of goods. We believe that food & beverage was hit hardest due to the perishable nature of these products—which puts constraints on inventory size, and makes it more difficult for producers and retailers to adapt to supply chain disruptions. Online health & beauty year-over-year growth remained over 20.0%, but dipped slightly below the previous period’s values. General merchandise & homecare rose above the previous period’s levels. Compared to pre-pandemic 2019, food & beverage sales have seen massive amounts of growth in 2021—although this growth does not appear to be stable and has been slowing, and has dipped notably since June. In contrast, both health & beauty and general merchandise & homecare recorded slightly lower two-year growth over the course of the year, but increased in the most recent period.
Figure 3. E-Commerce CPG Sales Growth, by Category Type (YoY % Change) [caption id="attachment_141714" align="aligncenter" width="700"]
Historical data have been revised for the latest periodSource: IRI E-Market Insights™/Coresight Research[/caption]
Figure 4. E-Commerce CPG Sales Growth, by Category Type (% Change from Two Years Prior) [caption id="attachment_141715" align="aligncenter" width="700"]
Historical data have been revised for the latest periodSource: IRI E-Market Insights™/Coresight Research[/caption] 3. Breakdown of Online CPG Sales: General Merchandise & Homecare Slightly Increases Share The chart below shows the breakdown of online sales by CPG category. Merchandise & homecare’s share of overall online sales increased from 31.9% to 33.6%. Food & beverage and health & beauty slowed by 1.0 and 0.8 percentage points, respectively.
Figure 5. CPG E-Commerce: Breakdown of Sales Share by Category (%) [caption id="attachment_141716" align="aligncenter" width="700"]
Historical data have been revised for the latest periodSource: IRI E-Market Insights™/Coresight Research[/caption] 4. Frozen Outperforms Other Food & Beverage Departments in Online Sales Frozen recorded the highest year-over-year growth of all food departments at 18.0%, while refrigerated was second highest, registering 4.5%. Growth in frozen was driven by sides/other (up 536.9%), novelties (up 15.6%) and pies (up 10.5%). Meanwhile, general foods and beverage decreased by 4.0% and 5.9% year over year, respectively. However, the largest contributor to year-over-year growth is likely the extremely strong growth rates seen in 2020, rather than any substantial change. This is reflected in the growth on a two-year basis seen across all five categories, which either reached high double digits or triple digits—most notably, the frozen category saw the lowest two-year growth, making the category’s year-over-year growth appear stronger.
Figure 6. Food & Beverage Departments: E-Commerce and Total Sales Growth, Four Weeks Ended December 26, 2021 (YoY and Yo2Y % Change) [caption id="attachment_141717" align="aligncenter" width="700"]
Historical data have been revised for the latest periodSource: IRI E-Market Insights™/Coresight Research[/caption] 5. Health Continues to Lead Growth in Nonfood Departments The health department continued to observe the highest year-over-year growth among nonfood CPG departments at 29.4% in e-commerce and 18.5% growth in total category sales. Online growth was driven by home health care/kits (up 66.8%), denture products (59.4%) and family planning (56.0%). Homecare reported the second highest e-commerce growth, at 22.0% year over year, which is substantial given its strong comparative from 2019, which stood at 161.2%—compared to health’s slightly lower 128.0%. Unlike food departments, all nonfood departments retained strong positive growth in the mid-teens or above.
Figure 7. Nonfood Departments: E-Commerce and Total Sales Growth, Four Weeks Ended December 26, 2021 (YoY and Yo2Y % Change) [caption id="attachment_141718" align="aligncenter" width="700"]
Historical data have been revised for the latest periodSource: IRI E-Market Insights™/Coresight Research[/caption]
What We Think
While CPG e-commerce sales growth dipped this period, it nevertheless remained strong—on top of the very high rates one year prior. Two-year growth shows that all CPG e-commerce categories are substantially and consistently higher than pre-pandemic levels in 2021. The edible CPG departments, especially ones with perishable goods, faced the greatest headwinds in the four weeks ended December 26, 2021, due to the rise in the Omicron variant as workers contracted Covid-19 and supply chain constraints worsened. As Omicron cases peaked in January, we expect that logistics issues and goods shortages will continue as consumer demand for e-commerce will likely remain, and we expect departments that were able to store greater amounts of inventory to see more stable levels of growth in the next period. Looking further ahead, the evidence from other countries suggests that Omicron cases tend to fall rapidly after a sudden peak—suggesting elevated online demand could taper off swiftly. However, one lesson retailers have learnt from the pandemic is that online shopping for groceries and other goods has largely remained and consumers have so far retained elevated levels of online purchasing.IRI Disclaimer: The information contained herein is based in part on data reported by the IRI E-Market Insights™ solution and as interpreted solely by Coresight Research. The information is believed to be reliable at the time supplied by IRI but is neither all-inclusive nor guaranteed by IRI or Coresight Research, Inc. Without limiting the generality of the foregoing, specific data points may vary considerably from other information sources. Any opinions expressed herein reflect the judgement of Coresight Research, Inc. and are subject to change. IRI disclaims liability of any kind arising from the use of this information.