
albert Chan
What’s the Story?
We present findings from our latest weekly survey of US consumers, undertaken on April 5, 2021. This report includes analysis of the impacts of the Covid-19 pandemic on shopper behaviors. We explore the trends we are seeing from week to week.
Click here to read our previous US Consumer Tracker reports.
What Consumers Are Buying
- After climbing to a 2021 high last week, the proportion of consumers reporting purchasing more of any product due to the pandemic remained at nearly 70% this week.
- Household, personal care, grocery and health products remained the top categories in which consumers are purchasing more.
Figure 1a. All Respondents: What They Are Currently Buying More/Less Of Due to the Coronavirus Outbreak (% of Respondents)
[caption id="attachment_125747" align="aligncenter" width="550"]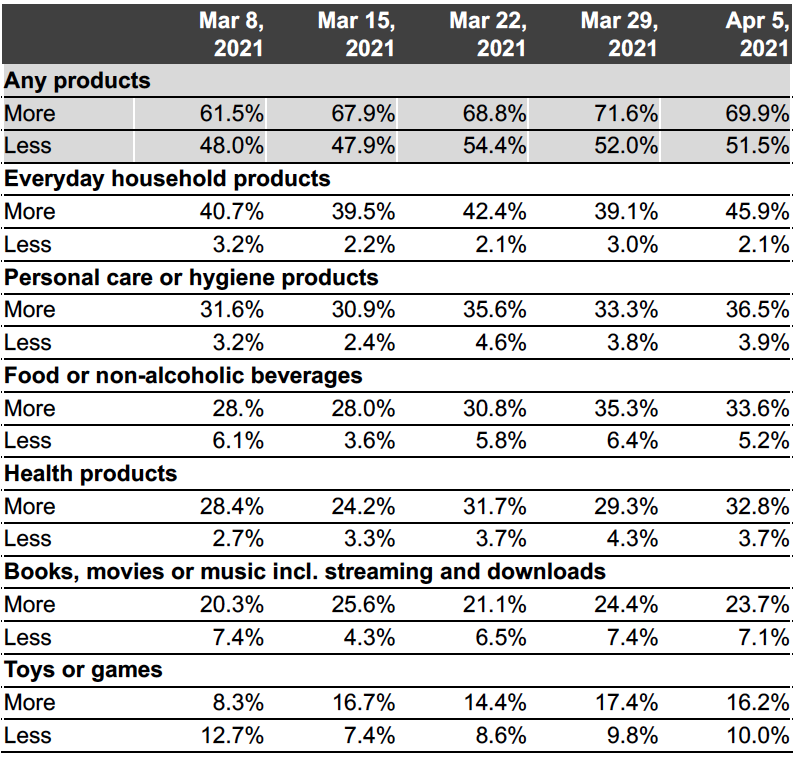 Base: US respondents aged 18+
Source: Coresight Research[/caption]
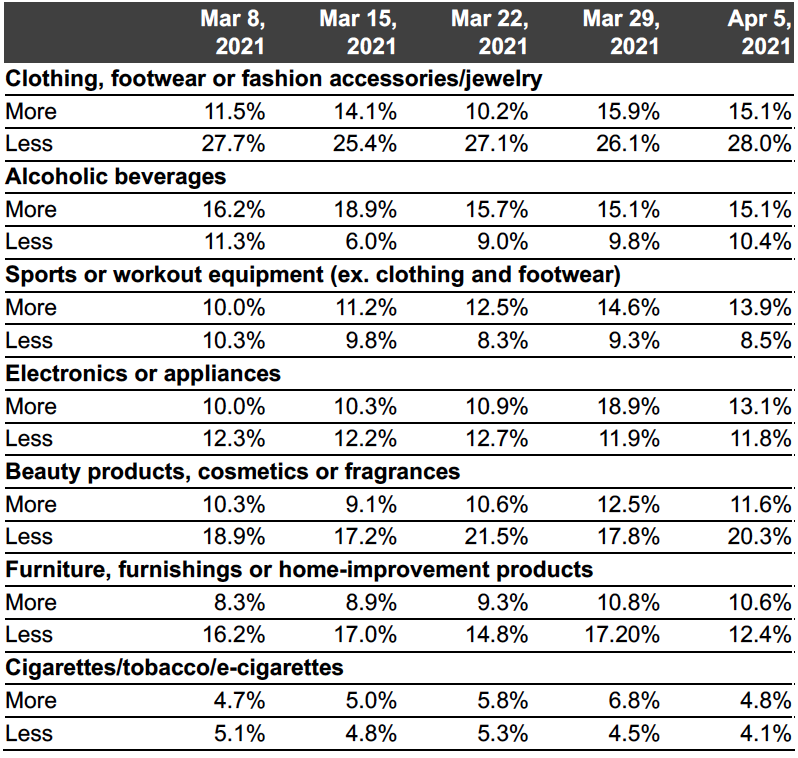
- More than one in four consumers continued to purchase less clothing due to the pandemic, while just 15.1% reported purchasing more due to the crisis, again making it the category consumers most commonly purchased less of.
- Other categories saw largely consistent purchasing habits; the only significant change was a 5.8% decline in consumers purchasing more electronics, bringing it back down to 13.1%, more in line with previous values.
Figure 1b. All Respondents: What They Are Currently Buying More/Less Of Due to the Coronavirus Outbreak (% of Respondents) [caption id="attachment_125748" align="aligncenter" width="550"]
 Base: US respondents aged 18+
Source: Coresight Research[/caption]
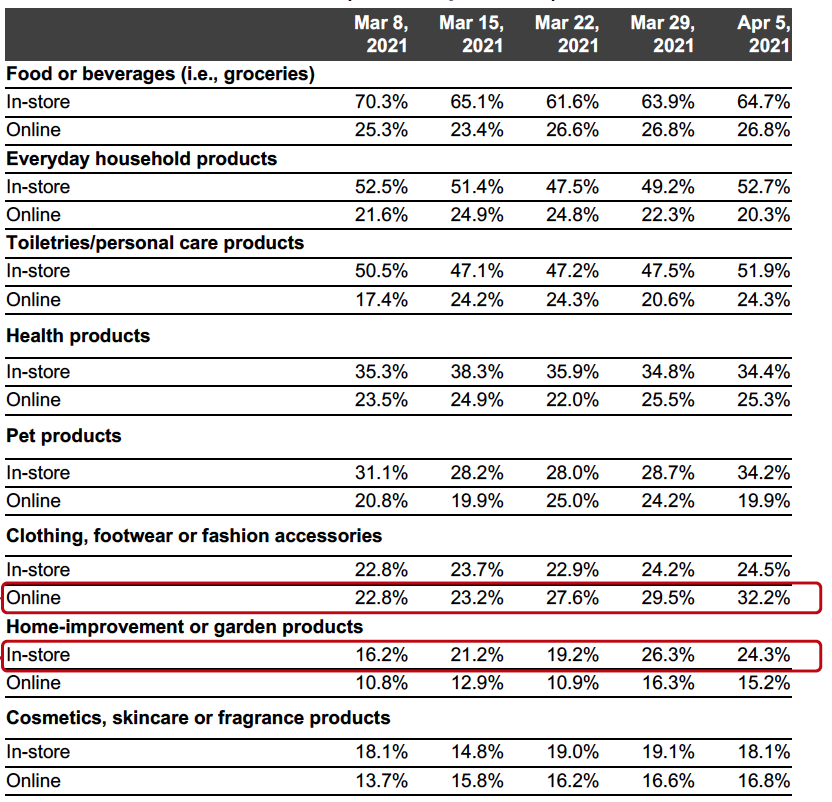
- Amid otherwise stable purchasing habits, in-store purchasing of home-improvement products stands out. Since March 8, the proportion of consumers purchasing home-improvement products in-store has risen by 8.1 percentage points, despite falling slightly this week. Online purchases of the category grew nearly five percentage points over the same time period.
- Although consumers have reported getting back to stores at higher rates, online apparel and footwear shopping has seen stronger growth than in-store shopping over the past month: Since March 8, the proportion of consumers shopping online for clothes or shoes has risen by 9.4 percentage points.
Figure 2a. All Respondents: What They Have Bought In-Store and Online in the Past Two Weeks (% of Respondents) [caption id="attachment_125749" align="aligncenter" width="550"]
 Base: US respondents aged 18+
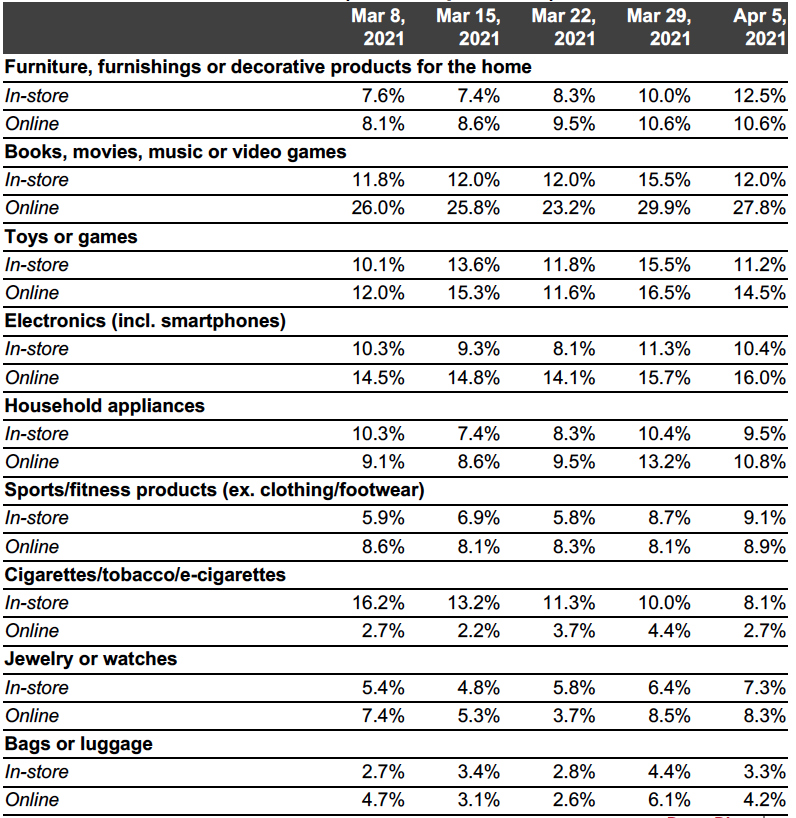
Source: Coresight Research[/caption] The past month has seen stability in purchasing habits in categories that are less frequently purchased in-store.
- Just one category in Figure 2b saw a substantial change in consumer tendencies over the past month: The proportion of consumers purchasing cigarettes and related products in-store was cut in half between March 8 and April 5 as a result of four consecutive weeks of decline.
- All other categories have seen consistent purchase habits both in-store and online.
Figure 2b. All Respondents: What They Have Bought In-Store and Online in the Past Two Weeks (% of Respondents) [caption id="attachment_125750" align="aligncenter" width="550"]
 Base: US respondents aged 18+
Source: Coresight Research[/caption]
Which Retailers Consumers Are Buying From
- Both Target and Whole Foods saw increased proportions of shoppers indicate they had shopped with them for food products in the past two weeks—potentially the result of increasingly financially secure consumers trading up to higher-price-point retailers.
- However, Aldi saw a rise in its share of shoppers by more than six percentage points this week.
Figure 3. All Respondents: Which Retailers They Have Bought Food Products From in the Past Two Weeks (% of Respondents)
[caption id="attachment_125751" align="aligncenter" width="550"]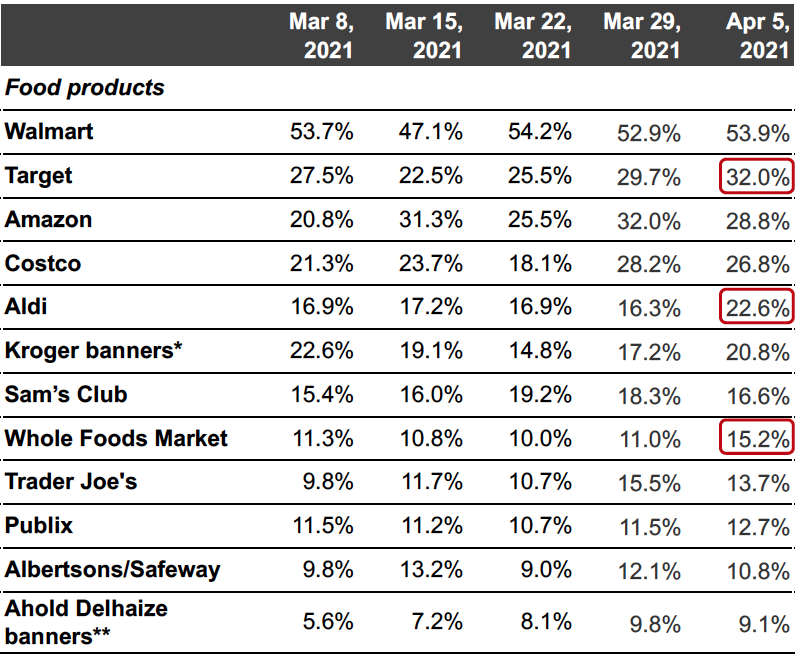 Respondents could select multiple options
Base: US respondents aged 18+
*Kroger banners include City Market, Fred Meyer, Harris Teeter, King Soopers, Kroger, Ralphs and Smith’s Food & Drug
**Ahold Delhaize banners include Food Lion, Giant, Hannaford and Stop & Shop
Source: Coresight Research[/caption]
- Amazon and Walmart have seen their share of shoppers remain consistent in the latest period, maintaining a 12-percentage-point lead over Target even as the latter gained shoppers for the third straight week.
- The highest proportion of consumers since February 15 reported shopping at Dollar Tree/Family Dollar this week, continuing the retailers’ strong performance even as competitor Dollar General saw shopper numbers fall slightly.
Figure 4. All Respondents: Which Retailers They Have Bought Nonfood Products From in the Past Two Weeks (% of Respondents)
[caption id="attachment_125752" align="aligncenter" width="550"]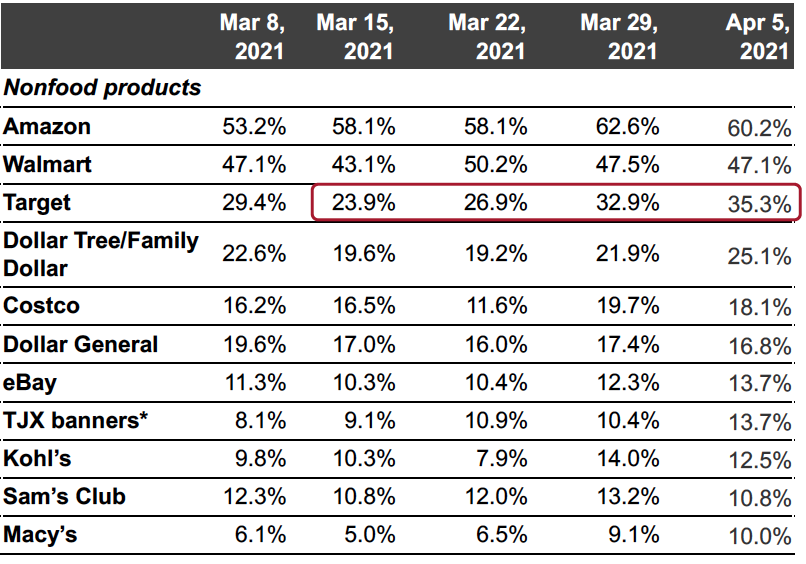 Respondents could select multiple options
Base: US respondents aged 18+
*TJX banners include HomeGoods, HomeSense, Marshalls, Sierra and T.J. Maxx
Source: Coresight Research[/caption]
What Consumers Are Doing and Where They Are Going
- Avoidance increased in seven of the 12 categories we surveyed, but all of these changes were within the margin of error.
- Avoidance of indoor public-gathering locations, namely gyms and community centers, continued to see declines in avoidance, dropping to 47.7% and 38.0% respectively.
- International travel was the only other category to see avoidance decline in both of the past two weeks, with a continued decline taking the proportion to 48.1%.
Figure 5. All Respondents: Public Places That Respondents Are Currently Avoiding (% of Respondents)
[caption id="attachment_125753" align="aligncenter" width="700"]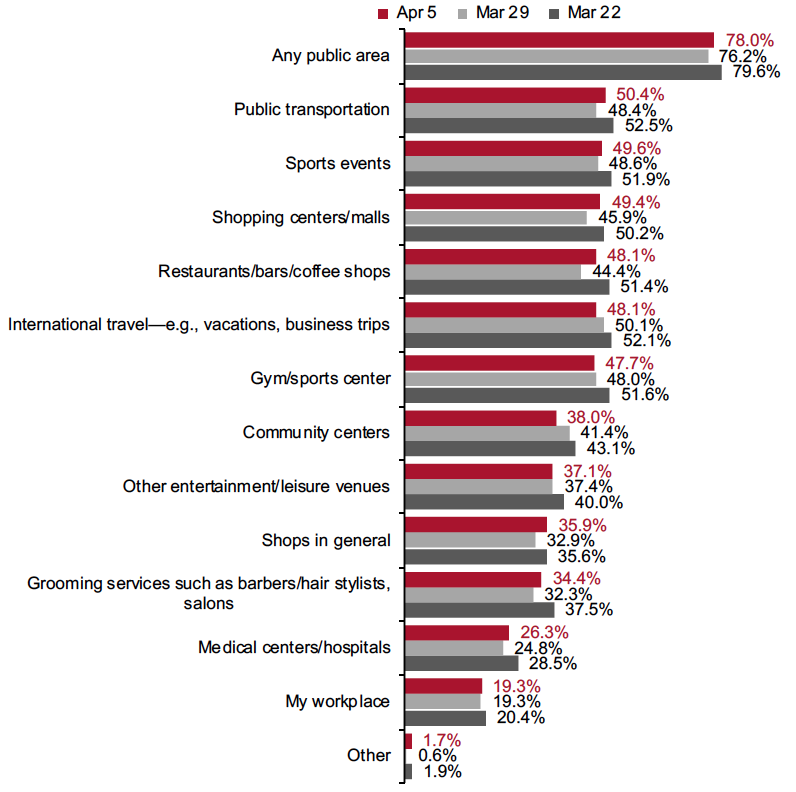 Base: US respondents aged 18+
Source: Coresight Research[/caption]
- Some 48.6% of consumers reported meeting up with friends or family in the past two weeks, 13.6 percentage points more than the proportion just two weeks prior.
- Consumers are getting back to shopping centers: The proportion of consumers visiting an open-air shopping center and enclosed shopping center both rose for the second straight week, climbing to more than seven percentage points above their respective values two weeks ago.
Figure 6. All Respondents: What Activities They Have Done in the Past Two Weeks (% of Respondents)
[caption id="attachment_125754" align="aligncenter" width="550"]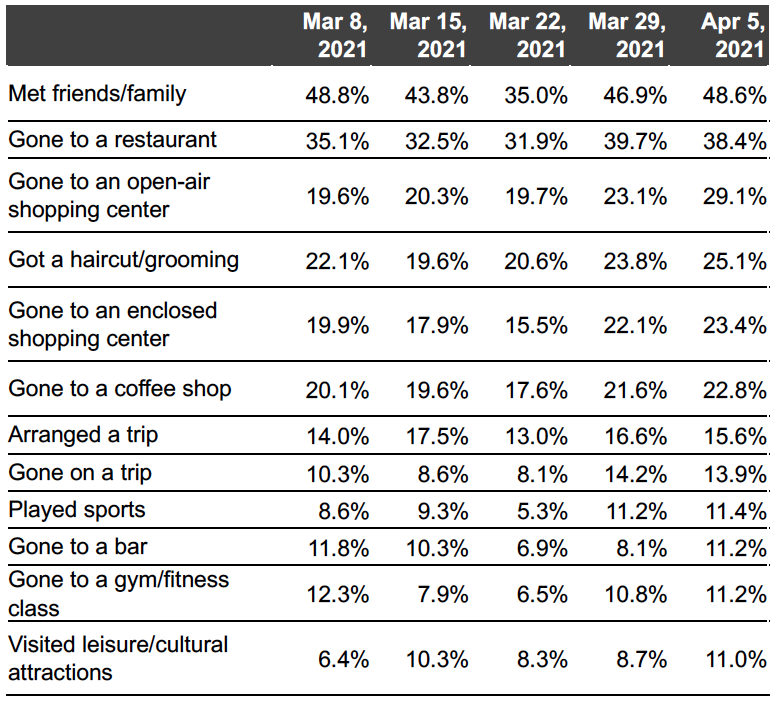 Base: US respondents aged 18+
Source: Coresight Research[/caption]
- While less than 30% of consumers in the Mid-Atlantic and New England regions of the US reported going to a restaurant in the past two weeks, more than 50% of consumers across Alabama, Kentucky, Mississippi and Tennessee reported the same.
Figure 7. All Respondents: Proportion Who Have Visited a Restaurant for Dine-In in the Past Two Weeks, by Region (% of Respondents)
[caption id="attachment_125755" align="aligncenter" width="550"]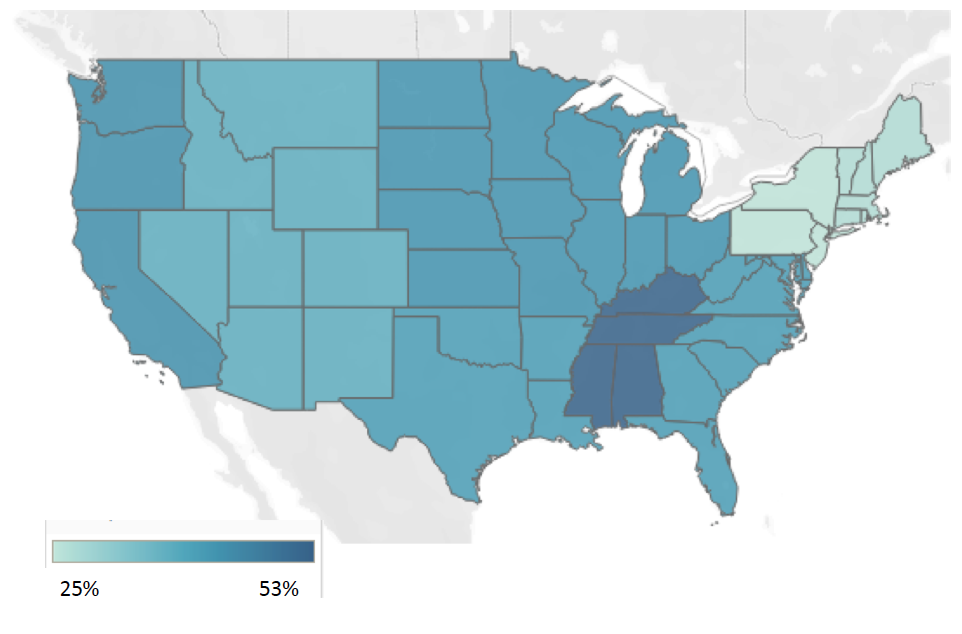 Base: US respondents aged 18+
Source: Coresight Research[/caption]
What We Think
The health landscape in the US is being pulled in opposite directions by two conflicting forces: Speedy vaccinations of about 3 million Americans per day is pressing down cases, while accelerated reopenings are giving rise to fears of a fourth Covid-19 wave. While this stagnation in health recovery is likely temporary—at the current pace of vaccination, herd immunity should be reached early in the summer—for now, it appears to be slowing consumers’ return to a less virus-conscious existence. Overall economic recovery led by a surging jobs market has helped keep the proportion of consumers buying more of product categories in our survey high, and this should effectively bridge the gap to a full and permanent vaccine-driven recovery in the late spring and summer.Implications for Brands/Retailers
- Consumers’ steady spending habits over the past few weeks reflect the duelling forces of reopenings versus vaccinations, but retailers can be optimistic about the medium-term outlook as consumers return to stores.
- With increasing financial security, more consumers appear to be trading up to slightly higher-price-point grocers, a trend that may carry over to other categories as the economy looks poised for strong growth in the months ahead.
- Retailers must carefully segment their customer base geographically, as different regions see starkly different paces of the resumption of pre-pandemic behaviors.